Free Statistics

of Irreproducible Research!

Author's title

Author*The author of this computation has been verified*
R Software Modulerwasp_autocorrelation.wasp
Title produced by software(Partial) Autocorrelation Function
Date of computationTue, 01 Dec 2009 08:04:32 -0700
Cite this page as followsStatistical Computations at FreeStatistics.org, Office for Research Development and Education, URL https://freestatistics.org/blog/index.php?v=date/2009/Dec/01/t12596799105qx1pcohihdkr7j.htm/, Retrieved Thu, 25 Apr 2024 04:47:27 +0000
Statistical Computations at FreeStatistics.org, Office for Research Development and Education, URL https://freestatistics.org/blog/index.php?pk=62078, Retrieved Thu, 25 Apr 2024 04:47:27 +0000
QR Codes:

Original text written by user:
IsPrivate?No (this computation is public)
User-defined keywords
Estimated Impact141
Family? (F = Feedback message, R = changed R code, M = changed R Module, P = changed Parameters, D = changed Data)
-     [Univariate Data Series] [data set] [2008-12-01 19:54:57] [b98453cac15ba1066b407e146608df68]
- RMP   [(Partial) Autocorrelation Function] [] [2009-11-27 14:46:03] [b98453cac15ba1066b407e146608df68]
- R  D      [(Partial) Autocorrelation Function] [] [2009-12-01 15:04:32] [7c5623390f136c6c339940134868d3e2] [Current]
- R           [(Partial) Autocorrelation Function] [] [2009-12-16 19:10:36] [00ae4ca1aa430eb3950856e282097098]
Feedback Forum

Post a new message
Dataseries X:
519
517
510
509
501
507
569
580
578
565
547
555
562
561
555
544
537
543
594
611
613
611
594
595
591
589
584
573
567
569
621
629
628
612
595
597
593
590
580
574
573
573
620
626
620
588
566
557
561
549
532
526
511
499
555
565
542
527
510
514
517
508
493
490
469
478
528
534
518
506
502
516


Summary of computational transaction
Raw Inputview raw input (R code)
Raw Outputview raw output of R engine
Computing time2 seconds
R Server'Gwilym Jenkins' @ 72.249.127.135

\begin{tabular}{lllllllll}
\hline
Summary of computational transaction \tabularnewline
Raw Input & view raw input (R code)  \tabularnewline
Raw Output & view raw output of R engine  \tabularnewline
Computing time & 2 seconds \tabularnewline
R Server & 'Gwilym Jenkins' @ 72.249.127.135 \tabularnewline
\hline
\end{tabular}
%Source: https://freestatistics.org/blog/index.php?pk=62078&T=0

[TABLE]
[ROW][C]Summary of computational transaction[/C][/ROW]
[ROW][C]Raw Input[/C][C]view raw input (R code) [/C][/ROW]
[ROW][C]Raw Output[/C][C]view raw output of R engine [/C][/ROW]
[ROW][C]Computing time[/C][C]2 seconds[/C][/ROW]
[ROW][C]R Server[/C][C]'Gwilym Jenkins' @ 72.249.127.135[/C][/ROW]
[/TABLE]
Source: https://freestatistics.org/blog/index.php?pk=62078&T=0

Globally Unique Identifier (entire table): ba.freestatistics.org/blog/index.php?pk=62078&T=0

As an alternative you can also use a QR Code:  

The GUIDs for individual cells are displayed in the table below:

Summary of computational transaction
Raw Inputview raw input (R code)
Raw Outputview raw output of R engine
Computing time2 seconds
R Server'Gwilym Jenkins' @ 72.249.127.135


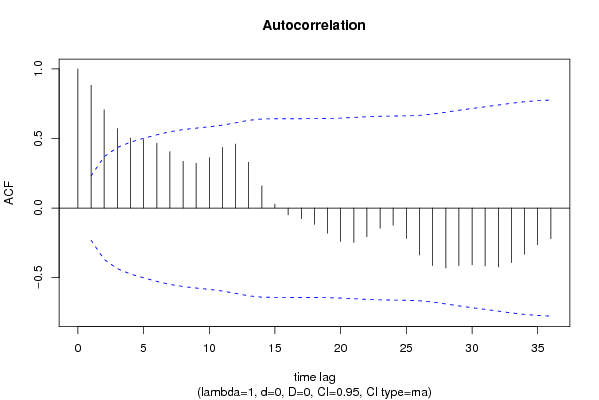
Autocorrelation Function
Time lag kACF(k)T-STATP-value
10.8827917.49070
20.7064155.99410
30.5710874.84584e-06
40.5033634.27122.9e-05
50.4932224.18514e-05
60.4666933.968.7e-05
70.4055583.44130.000484
80.3359152.85030.002846
90.3222.73230.003954
100.3629543.07980.001466
110.4355463.69570.000212
120.4601453.90450.000105
130.3289272.7910.003361
140.1596061.35430.089937
150.0278060.23590.407073
16-0.048519-0.41170.340893
17-0.076097-0.64570.26026
18-0.116896-0.99190.162285
19-0.180696-1.53330.064797
20-0.240229-2.03840.022591
21-0.247049-2.09630.019786
22-0.205364-1.74260.042839
23-0.145809-1.23720.11001
24-0.122695-1.04110.150657
25-0.218231-1.85180.034081
26-0.336992-2.85950.002774
27-0.413444-3.50820.000391
28-0.430268-3.65090.000246
29-0.413196-3.50610.000393
30-0.407365-3.45660.000461
31-0.415535-3.52590.000369
32-0.423258-3.59150.000299
33-0.39142-3.32130.000705
34-0.332725-2.82330.003072
35-0.263492-2.23580.014233
36-0.220178-1.86830.032897

\begin{tabular}{lllllllll}
\hline
Autocorrelation Function \tabularnewline
Time lag k & ACF(k) & T-STAT & P-value \tabularnewline
1 & 0.882791 & 7.4907 & 0 \tabularnewline
2 & 0.706415 & 5.9941 & 0 \tabularnewline
3 & 0.571087 & 4.8458 & 4e-06 \tabularnewline
4 & 0.503363 & 4.2712 & 2.9e-05 \tabularnewline
5 & 0.493222 & 4.1851 & 4e-05 \tabularnewline
6 & 0.466693 & 3.96 & 8.7e-05 \tabularnewline
7 & 0.405558 & 3.4413 & 0.000484 \tabularnewline
8 & 0.335915 & 2.8503 & 0.002846 \tabularnewline
9 & 0.322 & 2.7323 & 0.003954 \tabularnewline
10 & 0.362954 & 3.0798 & 0.001466 \tabularnewline
11 & 0.435546 & 3.6957 & 0.000212 \tabularnewline
12 & 0.460145 & 3.9045 & 0.000105 \tabularnewline
13 & 0.328927 & 2.791 & 0.003361 \tabularnewline
14 & 0.159606 & 1.3543 & 0.089937 \tabularnewline
15 & 0.027806 & 0.2359 & 0.407073 \tabularnewline
16 & -0.048519 & -0.4117 & 0.340893 \tabularnewline
17 & -0.076097 & -0.6457 & 0.26026 \tabularnewline
18 & -0.116896 & -0.9919 & 0.162285 \tabularnewline
19 & -0.180696 & -1.5333 & 0.064797 \tabularnewline
20 & -0.240229 & -2.0384 & 0.022591 \tabularnewline
21 & -0.247049 & -2.0963 & 0.019786 \tabularnewline
22 & -0.205364 & -1.7426 & 0.042839 \tabularnewline
23 & -0.145809 & -1.2372 & 0.11001 \tabularnewline
24 & -0.122695 & -1.0411 & 0.150657 \tabularnewline
25 & -0.218231 & -1.8518 & 0.034081 \tabularnewline
26 & -0.336992 & -2.8595 & 0.002774 \tabularnewline
27 & -0.413444 & -3.5082 & 0.000391 \tabularnewline
28 & -0.430268 & -3.6509 & 0.000246 \tabularnewline
29 & -0.413196 & -3.5061 & 0.000393 \tabularnewline
30 & -0.407365 & -3.4566 & 0.000461 \tabularnewline
31 & -0.415535 & -3.5259 & 0.000369 \tabularnewline
32 & -0.423258 & -3.5915 & 0.000299 \tabularnewline
33 & -0.39142 & -3.3213 & 0.000705 \tabularnewline
34 & -0.332725 & -2.8233 & 0.003072 \tabularnewline
35 & -0.263492 & -2.2358 & 0.014233 \tabularnewline
36 & -0.220178 & -1.8683 & 0.032897 \tabularnewline
\hline
\end{tabular}
%Source: https://freestatistics.org/blog/index.php?pk=62078&T=1

[TABLE]
[ROW][C]Autocorrelation Function[/C][/ROW]
[ROW][C]Time lag k[/C][C]ACF(k)[/C][C]T-STAT[/C][C]P-value[/C][/ROW]
[ROW][C]1[/C][C]0.882791[/C][C]7.4907[/C][C]0[/C][/ROW]
[ROW][C]2[/C][C]0.706415[/C][C]5.9941[/C][C]0[/C][/ROW]
[ROW][C]3[/C][C]0.571087[/C][C]4.8458[/C][C]4e-06[/C][/ROW]
[ROW][C]4[/C][C]0.503363[/C][C]4.2712[/C][C]2.9e-05[/C][/ROW]
[ROW][C]5[/C][C]0.493222[/C][C]4.1851[/C][C]4e-05[/C][/ROW]
[ROW][C]6[/C][C]0.466693[/C][C]3.96[/C][C]8.7e-05[/C][/ROW]
[ROW][C]7[/C][C]0.405558[/C][C]3.4413[/C][C]0.000484[/C][/ROW]
[ROW][C]8[/C][C]0.335915[/C][C]2.8503[/C][C]0.002846[/C][/ROW]
[ROW][C]9[/C][C]0.322[/C][C]2.7323[/C][C]0.003954[/C][/ROW]
[ROW][C]10[/C][C]0.362954[/C][C]3.0798[/C][C]0.001466[/C][/ROW]
[ROW][C]11[/C][C]0.435546[/C][C]3.6957[/C][C]0.000212[/C][/ROW]
[ROW][C]12[/C][C]0.460145[/C][C]3.9045[/C][C]0.000105[/C][/ROW]
[ROW][C]13[/C][C]0.328927[/C][C]2.791[/C][C]0.003361[/C][/ROW]
[ROW][C]14[/C][C]0.159606[/C][C]1.3543[/C][C]0.089937[/C][/ROW]
[ROW][C]15[/C][C]0.027806[/C][C]0.2359[/C][C]0.407073[/C][/ROW]
[ROW][C]16[/C][C]-0.048519[/C][C]-0.4117[/C][C]0.340893[/C][/ROW]
[ROW][C]17[/C][C]-0.076097[/C][C]-0.6457[/C][C]0.26026[/C][/ROW]
[ROW][C]18[/C][C]-0.116896[/C][C]-0.9919[/C][C]0.162285[/C][/ROW]
[ROW][C]19[/C][C]-0.180696[/C][C]-1.5333[/C][C]0.064797[/C][/ROW]
[ROW][C]20[/C][C]-0.240229[/C][C]-2.0384[/C][C]0.022591[/C][/ROW]
[ROW][C]21[/C][C]-0.247049[/C][C]-2.0963[/C][C]0.019786[/C][/ROW]
[ROW][C]22[/C][C]-0.205364[/C][C]-1.7426[/C][C]0.042839[/C][/ROW]
[ROW][C]23[/C][C]-0.145809[/C][C]-1.2372[/C][C]0.11001[/C][/ROW]
[ROW][C]24[/C][C]-0.122695[/C][C]-1.0411[/C][C]0.150657[/C][/ROW]
[ROW][C]25[/C][C]-0.218231[/C][C]-1.8518[/C][C]0.034081[/C][/ROW]
[ROW][C]26[/C][C]-0.336992[/C][C]-2.8595[/C][C]0.002774[/C][/ROW]
[ROW][C]27[/C][C]-0.413444[/C][C]-3.5082[/C][C]0.000391[/C][/ROW]
[ROW][C]28[/C][C]-0.430268[/C][C]-3.6509[/C][C]0.000246[/C][/ROW]
[ROW][C]29[/C][C]-0.413196[/C][C]-3.5061[/C][C]0.000393[/C][/ROW]
[ROW][C]30[/C][C]-0.407365[/C][C]-3.4566[/C][C]0.000461[/C][/ROW]
[ROW][C]31[/C][C]-0.415535[/C][C]-3.5259[/C][C]0.000369[/C][/ROW]
[ROW][C]32[/C][C]-0.423258[/C][C]-3.5915[/C][C]0.000299[/C][/ROW]
[ROW][C]33[/C][C]-0.39142[/C][C]-3.3213[/C][C]0.000705[/C][/ROW]
[ROW][C]34[/C][C]-0.332725[/C][C]-2.8233[/C][C]0.003072[/C][/ROW]
[ROW][C]35[/C][C]-0.263492[/C][C]-2.2358[/C][C]0.014233[/C][/ROW]
[ROW][C]36[/C][C]-0.220178[/C][C]-1.8683[/C][C]0.032897[/C][/ROW]
[/TABLE]
Source: https://freestatistics.org/blog/index.php?pk=62078&T=1

Globally Unique Identifier (entire table): ba.freestatistics.org/blog/index.php?pk=62078&T=1

As an alternative you can also use a QR Code:  

The GUIDs for individual cells are displayed in the table below:

Autocorrelation Function
Time lag kACF(k)T-STATP-value
10.8827917.49070
20.7064155.99410
30.5710874.84584e-06
40.5033634.27122.9e-05
50.4932224.18514e-05
60.4666933.968.7e-05
70.4055583.44130.000484
80.3359152.85030.002846
90.3222.73230.003954
100.3629543.07980.001466
110.4355463.69570.000212
120.4601453.90450.000105
130.3289272.7910.003361
140.1596061.35430.089937
150.0278060.23590.407073
16-0.048519-0.41170.340893
17-0.076097-0.64570.26026
18-0.116896-0.99190.162285
19-0.180696-1.53330.064797
20-0.240229-2.03840.022591
21-0.247049-2.09630.019786
22-0.205364-1.74260.042839
23-0.145809-1.23720.11001
24-0.122695-1.04110.150657
25-0.218231-1.85180.034081
26-0.336992-2.85950.002774
27-0.413444-3.50820.000391
28-0.430268-3.65090.000246
29-0.413196-3.50610.000393
30-0.407365-3.45660.000461
31-0.415535-3.52590.000369
32-0.423258-3.59150.000299
33-0.39142-3.32130.000705
34-0.332725-2.82330.003072
35-0.263492-2.23580.014233
36-0.220178-1.86830.032897


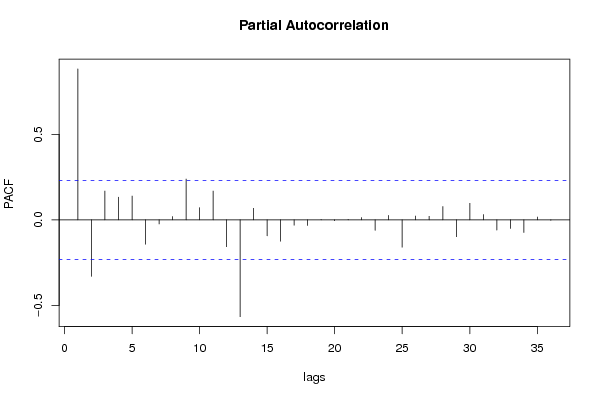
Partial Autocorrelation Function
Time lag kPACF(k)T-STATP-value
10.8827917.49070
2-0.330366-2.80330.003248
30.1683271.42830.078764
40.1325941.12510.132142
50.1392381.18150.120652
6-0.142118-1.20590.115899
7-0.024134-0.20480.419159
80.0193510.16420.435019
90.2388722.02690.023188
100.0713470.60540.273408
110.1687651.4320.078232
12-0.156794-1.33040.093786
13-0.566152-4.8044e-06
140.067370.57170.284669
15-0.0931-0.790.216068
16-0.124525-1.05660.147106
17-0.031331-0.26590.395556
18-0.032983-0.27990.390191
190.0017220.01460.494192
20-0.005193-0.04410.482488
210.0022480.01910.492417
220.0134640.11420.454682
23-0.061415-0.52110.301941
240.0262330.22260.412242
25-0.159757-1.35560.089734
260.0224520.19050.424721
270.0206330.17510.430754
280.0781220.66290.254759
29-0.098201-0.83330.203726
300.0965320.81910.207716
310.0311810.26460.396045
32-0.059343-0.50350.308059
33-0.050496-0.42850.334793
34-0.073462-0.62330.267514
350.0161470.1370.445702
36-0.002653-0.02250.491051

\begin{tabular}{lllllllll}
\hline
Partial Autocorrelation Function \tabularnewline
Time lag k & PACF(k) & T-STAT & P-value \tabularnewline
1 & 0.882791 & 7.4907 & 0 \tabularnewline
2 & -0.330366 & -2.8033 & 0.003248 \tabularnewline
3 & 0.168327 & 1.4283 & 0.078764 \tabularnewline
4 & 0.132594 & 1.1251 & 0.132142 \tabularnewline
5 & 0.139238 & 1.1815 & 0.120652 \tabularnewline
6 & -0.142118 & -1.2059 & 0.115899 \tabularnewline
7 & -0.024134 & -0.2048 & 0.419159 \tabularnewline
8 & 0.019351 & 0.1642 & 0.435019 \tabularnewline
9 & 0.238872 & 2.0269 & 0.023188 \tabularnewline
10 & 0.071347 & 0.6054 & 0.273408 \tabularnewline
11 & 0.168765 & 1.432 & 0.078232 \tabularnewline
12 & -0.156794 & -1.3304 & 0.093786 \tabularnewline
13 & -0.566152 & -4.804 & 4e-06 \tabularnewline
14 & 0.06737 & 0.5717 & 0.284669 \tabularnewline
15 & -0.0931 & -0.79 & 0.216068 \tabularnewline
16 & -0.124525 & -1.0566 & 0.147106 \tabularnewline
17 & -0.031331 & -0.2659 & 0.395556 \tabularnewline
18 & -0.032983 & -0.2799 & 0.390191 \tabularnewline
19 & 0.001722 & 0.0146 & 0.494192 \tabularnewline
20 & -0.005193 & -0.0441 & 0.482488 \tabularnewline
21 & 0.002248 & 0.0191 & 0.492417 \tabularnewline
22 & 0.013464 & 0.1142 & 0.454682 \tabularnewline
23 & -0.061415 & -0.5211 & 0.301941 \tabularnewline
24 & 0.026233 & 0.2226 & 0.412242 \tabularnewline
25 & -0.159757 & -1.3556 & 0.089734 \tabularnewline
26 & 0.022452 & 0.1905 & 0.424721 \tabularnewline
27 & 0.020633 & 0.1751 & 0.430754 \tabularnewline
28 & 0.078122 & 0.6629 & 0.254759 \tabularnewline
29 & -0.098201 & -0.8333 & 0.203726 \tabularnewline
30 & 0.096532 & 0.8191 & 0.207716 \tabularnewline
31 & 0.031181 & 0.2646 & 0.396045 \tabularnewline
32 & -0.059343 & -0.5035 & 0.308059 \tabularnewline
33 & -0.050496 & -0.4285 & 0.334793 \tabularnewline
34 & -0.073462 & -0.6233 & 0.267514 \tabularnewline
35 & 0.016147 & 0.137 & 0.445702 \tabularnewline
36 & -0.002653 & -0.0225 & 0.491051 \tabularnewline
\hline
\end{tabular}
%Source: https://freestatistics.org/blog/index.php?pk=62078&T=2

[TABLE]
[ROW][C]Partial Autocorrelation Function[/C][/ROW]
[ROW][C]Time lag k[/C][C]PACF(k)[/C][C]T-STAT[/C][C]P-value[/C][/ROW]
[ROW][C]1[/C][C]0.882791[/C][C]7.4907[/C][C]0[/C][/ROW]
[ROW][C]2[/C][C]-0.330366[/C][C]-2.8033[/C][C]0.003248[/C][/ROW]
[ROW][C]3[/C][C]0.168327[/C][C]1.4283[/C][C]0.078764[/C][/ROW]
[ROW][C]4[/C][C]0.132594[/C][C]1.1251[/C][C]0.132142[/C][/ROW]
[ROW][C]5[/C][C]0.139238[/C][C]1.1815[/C][C]0.120652[/C][/ROW]
[ROW][C]6[/C][C]-0.142118[/C][C]-1.2059[/C][C]0.115899[/C][/ROW]
[ROW][C]7[/C][C]-0.024134[/C][C]-0.2048[/C][C]0.419159[/C][/ROW]
[ROW][C]8[/C][C]0.019351[/C][C]0.1642[/C][C]0.435019[/C][/ROW]
[ROW][C]9[/C][C]0.238872[/C][C]2.0269[/C][C]0.023188[/C][/ROW]
[ROW][C]10[/C][C]0.071347[/C][C]0.6054[/C][C]0.273408[/C][/ROW]
[ROW][C]11[/C][C]0.168765[/C][C]1.432[/C][C]0.078232[/C][/ROW]
[ROW][C]12[/C][C]-0.156794[/C][C]-1.3304[/C][C]0.093786[/C][/ROW]
[ROW][C]13[/C][C]-0.566152[/C][C]-4.804[/C][C]4e-06[/C][/ROW]
[ROW][C]14[/C][C]0.06737[/C][C]0.5717[/C][C]0.284669[/C][/ROW]
[ROW][C]15[/C][C]-0.0931[/C][C]-0.79[/C][C]0.216068[/C][/ROW]
[ROW][C]16[/C][C]-0.124525[/C][C]-1.0566[/C][C]0.147106[/C][/ROW]
[ROW][C]17[/C][C]-0.031331[/C][C]-0.2659[/C][C]0.395556[/C][/ROW]
[ROW][C]18[/C][C]-0.032983[/C][C]-0.2799[/C][C]0.390191[/C][/ROW]
[ROW][C]19[/C][C]0.001722[/C][C]0.0146[/C][C]0.494192[/C][/ROW]
[ROW][C]20[/C][C]-0.005193[/C][C]-0.0441[/C][C]0.482488[/C][/ROW]
[ROW][C]21[/C][C]0.002248[/C][C]0.0191[/C][C]0.492417[/C][/ROW]
[ROW][C]22[/C][C]0.013464[/C][C]0.1142[/C][C]0.454682[/C][/ROW]
[ROW][C]23[/C][C]-0.061415[/C][C]-0.5211[/C][C]0.301941[/C][/ROW]
[ROW][C]24[/C][C]0.026233[/C][C]0.2226[/C][C]0.412242[/C][/ROW]
[ROW][C]25[/C][C]-0.159757[/C][C]-1.3556[/C][C]0.089734[/C][/ROW]
[ROW][C]26[/C][C]0.022452[/C][C]0.1905[/C][C]0.424721[/C][/ROW]
[ROW][C]27[/C][C]0.020633[/C][C]0.1751[/C][C]0.430754[/C][/ROW]
[ROW][C]28[/C][C]0.078122[/C][C]0.6629[/C][C]0.254759[/C][/ROW]
[ROW][C]29[/C][C]-0.098201[/C][C]-0.8333[/C][C]0.203726[/C][/ROW]
[ROW][C]30[/C][C]0.096532[/C][C]0.8191[/C][C]0.207716[/C][/ROW]
[ROW][C]31[/C][C]0.031181[/C][C]0.2646[/C][C]0.396045[/C][/ROW]
[ROW][C]32[/C][C]-0.059343[/C][C]-0.5035[/C][C]0.308059[/C][/ROW]
[ROW][C]33[/C][C]-0.050496[/C][C]-0.4285[/C][C]0.334793[/C][/ROW]
[ROW][C]34[/C][C]-0.073462[/C][C]-0.6233[/C][C]0.267514[/C][/ROW]
[ROW][C]35[/C][C]0.016147[/C][C]0.137[/C][C]0.445702[/C][/ROW]
[ROW][C]36[/C][C]-0.002653[/C][C]-0.0225[/C][C]0.491051[/C][/ROW]
[/TABLE]
Source: https://freestatistics.org/blog/index.php?pk=62078&T=2

Globally Unique Identifier (entire table): ba.freestatistics.org/blog/index.php?pk=62078&T=2

As an alternative you can also use a QR Code:  

The GUIDs for individual cells are displayed in the table below:

Partial Autocorrelation Function
Time lag kPACF(k)T-STATP-value
10.8827917.49070
2-0.330366-2.80330.003248
30.1683271.42830.078764
40.1325941.12510.132142
50.1392381.18150.120652
6-0.142118-1.20590.115899
7-0.024134-0.20480.419159
80.0193510.16420.435019
90.2388722.02690.023188
100.0713470.60540.273408
110.1687651.4320.078232
12-0.156794-1.33040.093786
13-0.566152-4.8044e-06
140.067370.57170.284669
15-0.0931-0.790.216068
16-0.124525-1.05660.147106
17-0.031331-0.26590.395556
18-0.032983-0.27990.390191
190.0017220.01460.494192
20-0.005193-0.04410.482488
210.0022480.01910.492417
220.0134640.11420.454682
23-0.061415-0.52110.301941
240.0262330.22260.412242
25-0.159757-1.35560.089734
260.0224520.19050.424721
270.0206330.17510.430754
280.0781220.66290.254759
29-0.098201-0.83330.203726
300.0965320.81910.207716
310.0311810.26460.396045
32-0.059343-0.50350.308059
33-0.050496-0.42850.334793
34-0.073462-0.62330.267514
350.0161470.1370.445702
36-0.002653-0.02250.491051


Parameters (Session):
par1 = 36 ; par2 = 1 ; par3 = 0 ; par4 = 0 ; par5 = 12 ; par6 = MA ; par7 = 0.95 ;
Parameters (R input):
par1 = 36 ; par2 = 1 ; par3 = 0 ; par4 = 0 ; par5 = 12 ; par6 = MA ; par7 = 0.95 ;
R code (references can be found in the software module):
if (par1 == 'Default') {
par1 = 10*log10(length(x))
} else {
par1 <- as.numeric(par1)
}
par2 <- as.numeric(par2)
par3 <- as.numeric(par3)
par4 <- as.numeric(par4)
par5 <- as.numeric(par5)
if (par6 == 'White Noise') par6 <- 'white' else par6 <- 'ma'
par7 <- as.numeric(par7)
if (par2 == 0) {
x <- log(x)
} else {
x <- (x ^ par2 - 1) / par2
}
if (par3 > 0) x <- diff(x,lag=1,difference=par3)
if (par4 > 0) x <- diff(x,lag=par5,difference=par4)
bitmap(file='pic1.png')
racf <- acf(x, par1, main='Autocorrelation', xlab='time lag', ylab='ACF', ci.type=par6, ci=par7, sub=paste('(lambda=',par2,', d=',par3,', D=',par4,', CI=', par7, ', CI type=',par6,')',sep=''))
dev.off()
bitmap(file='pic2.png')
rpacf <- pacf(x,par1,main='Partial Autocorrelation',xlab='lags',ylab='PACF')
dev.off()
(myacf <- c(racf$acf))
(mypacf <- c(rpacf$acf))
lengthx <- length(x)
sqrtn <- sqrt(lengthx)
load(file='createtable')
a<-table.start()
a<-table.row.start(a)
a<-table.element(a,'Autocorrelation Function',4,TRUE)
a<-table.row.end(a)
a<-table.row.start(a)
a<-table.element(a,'Time lag k',header=TRUE)
a<-table.element(a,hyperlink('basics.htm','ACF(k)','click here for more information about the Autocorrelation Function'),header=TRUE)
a<-table.element(a,'T-STAT',header=TRUE)
a<-table.element(a,'P-value',header=TRUE)
a<-table.row.end(a)
for (i in 2:(par1+1)) {
a<-table.row.start(a)
a<-table.element(a,i-1,header=TRUE)
a<-table.element(a,round(myacf[i],6))
mytstat <- myacf[i]*sqrtn
a<-table.element(a,round(mytstat,4))
a<-table.element(a,round(1-pt(abs(mytstat),lengthx),6))
a<-table.row.end(a)
}
a<-table.end(a)
table.save(a,file='mytable.tab')
a<-table.start()
a<-table.row.start(a)
a<-table.element(a,'Partial Autocorrelation Function',4,TRUE)
a<-table.row.end(a)
a<-table.row.start(a)
a<-table.element(a,'Time lag k',header=TRUE)
a<-table.element(a,hyperlink('basics.htm','PACF(k)','click here for more information about the Partial Autocorrelation Function'),header=TRUE)
a<-table.element(a,'T-STAT',header=TRUE)
a<-table.element(a,'P-value',header=TRUE)
a<-table.row.end(a)
for (i in 1:par1) {
a<-table.row.start(a)
a<-table.element(a,i,header=TRUE)
a<-table.element(a,round(mypacf[i],6))
mytstat <- mypacf[i]*sqrtn
a<-table.element(a,round(mytstat,4))
a<-table.element(a,round(1-pt(abs(mytstat),lengthx),6))
a<-table.row.end(a)
}
a<-table.end(a)
table.save(a,file='mytable1.tab')