Free Statistics

of Irreproducible Research!

Author's title

Author*The author of this computation has been verified*
R Software Modulerwasp_arimabackwardselection.wasp
Title produced by softwareARIMA Backward Selection
Date of computationTue, 01 Dec 2009 07:34:51 -0700
Cite this page as followsStatistical Computations at FreeStatistics.org, Office for Research Development and Education, URL https://freestatistics.org/blog/index.php?v=date/2009/Dec/01/t1259678198odguge1tglet6bl.htm/, Retrieved Thu, 18 Apr 2024 21:57:22 +0000
Statistical Computations at FreeStatistics.org, Office for Research Development and Education, URL https://freestatistics.org/blog/index.php?pk=62058, Retrieved Thu, 18 Apr 2024 21:57:22 +0000
QR Codes:

Original text written by user:
IsPrivate?No (this computation is public)
User-defined keywords
Estimated Impact155
Family? (F = Feedback message, R = changed R code, M = changed R Module, P = changed Parameters, D = changed Data)
-     [Univariate Data Series] [data set] [2008-12-01 19:54:57] [b98453cac15ba1066b407e146608df68]
- RMP   [ARIMA Backward Selection] [] [2009-11-27 14:53:14] [b98453cac15ba1066b407e146608df68]
-   PD      [ARIMA Backward Selection] [Ws 8 arima] [2009-12-01 14:34:51] [51d49d3536f6a59f2486a67bf50b2759] [Current]
Feedback Forum

Post a new message
Dataseries X:
1901
1395
1639
1643
1751
1797
1373
1558
1555
2061
2010
2119
1985
1963
2017
1975
1589
1679
1392
1511
1449
1767
1899
2179
2217
2049
2343
2175
1607
1702
1764
1766
1615
1953
2091
2411
2550
2351
2786
2525
2474
2332
1978
1789
1904
1997
2207
2453
1948
1384
1989
2140
2100
2045
2083
2022
1950
1422
1859
2147


Summary of computational transaction
Raw Inputview raw input (R code)
Raw Outputview raw output of R engine
Computing time22 seconds
R Server'Gwilym Jenkins' @ 72.249.127.135

\begin{tabular}{lllllllll}
\hline
Summary of computational transaction \tabularnewline
Raw Input & view raw input (R code)  \tabularnewline
Raw Output & view raw output of R engine  \tabularnewline
Computing time & 22 seconds \tabularnewline
R Server & 'Gwilym Jenkins' @ 72.249.127.135 \tabularnewline
\hline
\end{tabular}
%Source: https://freestatistics.org/blog/index.php?pk=62058&T=0

[TABLE]
[ROW][C]Summary of computational transaction[/C][/ROW]
[ROW][C]Raw Input[/C][C]view raw input (R code) [/C][/ROW]
[ROW][C]Raw Output[/C][C]view raw output of R engine [/C][/ROW]
[ROW][C]Computing time[/C][C]22 seconds[/C][/ROW]
[ROW][C]R Server[/C][C]'Gwilym Jenkins' @ 72.249.127.135[/C][/ROW]
[/TABLE]
Source: https://freestatistics.org/blog/index.php?pk=62058&T=0

Globally Unique Identifier (entire table): ba.freestatistics.org/blog/index.php?pk=62058&T=0

As an alternative you can also use a QR Code:  

The GUIDs for individual cells are displayed in the table below:

Summary of computational transaction
Raw Inputview raw input (R code)
Raw Outputview raw output of R engine
Computing time22 seconds
R Server'Gwilym Jenkins' @ 72.249.127.135


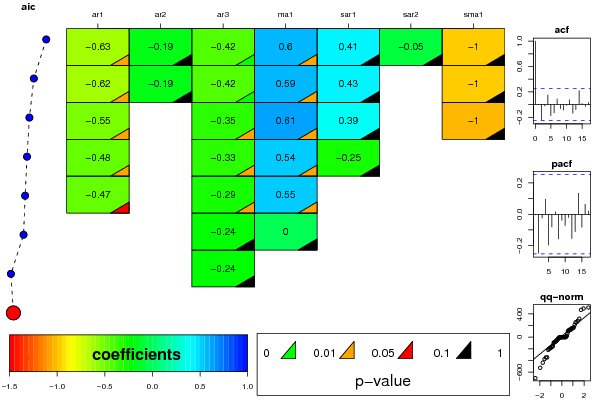
ARIMA Parameter Estimation and Backward Selection
Iterationar1ar2ar3ma1sar1sar2sma1
Estimates ( 1 )-0.6263-0.1934-0.42290.59840.4125-0.0539-0.9964
(p-val)(0.02 )(0.2517 )(0.0071 )(0.0231 )(0.228 )(0.8321 )(0.3842 )
Estimates ( 2 )-0.6159-0.1852-0.41930.59120.43060-0.9992
(p-val)(0.0184 )(0.2559 )(0.0069 )(0.0221 )(0.1805 )(NA )(0.1619 )
Estimates ( 3 )-0.54880-0.34710.61180.3920-1.0022
(p-val)(0.016 )(NA )(0.0216 )(0.0144 )(0.2286 )(NA )(0.5341 )
Estimates ( 4 )-0.47660-0.32620.5413-0.254300
(p-val)(0.0439 )(NA )(0.0262 )(0.0366 )(0.1815 )(NA )(NA )
Estimates ( 5 )-0.46710-0.28520.55000
(p-val)(0.0548 )(NA )(0.0448 )(0.0357 )(NA )(NA )(NA )
Estimates ( 6 )00-0.2443-5e-04000
(p-val)(NA )(NA )(0.122 )(0.9981 )(NA )(NA )(NA )
Estimates ( 7 )00-0.24420000
(p-val)(NA )(NA )(0.1203 )(NA )(NA )(NA )(NA )
Estimates ( 8 )0000000
(p-val)(NA )(NA )(NA )(NA )(NA )(NA )(NA )
Estimates ( 9 )NANANANANANANA
(p-val)(NA )(NA )(NA )(NA )(NA )(NA )(NA )
Estimates ( 10 )NANANANANANANA
(p-val)(NA )(NA )(NA )(NA )(NA )(NA )(NA )
Estimates ( 11 )NANANANANANANA
(p-val)(NA )(NA )(NA )(NA )(NA )(NA )(NA )
Estimates ( 12 )NANANANANANANA
(p-val)(NA )(NA )(NA )(NA )(NA )(NA )(NA )
Estimates ( 13 )NANANANANANANA
(p-val)(NA )(NA )(NA )(NA )(NA )(NA )(NA )

\begin{tabular}{lllllllll}
\hline
ARIMA Parameter Estimation and Backward Selection \tabularnewline
Iteration & ar1 & ar2 & ar3 & ma1 & sar1 & sar2 & sma1 \tabularnewline
Estimates ( 1 ) & -0.6263 & -0.1934 & -0.4229 & 0.5984 & 0.4125 & -0.0539 & -0.9964 \tabularnewline
(p-val) & (0.02 ) & (0.2517 ) & (0.0071 ) & (0.0231 ) & (0.228 ) & (0.8321 ) & (0.3842 ) \tabularnewline
Estimates ( 2 ) & -0.6159 & -0.1852 & -0.4193 & 0.5912 & 0.4306 & 0 & -0.9992 \tabularnewline
(p-val) & (0.0184 ) & (0.2559 ) & (0.0069 ) & (0.0221 ) & (0.1805 ) & (NA ) & (0.1619 ) \tabularnewline
Estimates ( 3 ) & -0.5488 & 0 & -0.3471 & 0.6118 & 0.392 & 0 & -1.0022 \tabularnewline
(p-val) & (0.016 ) & (NA ) & (0.0216 ) & (0.0144 ) & (0.2286 ) & (NA ) & (0.5341 ) \tabularnewline
Estimates ( 4 ) & -0.4766 & 0 & -0.3262 & 0.5413 & -0.2543 & 0 & 0 \tabularnewline
(p-val) & (0.0439 ) & (NA ) & (0.0262 ) & (0.0366 ) & (0.1815 ) & (NA ) & (NA ) \tabularnewline
Estimates ( 5 ) & -0.4671 & 0 & -0.2852 & 0.55 & 0 & 0 & 0 \tabularnewline
(p-val) & (0.0548 ) & (NA ) & (0.0448 ) & (0.0357 ) & (NA ) & (NA ) & (NA ) \tabularnewline
Estimates ( 6 ) & 0 & 0 & -0.2443 & -5e-04 & 0 & 0 & 0 \tabularnewline
(p-val) & (NA ) & (NA ) & (0.122 ) & (0.9981 ) & (NA ) & (NA ) & (NA ) \tabularnewline
Estimates ( 7 ) & 0 & 0 & -0.2442 & 0 & 0 & 0 & 0 \tabularnewline
(p-val) & (NA ) & (NA ) & (0.1203 ) & (NA ) & (NA ) & (NA ) & (NA ) \tabularnewline
Estimates ( 8 ) & 0 & 0 & 0 & 0 & 0 & 0 & 0 \tabularnewline
(p-val) & (NA ) & (NA ) & (NA ) & (NA ) & (NA ) & (NA ) & (NA ) \tabularnewline
Estimates ( 9 ) & NA & NA & NA & NA & NA & NA & NA \tabularnewline
(p-val) & (NA ) & (NA ) & (NA ) & (NA ) & (NA ) & (NA ) & (NA ) \tabularnewline
Estimates ( 10 ) & NA & NA & NA & NA & NA & NA & NA \tabularnewline
(p-val) & (NA ) & (NA ) & (NA ) & (NA ) & (NA ) & (NA ) & (NA ) \tabularnewline
Estimates ( 11 ) & NA & NA & NA & NA & NA & NA & NA \tabularnewline
(p-val) & (NA ) & (NA ) & (NA ) & (NA ) & (NA ) & (NA ) & (NA ) \tabularnewline
Estimates ( 12 ) & NA & NA & NA & NA & NA & NA & NA \tabularnewline
(p-val) & (NA ) & (NA ) & (NA ) & (NA ) & (NA ) & (NA ) & (NA ) \tabularnewline
Estimates ( 13 ) & NA & NA & NA & NA & NA & NA & NA \tabularnewline
(p-val) & (NA ) & (NA ) & (NA ) & (NA ) & (NA ) & (NA ) & (NA ) \tabularnewline
\hline
\end{tabular}
%Source: https://freestatistics.org/blog/index.php?pk=62058&T=1

[TABLE]
[ROW][C]ARIMA Parameter Estimation and Backward Selection[/C][/ROW]
[ROW][C]Iteration[/C][C]ar1[/C][C]ar2[/C][C]ar3[/C][C]ma1[/C][C]sar1[/C][C]sar2[/C][C]sma1[/C][/ROW]
[ROW][C]Estimates ( 1 )[/C][C]-0.6263[/C][C]-0.1934[/C][C]-0.4229[/C][C]0.5984[/C][C]0.4125[/C][C]-0.0539[/C][C]-0.9964[/C][/ROW]
[ROW][C](p-val)[/C][C](0.02 )[/C][C](0.2517 )[/C][C](0.0071 )[/C][C](0.0231 )[/C][C](0.228 )[/C][C](0.8321 )[/C][C](0.3842 )[/C][/ROW]
[ROW][C]Estimates ( 2 )[/C][C]-0.6159[/C][C]-0.1852[/C][C]-0.4193[/C][C]0.5912[/C][C]0.4306[/C][C]0[/C][C]-0.9992[/C][/ROW]
[ROW][C](p-val)[/C][C](0.0184 )[/C][C](0.2559 )[/C][C](0.0069 )[/C][C](0.0221 )[/C][C](0.1805 )[/C][C](NA )[/C][C](0.1619 )[/C][/ROW]
[ROW][C]Estimates ( 3 )[/C][C]-0.5488[/C][C]0[/C][C]-0.3471[/C][C]0.6118[/C][C]0.392[/C][C]0[/C][C]-1.0022[/C][/ROW]
[ROW][C](p-val)[/C][C](0.016 )[/C][C](NA )[/C][C](0.0216 )[/C][C](0.0144 )[/C][C](0.2286 )[/C][C](NA )[/C][C](0.5341 )[/C][/ROW]
[ROW][C]Estimates ( 4 )[/C][C]-0.4766[/C][C]0[/C][C]-0.3262[/C][C]0.5413[/C][C]-0.2543[/C][C]0[/C][C]0[/C][/ROW]
[ROW][C](p-val)[/C][C](0.0439 )[/C][C](NA )[/C][C](0.0262 )[/C][C](0.0366 )[/C][C](0.1815 )[/C][C](NA )[/C][C](NA )[/C][/ROW]
[ROW][C]Estimates ( 5 )[/C][C]-0.4671[/C][C]0[/C][C]-0.2852[/C][C]0.55[/C][C]0[/C][C]0[/C][C]0[/C][/ROW]
[ROW][C](p-val)[/C][C](0.0548 )[/C][C](NA )[/C][C](0.0448 )[/C][C](0.0357 )[/C][C](NA )[/C][C](NA )[/C][C](NA )[/C][/ROW]
[ROW][C]Estimates ( 6 )[/C][C]0[/C][C]0[/C][C]-0.2443[/C][C]-5e-04[/C][C]0[/C][C]0[/C][C]0[/C][/ROW]
[ROW][C](p-val)[/C][C](NA )[/C][C](NA )[/C][C](0.122 )[/C][C](0.9981 )[/C][C](NA )[/C][C](NA )[/C][C](NA )[/C][/ROW]
[ROW][C]Estimates ( 7 )[/C][C]0[/C][C]0[/C][C]-0.2442[/C][C]0[/C][C]0[/C][C]0[/C][C]0[/C][/ROW]
[ROW][C](p-val)[/C][C](NA )[/C][C](NA )[/C][C](0.1203 )[/C][C](NA )[/C][C](NA )[/C][C](NA )[/C][C](NA )[/C][/ROW]
[ROW][C]Estimates ( 8 )[/C][C]0[/C][C]0[/C][C]0[/C][C]0[/C][C]0[/C][C]0[/C][C]0[/C][/ROW]
[ROW][C](p-val)[/C][C](NA )[/C][C](NA )[/C][C](NA )[/C][C](NA )[/C][C](NA )[/C][C](NA )[/C][C](NA )[/C][/ROW]
[ROW][C]Estimates ( 9 )[/C][C]NA[/C][C]NA[/C][C]NA[/C][C]NA[/C][C]NA[/C][C]NA[/C][C]NA[/C][/ROW]
[ROW][C](p-val)[/C][C](NA )[/C][C](NA )[/C][C](NA )[/C][C](NA )[/C][C](NA )[/C][C](NA )[/C][C](NA )[/C][/ROW]
[ROW][C]Estimates ( 10 )[/C][C]NA[/C][C]NA[/C][C]NA[/C][C]NA[/C][C]NA[/C][C]NA[/C][C]NA[/C][/ROW]
[ROW][C](p-val)[/C][C](NA )[/C][C](NA )[/C][C](NA )[/C][C](NA )[/C][C](NA )[/C][C](NA )[/C][C](NA )[/C][/ROW]
[ROW][C]Estimates ( 11 )[/C][C]NA[/C][C]NA[/C][C]NA[/C][C]NA[/C][C]NA[/C][C]NA[/C][C]NA[/C][/ROW]
[ROW][C](p-val)[/C][C](NA )[/C][C](NA )[/C][C](NA )[/C][C](NA )[/C][C](NA )[/C][C](NA )[/C][C](NA )[/C][/ROW]
[ROW][C]Estimates ( 12 )[/C][C]NA[/C][C]NA[/C][C]NA[/C][C]NA[/C][C]NA[/C][C]NA[/C][C]NA[/C][/ROW]
[ROW][C](p-val)[/C][C](NA )[/C][C](NA )[/C][C](NA )[/C][C](NA )[/C][C](NA )[/C][C](NA )[/C][C](NA )[/C][/ROW]
[ROW][C]Estimates ( 13 )[/C][C]NA[/C][C]NA[/C][C]NA[/C][C]NA[/C][C]NA[/C][C]NA[/C][C]NA[/C][/ROW]
[ROW][C](p-val)[/C][C](NA )[/C][C](NA )[/C][C](NA )[/C][C](NA )[/C][C](NA )[/C][C](NA )[/C][C](NA )[/C][/ROW]
[/TABLE]
Source: https://freestatistics.org/blog/index.php?pk=62058&T=1

Globally Unique Identifier (entire table): ba.freestatistics.org/blog/index.php?pk=62058&T=1

As an alternative you can also use a QR Code:  

The GUIDs for individual cells are displayed in the table below:

ARIMA Parameter Estimation and Backward Selection
Iterationar1ar2ar3ma1sar1sar2sma1
Estimates ( 1 )-0.6263-0.1934-0.42290.59840.4125-0.0539-0.9964
(p-val)(0.02 )(0.2517 )(0.0071 )(0.0231 )(0.228 )(0.8321 )(0.3842 )
Estimates ( 2 )-0.6159-0.1852-0.41930.59120.43060-0.9992
(p-val)(0.0184 )(0.2559 )(0.0069 )(0.0221 )(0.1805 )(NA )(0.1619 )
Estimates ( 3 )-0.54880-0.34710.61180.3920-1.0022
(p-val)(0.016 )(NA )(0.0216 )(0.0144 )(0.2286 )(NA )(0.5341 )
Estimates ( 4 )-0.47660-0.32620.5413-0.254300
(p-val)(0.0439 )(NA )(0.0262 )(0.0366 )(0.1815 )(NA )(NA )
Estimates ( 5 )-0.46710-0.28520.55000
(p-val)(0.0548 )(NA )(0.0448 )(0.0357 )(NA )(NA )(NA )
Estimates ( 6 )00-0.2443-5e-04000
(p-val)(NA )(NA )(0.122 )(0.9981 )(NA )(NA )(NA )
Estimates ( 7 )00-0.24420000
(p-val)(NA )(NA )(0.1203 )(NA )(NA )(NA )(NA )
Estimates ( 8 )0000000
(p-val)(NA )(NA )(NA )(NA )(NA )(NA )(NA )
Estimates ( 9 )NANANANANANANA
(p-val)(NA )(NA )(NA )(NA )(NA )(NA )(NA )
Estimates ( 10 )NANANANANANANA
(p-val)(NA )(NA )(NA )(NA )(NA )(NA )(NA )
Estimates ( 11 )NANANANANANANA
(p-val)(NA )(NA )(NA )(NA )(NA )(NA )(NA )
Estimates ( 12 )NANANANANANANA
(p-val)(NA )(NA )(NA )(NA )(NA )(NA )(NA )
Estimates ( 13 )NANANANANANANA
(p-val)(NA )(NA )(NA )(NA )(NA )(NA )(NA )


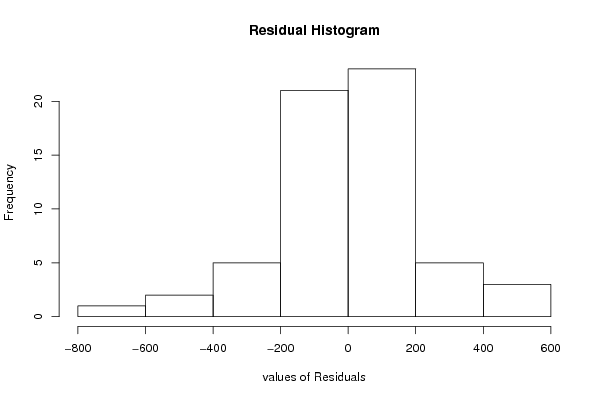
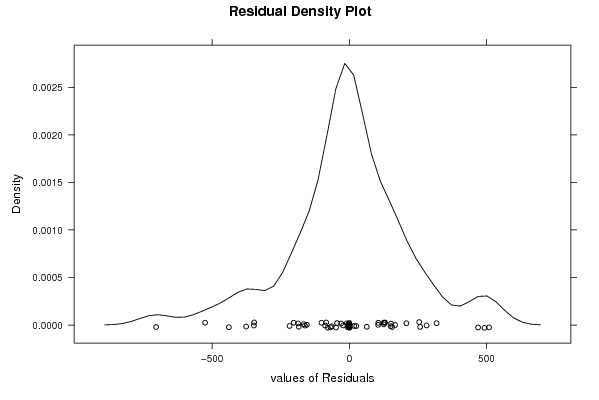
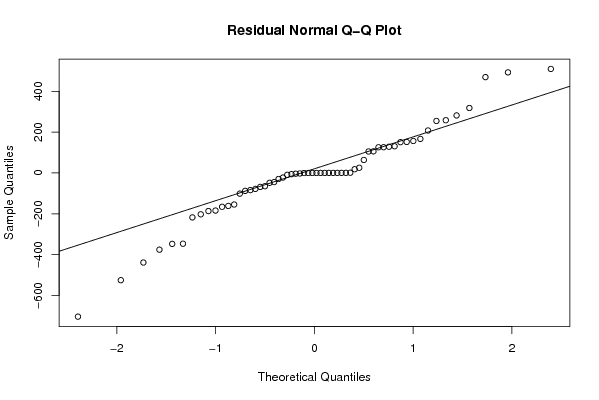
Estimated ARIMA Residuals
Value
-5.9238531028415
469.340715590764
-184.250796231223
-44.6121336820717
-375.797460485081
-2.40182332331833
125.765874347325
-186.644740787170
-48.2543145573899
-154.541843140443
166.881471861748
156.5910127496
126.086616873741
-101.307717492084
281.761641037565
-83.9941388409726
-217.656137961584
63.6128295256794
318.228264499018
-161.448062390307
-87.7788993848815
105.232822935259
-22.5737543937687
18.2644090508938
105.884402460472
-29.5346792618579
150.768804920947
-68.3337675746102
509.429176186266
-202.564962653663
-438.712471441201
-64.7381963967648
208.119830843391
-346.595571177845
25.3539565024798
-9.03744727570529
-703.833930140798
-347.416151142295
151.927710896249
254.722240772759
-78.1403449036379
128.517420914023
492.61869068575
130.686421353260
-165.752849296941
-525.265711774723
258.260175747030
-3.66916300542562

\begin{tabular}{lllllllll}
\hline
Estimated ARIMA Residuals \tabularnewline
Value \tabularnewline
-5.9238531028415 \tabularnewline
469.340715590764 \tabularnewline
-184.250796231223 \tabularnewline
-44.6121336820717 \tabularnewline
-375.797460485081 \tabularnewline
-2.40182332331833 \tabularnewline
125.765874347325 \tabularnewline
-186.644740787170 \tabularnewline
-48.2543145573899 \tabularnewline
-154.541843140443 \tabularnewline
166.881471861748 \tabularnewline
156.5910127496 \tabularnewline
126.086616873741 \tabularnewline
-101.307717492084 \tabularnewline
281.761641037565 \tabularnewline
-83.9941388409726 \tabularnewline
-217.656137961584 \tabularnewline
63.6128295256794 \tabularnewline
318.228264499018 \tabularnewline
-161.448062390307 \tabularnewline
-87.7788993848815 \tabularnewline
105.232822935259 \tabularnewline
-22.5737543937687 \tabularnewline
18.2644090508938 \tabularnewline
105.884402460472 \tabularnewline
-29.5346792618579 \tabularnewline
150.768804920947 \tabularnewline
-68.3337675746102 \tabularnewline
509.429176186266 \tabularnewline
-202.564962653663 \tabularnewline
-438.712471441201 \tabularnewline
-64.7381963967648 \tabularnewline
208.119830843391 \tabularnewline
-346.595571177845 \tabularnewline
25.3539565024798 \tabularnewline
-9.03744727570529 \tabularnewline
-703.833930140798 \tabularnewline
-347.416151142295 \tabularnewline
151.927710896249 \tabularnewline
254.722240772759 \tabularnewline
-78.1403449036379 \tabularnewline
128.517420914023 \tabularnewline
492.61869068575 \tabularnewline
130.686421353260 \tabularnewline
-165.752849296941 \tabularnewline
-525.265711774723 \tabularnewline
258.260175747030 \tabularnewline
-3.66916300542562 \tabularnewline
\hline
\end{tabular}
%Source: https://freestatistics.org/blog/index.php?pk=62058&T=2

[TABLE]
[ROW][C]Estimated ARIMA Residuals[/C][/ROW]
[ROW][C]Value[/C][/ROW]
[ROW][C]-5.9238531028415[/C][/ROW]
[ROW][C]469.340715590764[/C][/ROW]
[ROW][C]-184.250796231223[/C][/ROW]
[ROW][C]-44.6121336820717[/C][/ROW]
[ROW][C]-375.797460485081[/C][/ROW]
[ROW][C]-2.40182332331833[/C][/ROW]
[ROW][C]125.765874347325[/C][/ROW]
[ROW][C]-186.644740787170[/C][/ROW]
[ROW][C]-48.2543145573899[/C][/ROW]
[ROW][C]-154.541843140443[/C][/ROW]
[ROW][C]166.881471861748[/C][/ROW]
[ROW][C]156.5910127496[/C][/ROW]
[ROW][C]126.086616873741[/C][/ROW]
[ROW][C]-101.307717492084[/C][/ROW]
[ROW][C]281.761641037565[/C][/ROW]
[ROW][C]-83.9941388409726[/C][/ROW]
[ROW][C]-217.656137961584[/C][/ROW]
[ROW][C]63.6128295256794[/C][/ROW]
[ROW][C]318.228264499018[/C][/ROW]
[ROW][C]-161.448062390307[/C][/ROW]
[ROW][C]-87.7788993848815[/C][/ROW]
[ROW][C]105.232822935259[/C][/ROW]
[ROW][C]-22.5737543937687[/C][/ROW]
[ROW][C]18.2644090508938[/C][/ROW]
[ROW][C]105.884402460472[/C][/ROW]
[ROW][C]-29.5346792618579[/C][/ROW]
[ROW][C]150.768804920947[/C][/ROW]
[ROW][C]-68.3337675746102[/C][/ROW]
[ROW][C]509.429176186266[/C][/ROW]
[ROW][C]-202.564962653663[/C][/ROW]
[ROW][C]-438.712471441201[/C][/ROW]
[ROW][C]-64.7381963967648[/C][/ROW]
[ROW][C]208.119830843391[/C][/ROW]
[ROW][C]-346.595571177845[/C][/ROW]
[ROW][C]25.3539565024798[/C][/ROW]
[ROW][C]-9.03744727570529[/C][/ROW]
[ROW][C]-703.833930140798[/C][/ROW]
[ROW][C]-347.416151142295[/C][/ROW]
[ROW][C]151.927710896249[/C][/ROW]
[ROW][C]254.722240772759[/C][/ROW]
[ROW][C]-78.1403449036379[/C][/ROW]
[ROW][C]128.517420914023[/C][/ROW]
[ROW][C]492.61869068575[/C][/ROW]
[ROW][C]130.686421353260[/C][/ROW]
[ROW][C]-165.752849296941[/C][/ROW]
[ROW][C]-525.265711774723[/C][/ROW]
[ROW][C]258.260175747030[/C][/ROW]
[ROW][C]-3.66916300542562[/C][/ROW]
[/TABLE]
Source: https://freestatistics.org/blog/index.php?pk=62058&T=2

Globally Unique Identifier (entire table): ba.freestatistics.org/blog/index.php?pk=62058&T=2

As an alternative you can also use a QR Code:  

The GUIDs for individual cells are displayed in the table below:

Estimated ARIMA Residuals
Value
-5.9238531028415
469.340715590764
-184.250796231223
-44.6121336820717
-375.797460485081
-2.40182332331833
125.765874347325
-186.644740787170
-48.2543145573899
-154.541843140443
166.881471861748
156.5910127496
126.086616873741
-101.307717492084
281.761641037565
-83.9941388409726
-217.656137961584
63.6128295256794
318.228264499018
-161.448062390307
-87.7788993848815
105.232822935259
-22.5737543937687
18.2644090508938
105.884402460472
-29.5346792618579
150.768804920947
-68.3337675746102
509.429176186266
-202.564962653663
-438.712471441201
-64.7381963967648
208.119830843391
-346.595571177845
25.3539565024798
-9.03744727570529
-703.833930140798
-347.416151142295
151.927710896249
254.722240772759
-78.1403449036379
128.517420914023
492.61869068575
130.686421353260
-165.752849296941
-525.265711774723
258.260175747030
-3.66916300542562


Parameters (Session):
par1 = FALSE ; par2 = 1.0 ; par3 = 1 ; par4 = 1 ; par5 = 12 ; par6 = 3 ; par7 = 1 ; par8 = 2 ; par9 = 1 ;
Parameters (R input):
par1 = FALSE ; par2 = 1.0 ; par3 = 1 ; par4 = 1 ; par5 = 12 ; par6 = 3 ; par7 = 1 ; par8 = 2 ; par9 = 1 ;
R code (references can be found in the software module):
library(lattice)
if (par1 == 'TRUE') par1 <- TRUE
if (par1 == 'FALSE') par1 <- FALSE
par2 <- as.numeric(par2) #Box-Cox lambda transformation parameter
par3 <- as.numeric(par3) #degree of non-seasonal differencing
par4 <- as.numeric(par4) #degree of seasonal differencing
par5 <- as.numeric(par5) #seasonal period
par6 <- as.numeric(par6) #degree (p) of the non-seasonal AR(p) polynomial
par7 <- as.numeric(par7) #degree (q) of the non-seasonal MA(q) polynomial
par8 <- as.numeric(par8) #degree (P) of the seasonal AR(P) polynomial
par9 <- as.numeric(par9) #degree (Q) of the seasonal MA(Q) polynomial
armaGR <- function(arima.out, names, n){
try1 <- arima.out$coef
try2 <- sqrt(diag(arima.out$var.coef))
try.data.frame <- data.frame(matrix(NA,ncol=4,nrow=length(names)))
dimnames(try.data.frame) <- list(names,c('coef','std','tstat','pv'))
try.data.frame[,1] <- try1
for(i in 1:length(try2)) try.data.frame[which(rownames(try.data.frame)==names(try2)[i]),2] <- try2[i]
try.data.frame[,3] <- try.data.frame[,1] / try.data.frame[,2]
try.data.frame[,4] <- round((1-pt(abs(try.data.frame[,3]),df=n-(length(try2)+1)))*2,5)
vector <- rep(NA,length(names))
vector[is.na(try.data.frame[,4])] <- 0
maxi <- which.max(try.data.frame[,4])
continue <- max(try.data.frame[,4],na.rm=TRUE) > .05
vector[maxi] <- 0
list(summary=try.data.frame,next.vector=vector,continue=continue)
}
arimaSelect <- function(series, order=c(13,0,0), seasonal=list(order=c(2,0,0),period=12), include.mean=F){
nrc <- order[1]+order[3]+seasonal$order[1]+seasonal$order[3]
coeff <- matrix(NA, nrow=nrc*2, ncol=nrc)
pval <- matrix(NA, nrow=nrc*2, ncol=nrc)
mylist <- rep(list(NULL), nrc)
names <- NULL
if(order[1] > 0) names <- paste('ar',1:order[1],sep='')
if(order[3] > 0) names <- c( names , paste('ma',1:order[3],sep='') )
if(seasonal$order[1] > 0) names <- c(names, paste('sar',1:seasonal$order[1],sep=''))
if(seasonal$order[3] > 0) names <- c(names, paste('sma',1:seasonal$order[3],sep=''))
arima.out <- arima(series, order=order, seasonal=seasonal, include.mean=include.mean, method='ML')
mylist[[1]] <- arima.out
last.arma <- armaGR(arima.out, names, length(series))
mystop <- FALSE
i <- 1
coeff[i,] <- last.arma[[1]][,1]
pval [i,] <- last.arma[[1]][,4]
i <- 2
aic <- arima.out$aic
while(!mystop){
mylist[[i]] <- arima.out
arima.out <- arima(series, order=order, seasonal=seasonal, include.mean=include.mean, method='ML', fixed=last.arma$next.vector)
aic <- c(aic, arima.out$aic)
last.arma <- armaGR(arima.out, names, length(series))
mystop <- !last.arma$continue
coeff[i,] <- last.arma[[1]][,1]
pval [i,] <- last.arma[[1]][,4]
i <- i+1
}
list(coeff, pval, mylist, aic=aic)
}
arimaSelectplot <- function(arimaSelect.out,noms,choix){
noms <- names(arimaSelect.out[[3]][[1]]$coef)
coeff <- arimaSelect.out[[1]]
k <- min(which(is.na(coeff[,1])))-1
coeff <- coeff[1:k,]
pval <- arimaSelect.out[[2]][1:k,]
aic <- arimaSelect.out$aic[1:k]
coeff[coeff==0] <- NA
n <- ncol(coeff)
if(missing(choix)) choix <- k
layout(matrix(c(1,1,1,2,
3,3,3,2,
3,3,3,4,
5,6,7,7),nr=4),
widths=c(10,35,45,15),
heights=c(30,30,15,15))
couleurs <- rainbow(75)[1:50]#(50)
ticks <- pretty(coeff)
par(mar=c(1,1,3,1))
plot(aic,k:1-.5,type='o',pch=21,bg='blue',cex=2,axes=F,lty=2,xpd=NA)
points(aic[choix],k-choix+.5,pch=21,cex=4,bg=2,xpd=NA)
title('aic',line=2)
par(mar=c(3,0,0,0))
plot(0,axes=F,xlab='',ylab='',xlim=range(ticks),ylim=c(.1,1))
rect(xleft = min(ticks) + (0:49)/50*(max(ticks)-min(ticks)),
xright = min(ticks) + (1:50)/50*(max(ticks)-min(ticks)),
ytop = rep(1,50),
ybottom= rep(0,50),col=couleurs,border=NA)
axis(1,ticks)
rect(xleft=min(ticks),xright=max(ticks),ytop=1,ybottom=0)
text(mean(coeff,na.rm=T),.5,'coefficients',cex=2,font=2)
par(mar=c(1,1,3,1))
image(1:n,1:k,t(coeff[k:1,]),axes=F,col=couleurs,zlim=range(ticks))
for(i in 1:n) for(j in 1:k) if(!is.na(coeff[j,i])) {
if(pval[j,i]<.01) symb = 'green'
else if( (pval[j,i]<.05) & (pval[j,i]>=.01)) symb = 'orange'
else if( (pval[j,i]<.1) & (pval[j,i]>=.05)) symb = 'red'
else symb = 'black'
polygon(c(i+.5 ,i+.2 ,i+.5 ,i+.5),
c(k-j+0.5,k-j+0.5,k-j+0.8,k-j+0.5),
col=symb)
if(j==choix) {
rect(xleft=i-.5,
xright=i+.5,
ybottom=k-j+1.5,
ytop=k-j+.5,
lwd=4)
text(i,
k-j+1,
round(coeff[j,i],2),
cex=1.2,
font=2)
}
else{
rect(xleft=i-.5,xright=i+.5,ybottom=k-j+1.5,ytop=k-j+.5)
text(i,k-j+1,round(coeff[j,i],2),cex=1.2,font=1)
}
}
axis(3,1:n,noms)
par(mar=c(0.5,0,0,0.5))
plot(0,axes=F,xlab='',ylab='',type='n',xlim=c(0,8),ylim=c(-.2,.8))
cols <- c('green','orange','red','black')
niv <- c('0','0.01','0.05','0.1')
for(i in 0:3){
polygon(c(1+2*i ,1+2*i ,1+2*i-.5 ,1+2*i),
c(.4 ,.7 , .4 , .4),
col=cols[i+1])
text(2*i,0.5,niv[i+1],cex=1.5)
}
text(8,.5,1,cex=1.5)
text(4,0,'p-value',cex=2)
box()
residus <- arimaSelect.out[[3]][[choix]]$res
par(mar=c(1,2,4,1))
acf(residus,main='')
title('acf',line=.5)
par(mar=c(1,2,4,1))
pacf(residus,main='')
title('pacf',line=.5)
par(mar=c(2,2,4,1))
qqnorm(residus,main='')
title('qq-norm',line=.5)
qqline(residus)
residus
}
if (par2 == 0) x <- log(x)
if (par2 != 0) x <- x^par2
(selection <- arimaSelect(x, order=c(par6,par3,par7), seasonal=list(order=c(par8,par4,par9), period=par5)))
bitmap(file='test1.png')
resid <- arimaSelectplot(selection)
dev.off()
resid
bitmap(file='test2.png')
acf(resid,length(resid)/2, main='Residual Autocorrelation Function')
dev.off()
bitmap(file='test3.png')
pacf(resid,length(resid)/2, main='Residual Partial Autocorrelation Function')
dev.off()
bitmap(file='test4.png')
cpgram(resid, main='Residual Cumulative Periodogram')
dev.off()
bitmap(file='test5.png')
hist(resid, main='Residual Histogram', xlab='values of Residuals')
dev.off()
bitmap(file='test6.png')
densityplot(~resid,col='black',main='Residual Density Plot', xlab='values of Residuals')
dev.off()
bitmap(file='test7.png')
qqnorm(resid, main='Residual Normal Q-Q Plot')
qqline(resid)
dev.off()
ncols <- length(selection[[1]][1,])
nrows <- length(selection[[2]][,1])-1
load(file='createtable')
a<-table.start()
a<-table.row.start(a)
a<-table.element(a,'ARIMA Parameter Estimation and Backward Selection', ncols+1,TRUE)
a<-table.row.end(a)
a<-table.row.start(a)
a<-table.element(a,'Iteration', header=TRUE)
for (i in 1:ncols) {
a<-table.element(a,names(selection[[3]][[1]]$coef)[i],header=TRUE)
}
a<-table.row.end(a)
for (j in 1:nrows) {
a<-table.row.start(a)
mydum <- 'Estimates ('
mydum <- paste(mydum,j)
mydum <- paste(mydum,')')
a<-table.element(a,mydum, header=TRUE)
for (i in 1:ncols) {
a<-table.element(a,round(selection[[1]][j,i],4))
}
a<-table.row.end(a)
a<-table.row.start(a)
a<-table.element(a,'(p-val)', header=TRUE)
for (i in 1:ncols) {
mydum <- '('
mydum <- paste(mydum,round(selection[[2]][j,i],4),sep='')
mydum <- paste(mydum,')')
a<-table.element(a,mydum)
}
a<-table.row.end(a)
}
a<-table.end(a)
table.save(a,file='mytable.tab')
a<-table.start()
a<-table.row.start(a)
a<-table.element(a,'Estimated ARIMA Residuals', 1,TRUE)
a<-table.row.end(a)
a<-table.row.start(a)
a<-table.element(a,'Value', 1,TRUE)
a<-table.row.end(a)
for (i in (par4*par5+par3):length(resid)) {
a<-table.row.start(a)
a<-table.element(a,resid[i])
a<-table.row.end(a)
}
a<-table.end(a)
table.save(a,file='mytable1.tab')