Free Statistics

of Irreproducible Research!

Author's title

Author*The author of this computation has been verified*
R Software Modulerwasp_autocorrelation.wasp
Title produced by software(Partial) Autocorrelation Function
Date of computationTue, 01 Dec 2009 05:41:59 -0700
Cite this page as followsStatistical Computations at FreeStatistics.org, Office for Research Development and Education, URL https://freestatistics.org/blog/index.php?v=date/2009/Dec/01/t1259671362aialomxj3138cbo.htm/, Retrieved Fri, 19 Apr 2024 08:34:53 +0000
Statistical Computations at FreeStatistics.org, Office for Research Development and Education, URL https://freestatistics.org/blog/index.php?pk=62012, Retrieved Fri, 19 Apr 2024 08:34:53 +0000
QR Codes:

Original text written by user:
IsPrivate?No (this computation is public)
User-defined keywords
Estimated Impact154
Family? (F = Feedback message, R = changed R code, M = changed R Module, P = changed Parameters, D = changed Data)
-     [Univariate Data Series] [data set] [2008-12-01 19:54:57] [b98453cac15ba1066b407e146608df68]
- RMP   [(Partial) Autocorrelation Function] [] [2009-11-27 14:47:30] [b98453cac15ba1066b407e146608df68]
-    D      [(Partial) Autocorrelation Function] [] [2009-12-01 12:41:59] [c60887983b0820a525cba943a935572d] [Current]
Feedback Forum

Post a new message
Dataseries X:
149
139
135
130
127
122
117
112
113
149
157
157
147
137
132
125
123
117
114
111
112
144
150
149
134
123
116
117
111
105
102
95
93
124
130
124
115
106
105
105
101
95
93
84
87
116
120
117
109
105
107
109
109
108
107
99
103
131
137
135


Summary of computational transaction
Raw Inputview raw input (R code)
Raw Outputview raw output of R engine
Computing time2 seconds
R Server'Gwilym Jenkins' @ 72.249.127.135

\begin{tabular}{lllllllll}
\hline
Summary of computational transaction \tabularnewline
Raw Input & view raw input (R code)  \tabularnewline
Raw Output & view raw output of R engine  \tabularnewline
Computing time & 2 seconds \tabularnewline
R Server & 'Gwilym Jenkins' @ 72.249.127.135 \tabularnewline
\hline
\end{tabular}
%Source: https://freestatistics.org/blog/index.php?pk=62012&T=0

[TABLE]
[ROW][C]Summary of computational transaction[/C][/ROW]
[ROW][C]Raw Input[/C][C]view raw input (R code) [/C][/ROW]
[ROW][C]Raw Output[/C][C]view raw output of R engine [/C][/ROW]
[ROW][C]Computing time[/C][C]2 seconds[/C][/ROW]
[ROW][C]R Server[/C][C]'Gwilym Jenkins' @ 72.249.127.135[/C][/ROW]
[/TABLE]
Source: https://freestatistics.org/blog/index.php?pk=62012&T=0

Globally Unique Identifier (entire table): ba.freestatistics.org/blog/index.php?pk=62012&T=0

As an alternative you can also use a QR Code:  

The GUIDs for individual cells are displayed in the table below:

Summary of computational transaction
Raw Inputview raw input (R code)
Raw Outputview raw output of R engine
Computing time2 seconds
R Server'Gwilym Jenkins' @ 72.249.127.135


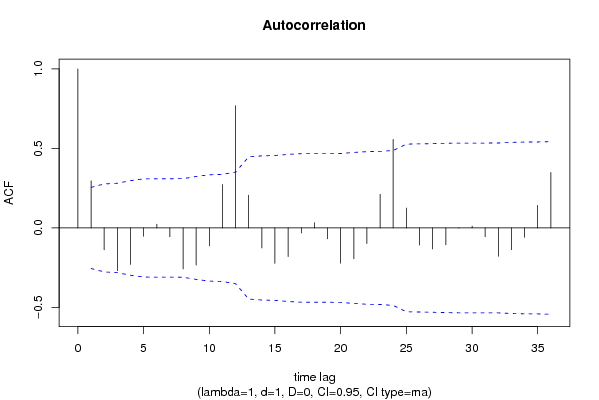
Autocorrelation Function
Time lag kACF(k)T-STATP-value
10.296852.28010.013114
2-0.137592-1.05690.147441
3-0.26914-2.06730.02155
4-0.229534-1.76310.041532
5-0.0517-0.39710.346357
60.023630.18150.428296
7-0.055019-0.42260.337058
8-0.257935-1.98120.026116
9-0.23335-1.79240.039098
10-0.112675-0.86550.195142
110.2724822.0930.02033
120.7687375.90480
130.2063351.58490.059169
14-0.125745-0.96590.169026
15-0.222825-1.71160.046116
16-0.179939-1.38210.08607
17-0.031698-0.24350.40424
180.0331630.25470.39991
19-0.068634-0.52720.30002
20-0.221472-1.70120.047089
21-0.193993-1.49010.070764
22-0.098481-0.75640.226195
230.2114631.62430.054824
240.5566344.27563.5e-05
250.1252490.96210.169975
26-0.107557-0.82620.206021
27-0.1321-1.01470.157201
28-0.105889-0.81330.209645
29-0.00184-0.01410.494385
300.0111830.08590.465919
31-0.054996-0.42240.337123
32-0.177696-1.36490.088732
33-0.13695-1.05190.148559
34-0.058965-0.45290.326135
350.1419661.09050.139972
360.3492552.68270.00473

\begin{tabular}{lllllllll}
\hline
Autocorrelation Function \tabularnewline
Time lag k & ACF(k) & T-STAT & P-value \tabularnewline
1 & 0.29685 & 2.2801 & 0.013114 \tabularnewline
2 & -0.137592 & -1.0569 & 0.147441 \tabularnewline
3 & -0.26914 & -2.0673 & 0.02155 \tabularnewline
4 & -0.229534 & -1.7631 & 0.041532 \tabularnewline
5 & -0.0517 & -0.3971 & 0.346357 \tabularnewline
6 & 0.02363 & 0.1815 & 0.428296 \tabularnewline
7 & -0.055019 & -0.4226 & 0.337058 \tabularnewline
8 & -0.257935 & -1.9812 & 0.026116 \tabularnewline
9 & -0.23335 & -1.7924 & 0.039098 \tabularnewline
10 & -0.112675 & -0.8655 & 0.195142 \tabularnewline
11 & 0.272482 & 2.093 & 0.02033 \tabularnewline
12 & 0.768737 & 5.9048 & 0 \tabularnewline
13 & 0.206335 & 1.5849 & 0.059169 \tabularnewline
14 & -0.125745 & -0.9659 & 0.169026 \tabularnewline
15 & -0.222825 & -1.7116 & 0.046116 \tabularnewline
16 & -0.179939 & -1.3821 & 0.08607 \tabularnewline
17 & -0.031698 & -0.2435 & 0.40424 \tabularnewline
18 & 0.033163 & 0.2547 & 0.39991 \tabularnewline
19 & -0.068634 & -0.5272 & 0.30002 \tabularnewline
20 & -0.221472 & -1.7012 & 0.047089 \tabularnewline
21 & -0.193993 & -1.4901 & 0.070764 \tabularnewline
22 & -0.098481 & -0.7564 & 0.226195 \tabularnewline
23 & 0.211463 & 1.6243 & 0.054824 \tabularnewline
24 & 0.556634 & 4.2756 & 3.5e-05 \tabularnewline
25 & 0.125249 & 0.9621 & 0.169975 \tabularnewline
26 & -0.107557 & -0.8262 & 0.206021 \tabularnewline
27 & -0.1321 & -1.0147 & 0.157201 \tabularnewline
28 & -0.105889 & -0.8133 & 0.209645 \tabularnewline
29 & -0.00184 & -0.0141 & 0.494385 \tabularnewline
30 & 0.011183 & 0.0859 & 0.465919 \tabularnewline
31 & -0.054996 & -0.4224 & 0.337123 \tabularnewline
32 & -0.177696 & -1.3649 & 0.088732 \tabularnewline
33 & -0.13695 & -1.0519 & 0.148559 \tabularnewline
34 & -0.058965 & -0.4529 & 0.326135 \tabularnewline
35 & 0.141966 & 1.0905 & 0.139972 \tabularnewline
36 & 0.349255 & 2.6827 & 0.00473 \tabularnewline
\hline
\end{tabular}
%Source: https://freestatistics.org/blog/index.php?pk=62012&T=1

[TABLE]
[ROW][C]Autocorrelation Function[/C][/ROW]
[ROW][C]Time lag k[/C][C]ACF(k)[/C][C]T-STAT[/C][C]P-value[/C][/ROW]
[ROW][C]1[/C][C]0.29685[/C][C]2.2801[/C][C]0.013114[/C][/ROW]
[ROW][C]2[/C][C]-0.137592[/C][C]-1.0569[/C][C]0.147441[/C][/ROW]
[ROW][C]3[/C][C]-0.26914[/C][C]-2.0673[/C][C]0.02155[/C][/ROW]
[ROW][C]4[/C][C]-0.229534[/C][C]-1.7631[/C][C]0.041532[/C][/ROW]
[ROW][C]5[/C][C]-0.0517[/C][C]-0.3971[/C][C]0.346357[/C][/ROW]
[ROW][C]6[/C][C]0.02363[/C][C]0.1815[/C][C]0.428296[/C][/ROW]
[ROW][C]7[/C][C]-0.055019[/C][C]-0.4226[/C][C]0.337058[/C][/ROW]
[ROW][C]8[/C][C]-0.257935[/C][C]-1.9812[/C][C]0.026116[/C][/ROW]
[ROW][C]9[/C][C]-0.23335[/C][C]-1.7924[/C][C]0.039098[/C][/ROW]
[ROW][C]10[/C][C]-0.112675[/C][C]-0.8655[/C][C]0.195142[/C][/ROW]
[ROW][C]11[/C][C]0.272482[/C][C]2.093[/C][C]0.02033[/C][/ROW]
[ROW][C]12[/C][C]0.768737[/C][C]5.9048[/C][C]0[/C][/ROW]
[ROW][C]13[/C][C]0.206335[/C][C]1.5849[/C][C]0.059169[/C][/ROW]
[ROW][C]14[/C][C]-0.125745[/C][C]-0.9659[/C][C]0.169026[/C][/ROW]
[ROW][C]15[/C][C]-0.222825[/C][C]-1.7116[/C][C]0.046116[/C][/ROW]
[ROW][C]16[/C][C]-0.179939[/C][C]-1.3821[/C][C]0.08607[/C][/ROW]
[ROW][C]17[/C][C]-0.031698[/C][C]-0.2435[/C][C]0.40424[/C][/ROW]
[ROW][C]18[/C][C]0.033163[/C][C]0.2547[/C][C]0.39991[/C][/ROW]
[ROW][C]19[/C][C]-0.068634[/C][C]-0.5272[/C][C]0.30002[/C][/ROW]
[ROW][C]20[/C][C]-0.221472[/C][C]-1.7012[/C][C]0.047089[/C][/ROW]
[ROW][C]21[/C][C]-0.193993[/C][C]-1.4901[/C][C]0.070764[/C][/ROW]
[ROW][C]22[/C][C]-0.098481[/C][C]-0.7564[/C][C]0.226195[/C][/ROW]
[ROW][C]23[/C][C]0.211463[/C][C]1.6243[/C][C]0.054824[/C][/ROW]
[ROW][C]24[/C][C]0.556634[/C][C]4.2756[/C][C]3.5e-05[/C][/ROW]
[ROW][C]25[/C][C]0.125249[/C][C]0.9621[/C][C]0.169975[/C][/ROW]
[ROW][C]26[/C][C]-0.107557[/C][C]-0.8262[/C][C]0.206021[/C][/ROW]
[ROW][C]27[/C][C]-0.1321[/C][C]-1.0147[/C][C]0.157201[/C][/ROW]
[ROW][C]28[/C][C]-0.105889[/C][C]-0.8133[/C][C]0.209645[/C][/ROW]
[ROW][C]29[/C][C]-0.00184[/C][C]-0.0141[/C][C]0.494385[/C][/ROW]
[ROW][C]30[/C][C]0.011183[/C][C]0.0859[/C][C]0.465919[/C][/ROW]
[ROW][C]31[/C][C]-0.054996[/C][C]-0.4224[/C][C]0.337123[/C][/ROW]
[ROW][C]32[/C][C]-0.177696[/C][C]-1.3649[/C][C]0.088732[/C][/ROW]
[ROW][C]33[/C][C]-0.13695[/C][C]-1.0519[/C][C]0.148559[/C][/ROW]
[ROW][C]34[/C][C]-0.058965[/C][C]-0.4529[/C][C]0.326135[/C][/ROW]
[ROW][C]35[/C][C]0.141966[/C][C]1.0905[/C][C]0.139972[/C][/ROW]
[ROW][C]36[/C][C]0.349255[/C][C]2.6827[/C][C]0.00473[/C][/ROW]
[/TABLE]
Source: https://freestatistics.org/blog/index.php?pk=62012&T=1

Globally Unique Identifier (entire table): ba.freestatistics.org/blog/index.php?pk=62012&T=1

As an alternative you can also use a QR Code:  

The GUIDs for individual cells are displayed in the table below:

Autocorrelation Function
Time lag kACF(k)T-STATP-value
10.296852.28010.013114
2-0.137592-1.05690.147441
3-0.26914-2.06730.02155
4-0.229534-1.76310.041532
5-0.0517-0.39710.346357
60.023630.18150.428296
7-0.055019-0.42260.337058
8-0.257935-1.98120.026116
9-0.23335-1.79240.039098
10-0.112675-0.86550.195142
110.2724822.0930.02033
120.7687375.90480
130.2063351.58490.059169
14-0.125745-0.96590.169026
15-0.222825-1.71160.046116
16-0.179939-1.38210.08607
17-0.031698-0.24350.40424
180.0331630.25470.39991
19-0.068634-0.52720.30002
20-0.221472-1.70120.047089
21-0.193993-1.49010.070764
22-0.098481-0.75640.226195
230.2114631.62430.054824
240.5566344.27563.5e-05
250.1252490.96210.169975
26-0.107557-0.82620.206021
27-0.1321-1.01470.157201
28-0.105889-0.81330.209645
29-0.00184-0.01410.494385
300.0111830.08590.465919
31-0.054996-0.42240.337123
32-0.177696-1.36490.088732
33-0.13695-1.05190.148559
34-0.058965-0.45290.326135
350.1419661.09050.139972
360.3492552.68270.00473


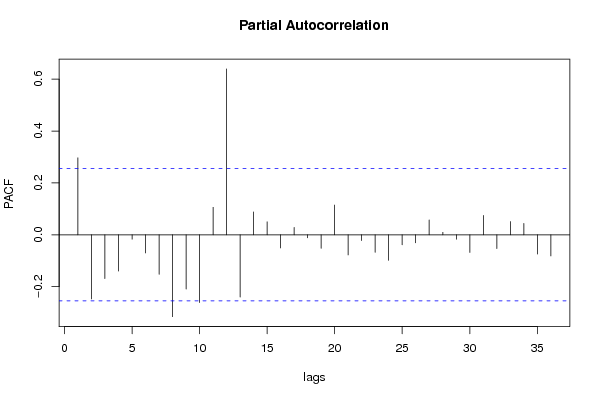
Partial Autocorrelation Function
Time lag kPACF(k)T-STATP-value
10.296852.28010.013114
2-0.247524-1.90130.031077
3-0.16905-1.29850.099584
4-0.139964-1.07510.143357
5-0.016994-0.13050.448295
6-0.070168-0.5390.295967
7-0.15244-1.17090.12317
8-0.315686-2.42480.009198
9-0.20941-1.60850.056532
10-0.261585-2.00930.024545
110.1057270.81210.209998
120.6393014.91064e-06
13-0.240187-1.84490.035036
140.0881860.67740.25041
150.0499060.38330.351425
16-0.050583-0.38850.34951
170.0283150.21750.414287
18-0.011896-0.09140.463752
19-0.052082-0.40010.345281
200.114640.88060.191062
21-0.077917-0.59850.275901
22-0.022312-0.17140.432254
23-0.067606-0.51930.30275
24-0.098598-0.75730.225929
25-0.03852-0.29590.38418
26-0.031222-0.23980.405652
270.057150.4390.331141
280.0096720.07430.470516
29-0.016892-0.12970.448604
30-0.068261-0.52430.301009
310.0747140.57390.284113
32-0.053395-0.41010.341597
330.0511090.39260.348024
340.0435070.33420.369713
35-0.074464-0.5720.284757
36-0.081627-0.6270.266541

\begin{tabular}{lllllllll}
\hline
Partial Autocorrelation Function \tabularnewline
Time lag k & PACF(k) & T-STAT & P-value \tabularnewline
1 & 0.29685 & 2.2801 & 0.013114 \tabularnewline
2 & -0.247524 & -1.9013 & 0.031077 \tabularnewline
3 & -0.16905 & -1.2985 & 0.099584 \tabularnewline
4 & -0.139964 & -1.0751 & 0.143357 \tabularnewline
5 & -0.016994 & -0.1305 & 0.448295 \tabularnewline
6 & -0.070168 & -0.539 & 0.295967 \tabularnewline
7 & -0.15244 & -1.1709 & 0.12317 \tabularnewline
8 & -0.315686 & -2.4248 & 0.009198 \tabularnewline
9 & -0.20941 & -1.6085 & 0.056532 \tabularnewline
10 & -0.261585 & -2.0093 & 0.024545 \tabularnewline
11 & 0.105727 & 0.8121 & 0.209998 \tabularnewline
12 & 0.639301 & 4.9106 & 4e-06 \tabularnewline
13 & -0.240187 & -1.8449 & 0.035036 \tabularnewline
14 & 0.088186 & 0.6774 & 0.25041 \tabularnewline
15 & 0.049906 & 0.3833 & 0.351425 \tabularnewline
16 & -0.050583 & -0.3885 & 0.34951 \tabularnewline
17 & 0.028315 & 0.2175 & 0.414287 \tabularnewline
18 & -0.011896 & -0.0914 & 0.463752 \tabularnewline
19 & -0.052082 & -0.4001 & 0.345281 \tabularnewline
20 & 0.11464 & 0.8806 & 0.191062 \tabularnewline
21 & -0.077917 & -0.5985 & 0.275901 \tabularnewline
22 & -0.022312 & -0.1714 & 0.432254 \tabularnewline
23 & -0.067606 & -0.5193 & 0.30275 \tabularnewline
24 & -0.098598 & -0.7573 & 0.225929 \tabularnewline
25 & -0.03852 & -0.2959 & 0.38418 \tabularnewline
26 & -0.031222 & -0.2398 & 0.405652 \tabularnewline
27 & 0.05715 & 0.439 & 0.331141 \tabularnewline
28 & 0.009672 & 0.0743 & 0.470516 \tabularnewline
29 & -0.016892 & -0.1297 & 0.448604 \tabularnewline
30 & -0.068261 & -0.5243 & 0.301009 \tabularnewline
31 & 0.074714 & 0.5739 & 0.284113 \tabularnewline
32 & -0.053395 & -0.4101 & 0.341597 \tabularnewline
33 & 0.051109 & 0.3926 & 0.348024 \tabularnewline
34 & 0.043507 & 0.3342 & 0.369713 \tabularnewline
35 & -0.074464 & -0.572 & 0.284757 \tabularnewline
36 & -0.081627 & -0.627 & 0.266541 \tabularnewline
\hline
\end{tabular}
%Source: https://freestatistics.org/blog/index.php?pk=62012&T=2

[TABLE]
[ROW][C]Partial Autocorrelation Function[/C][/ROW]
[ROW][C]Time lag k[/C][C]PACF(k)[/C][C]T-STAT[/C][C]P-value[/C][/ROW]
[ROW][C]1[/C][C]0.29685[/C][C]2.2801[/C][C]0.013114[/C][/ROW]
[ROW][C]2[/C][C]-0.247524[/C][C]-1.9013[/C][C]0.031077[/C][/ROW]
[ROW][C]3[/C][C]-0.16905[/C][C]-1.2985[/C][C]0.099584[/C][/ROW]
[ROW][C]4[/C][C]-0.139964[/C][C]-1.0751[/C][C]0.143357[/C][/ROW]
[ROW][C]5[/C][C]-0.016994[/C][C]-0.1305[/C][C]0.448295[/C][/ROW]
[ROW][C]6[/C][C]-0.070168[/C][C]-0.539[/C][C]0.295967[/C][/ROW]
[ROW][C]7[/C][C]-0.15244[/C][C]-1.1709[/C][C]0.12317[/C][/ROW]
[ROW][C]8[/C][C]-0.315686[/C][C]-2.4248[/C][C]0.009198[/C][/ROW]
[ROW][C]9[/C][C]-0.20941[/C][C]-1.6085[/C][C]0.056532[/C][/ROW]
[ROW][C]10[/C][C]-0.261585[/C][C]-2.0093[/C][C]0.024545[/C][/ROW]
[ROW][C]11[/C][C]0.105727[/C][C]0.8121[/C][C]0.209998[/C][/ROW]
[ROW][C]12[/C][C]0.639301[/C][C]4.9106[/C][C]4e-06[/C][/ROW]
[ROW][C]13[/C][C]-0.240187[/C][C]-1.8449[/C][C]0.035036[/C][/ROW]
[ROW][C]14[/C][C]0.088186[/C][C]0.6774[/C][C]0.25041[/C][/ROW]
[ROW][C]15[/C][C]0.049906[/C][C]0.3833[/C][C]0.351425[/C][/ROW]
[ROW][C]16[/C][C]-0.050583[/C][C]-0.3885[/C][C]0.34951[/C][/ROW]
[ROW][C]17[/C][C]0.028315[/C][C]0.2175[/C][C]0.414287[/C][/ROW]
[ROW][C]18[/C][C]-0.011896[/C][C]-0.0914[/C][C]0.463752[/C][/ROW]
[ROW][C]19[/C][C]-0.052082[/C][C]-0.4001[/C][C]0.345281[/C][/ROW]
[ROW][C]20[/C][C]0.11464[/C][C]0.8806[/C][C]0.191062[/C][/ROW]
[ROW][C]21[/C][C]-0.077917[/C][C]-0.5985[/C][C]0.275901[/C][/ROW]
[ROW][C]22[/C][C]-0.022312[/C][C]-0.1714[/C][C]0.432254[/C][/ROW]
[ROW][C]23[/C][C]-0.067606[/C][C]-0.5193[/C][C]0.30275[/C][/ROW]
[ROW][C]24[/C][C]-0.098598[/C][C]-0.7573[/C][C]0.225929[/C][/ROW]
[ROW][C]25[/C][C]-0.03852[/C][C]-0.2959[/C][C]0.38418[/C][/ROW]
[ROW][C]26[/C][C]-0.031222[/C][C]-0.2398[/C][C]0.405652[/C][/ROW]
[ROW][C]27[/C][C]0.05715[/C][C]0.439[/C][C]0.331141[/C][/ROW]
[ROW][C]28[/C][C]0.009672[/C][C]0.0743[/C][C]0.470516[/C][/ROW]
[ROW][C]29[/C][C]-0.016892[/C][C]-0.1297[/C][C]0.448604[/C][/ROW]
[ROW][C]30[/C][C]-0.068261[/C][C]-0.5243[/C][C]0.301009[/C][/ROW]
[ROW][C]31[/C][C]0.074714[/C][C]0.5739[/C][C]0.284113[/C][/ROW]
[ROW][C]32[/C][C]-0.053395[/C][C]-0.4101[/C][C]0.341597[/C][/ROW]
[ROW][C]33[/C][C]0.051109[/C][C]0.3926[/C][C]0.348024[/C][/ROW]
[ROW][C]34[/C][C]0.043507[/C][C]0.3342[/C][C]0.369713[/C][/ROW]
[ROW][C]35[/C][C]-0.074464[/C][C]-0.572[/C][C]0.284757[/C][/ROW]
[ROW][C]36[/C][C]-0.081627[/C][C]-0.627[/C][C]0.266541[/C][/ROW]
[/TABLE]
Source: https://freestatistics.org/blog/index.php?pk=62012&T=2

Globally Unique Identifier (entire table): ba.freestatistics.org/blog/index.php?pk=62012&T=2

As an alternative you can also use a QR Code:  

The GUIDs for individual cells are displayed in the table below:

Partial Autocorrelation Function
Time lag kPACF(k)T-STATP-value
10.296852.28010.013114
2-0.247524-1.90130.031077
3-0.16905-1.29850.099584
4-0.139964-1.07510.143357
5-0.016994-0.13050.448295
6-0.070168-0.5390.295967
7-0.15244-1.17090.12317
8-0.315686-2.42480.009198
9-0.20941-1.60850.056532
10-0.261585-2.00930.024545
110.1057270.81210.209998
120.6393014.91064e-06
13-0.240187-1.84490.035036
140.0881860.67740.25041
150.0499060.38330.351425
16-0.050583-0.38850.34951
170.0283150.21750.414287
18-0.011896-0.09140.463752
19-0.052082-0.40010.345281
200.114640.88060.191062
21-0.077917-0.59850.275901
22-0.022312-0.17140.432254
23-0.067606-0.51930.30275
24-0.098598-0.75730.225929
25-0.03852-0.29590.38418
26-0.031222-0.23980.405652
270.057150.4390.331141
280.0096720.07430.470516
29-0.016892-0.12970.448604
30-0.068261-0.52430.301009
310.0747140.57390.284113
32-0.053395-0.41010.341597
330.0511090.39260.348024
340.0435070.33420.369713
35-0.074464-0.5720.284757
36-0.081627-0.6270.266541


Parameters (Session):
par1 = 36 ; par2 = 1 ; par3 = 1 ; par4 = 0 ; par5 = 12 ; par6 = MA ; par7 = 0.95 ;
Parameters (R input):
par1 = 36 ; par2 = 1 ; par3 = 1 ; par4 = 0 ; par5 = 12 ; par6 = MA ; par7 = 0.95 ;
R code (references can be found in the software module):
if (par1 == 'Default') {
par1 = 10*log10(length(x))
} else {
par1 <- as.numeric(par1)
}
par2 <- as.numeric(par2)
par3 <- as.numeric(par3)
par4 <- as.numeric(par4)
par5 <- as.numeric(par5)
if (par6 == 'White Noise') par6 <- 'white' else par6 <- 'ma'
par7 <- as.numeric(par7)
if (par2 == 0) {
x <- log(x)
} else {
x <- (x ^ par2 - 1) / par2
}
if (par3 > 0) x <- diff(x,lag=1,difference=par3)
if (par4 > 0) x <- diff(x,lag=par5,difference=par4)
bitmap(file='pic1.png')
racf <- acf(x, par1, main='Autocorrelation', xlab='time lag', ylab='ACF', ci.type=par6, ci=par7, sub=paste('(lambda=',par2,', d=',par3,', D=',par4,', CI=', par7, ', CI type=',par6,')',sep=''))
dev.off()
bitmap(file='pic2.png')
rpacf <- pacf(x,par1,main='Partial Autocorrelation',xlab='lags',ylab='PACF')
dev.off()
(myacf <- c(racf$acf))
(mypacf <- c(rpacf$acf))
lengthx <- length(x)
sqrtn <- sqrt(lengthx)
load(file='createtable')
a<-table.start()
a<-table.row.start(a)
a<-table.element(a,'Autocorrelation Function',4,TRUE)
a<-table.row.end(a)
a<-table.row.start(a)
a<-table.element(a,'Time lag k',header=TRUE)
a<-table.element(a,hyperlink('basics.htm','ACF(k)','click here for more information about the Autocorrelation Function'),header=TRUE)
a<-table.element(a,'T-STAT',header=TRUE)
a<-table.element(a,'P-value',header=TRUE)
a<-table.row.end(a)
for (i in 2:(par1+1)) {
a<-table.row.start(a)
a<-table.element(a,i-1,header=TRUE)
a<-table.element(a,round(myacf[i],6))
mytstat <- myacf[i]*sqrtn
a<-table.element(a,round(mytstat,4))
a<-table.element(a,round(1-pt(abs(mytstat),lengthx),6))
a<-table.row.end(a)
}
a<-table.end(a)
table.save(a,file='mytable.tab')
a<-table.start()
a<-table.row.start(a)
a<-table.element(a,'Partial Autocorrelation Function',4,TRUE)
a<-table.row.end(a)
a<-table.row.start(a)
a<-table.element(a,'Time lag k',header=TRUE)
a<-table.element(a,hyperlink('basics.htm','PACF(k)','click here for more information about the Partial Autocorrelation Function'),header=TRUE)
a<-table.element(a,'T-STAT',header=TRUE)
a<-table.element(a,'P-value',header=TRUE)
a<-table.row.end(a)
for (i in 1:par1) {
a<-table.row.start(a)
a<-table.element(a,i,header=TRUE)
a<-table.element(a,round(mypacf[i],6))
mytstat <- mypacf[i]*sqrtn
a<-table.element(a,round(mytstat,4))
a<-table.element(a,round(1-pt(abs(mytstat),lengthx),6))
a<-table.row.end(a)
}
a<-table.end(a)
table.save(a,file='mytable1.tab')