Free Statistics
of Irreproducible Research!
Description of Statistical Computation | |
|---|---|
| Author's title | |
| Author | *The author of this computation has been verified* |
| R Software Module | Rscript (source code is shown below) |
| Title produced by software | R console |
| Date of computation | Mon, 31 Aug 2009 12:10:28 -0600 |
| Cite this page as follows | Statistical Computations at FreeStatistics.org, Office for Research Development and Education, URL https://freestatistics.org/blog/index.php?v=date/2009/Aug/31/t12517422300dkfahzbyim9v5y.htm/, Retrieved Mon, 06 May 2024 15:50:09 +0000 |
| Statistical Computations at FreeStatistics.org, Office for Research Development and Education, URL https://freestatistics.org/blog/index.php?pk=42976, Retrieved Mon, 06 May 2024 15:50:09 +0000 | |
| QR Codes: | |
|
| |
| Original text written by user: | This example is used in the manual files of the RC package. |
| IsPrivate? | No (this computation is public) |
| User-defined keywords | blogtest |
| Estimated Impact | 235 |
Tree of Dependent Computations | |
| Family? (F = Feedback message, R = changed R code, M = changed R Module, P = changed Parameters, D = changed Data) | |
| - [Spectral Analysis] [] [2009-06-19 08:45:25] [b98453cac15ba1066b407e146608df68] - RMPD [R console] [correlation test] [2009-08-31 18:10:28] [256f657a32c6b2b7628dddcfa9a822d0] [Current] | |
| Feedback Forum | |
Post a new message | |
Dataset | |
| Dataseries X: | |
-1.27727009020792 0.482493860984373 0.359162753176106 -0.138863560716465 0.580446981204343 -0.398222825857874 0.277301848182217 -1.13676025969360 0.478588305874669 -1.91820284942325 -1.11174151692594 -1.00715178031221 0.517545922027268 2.11346945099162 0.727387125489287 -0.511349116406935 -0.250965030706011 0.272183656608295 -1.04734294213924 0.0886197610476271 0.388191887196504 0.824315578726919 -0.188935400406384 0.216701704067522 -0.37639012911521 -0.775856210691298 -1.61851709337684 0.114477542383322 -1.45492722524709 -0.783989930710514 1.05827107330168 -0.31790855897573 0.483133857842346 1.12519189974254 -0.669411027856674 -1.73701648326859 0.913110415880422 -0.0266542841729206 0.00227694887911690 -1.61737125934217 0.564728009576605 -0.175523919180683 -2.073305433872 0.132440696855259 -0.165310486835592 -1.42455749987090 -0.984711912527425 -0.935801277799031 -0.431212046299194 -1.85556764115068 -1.52868404434444 1.2880932883238 -0.178744307972418 1.76829567770725 -0.579711484957435 0.0537550297565222 -0.200191529586478 0.785081006969364 -1.75500984043470 0.606706775891731 -0.702643755798583 -1.35976747966109 -1.43316478404644 0.980090481251435 0.235190051127518 0.0357981785276385 -0.422256099543657 -0.387400789057854 -0.0720065587878162 -0.383515889784851 -1.87174010496028 0.598033035536933 1.81121053321202 1.15160528458993 -1.06656111629967 -0.228083985742934 0.305957540108089 -0.626792321322032 0.475679722469415 0.961603170580432 -0.0489565040219860 0.59679980352641 0.291888534797808 0.706926002144715 -0.9880107624271 -0.354890330737817 0.381793755471945 -1.30845202544820 1.04588013926654 -0.579051344070254 -0.623691261387904 0.0198404520298670 0.854662147990061 -0.676173182726806 -1.00737641697612 1.61893934937181 0.414274844449675 0.425814987292635 1.287105496273 1.64023370040063 | |
Tables (Output of Computation) | |
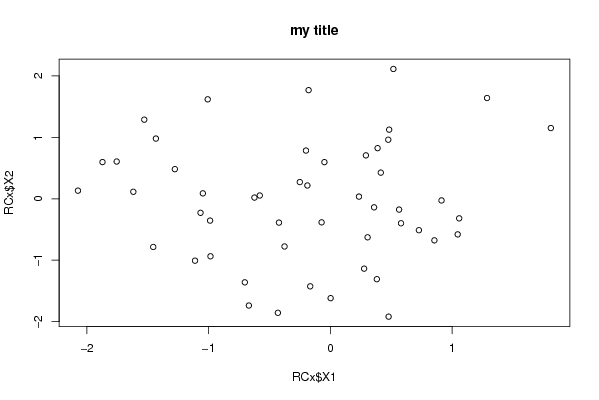
> title = 'my title'


> {
+     plot(RCx$X1, RCx$X2, main = title)
+     res <- cor.test(RCx$X1, RCx$X2)
+     print(res)
+ }

	Pearson's product-moment correlation

data:  RCx$X1 and RCx$X2
t = 0.1177, df = 48, p-value = 0.9068
alternative hypothesis: true correlation is not equal to 0
95 percent confidence interval:
 -0.2626042  0.2939431
sample estimates:
       cor
0.01698508
| |
Figures (Output of Computation) | |
Input Parameters & R Code | |
| Parameters (Session): | |
| par1 = 'mytitle' ; | |
| Parameters (R input): | |
| R code (body of R function): | |
{ | |