Free Statistics
of Irreproducible Research!
Description of Statistical Computation | |
|---|---|
| Author's title | |
| Author | *The author of this computation has been verified* |
| R Software Module | Rscript (source code is shown below) |
| Title produced by software | R console |
| Date of computation | Sat, 29 Aug 2009 17:01:47 -0600 |
| Cite this page as follows | Statistical Computations at FreeStatistics.org, Office for Research Development and Education, URL https://freestatistics.org/blog/index.php?v=date/2009/Aug/30/t12515869091q7f6p2p0ue5usf.htm/, Retrieved Sun, 05 May 2024 04:50:29 +0000 |
| Statistical Computations at FreeStatistics.org, Office for Research Development and Education, URL https://freestatistics.org/blog/index.php?pk=42973, Retrieved Sun, 05 May 2024 04:50:29 +0000 | |
| QR Codes: | |
|
| |
| Original text written by user: | This example is used in the manual files of the RC package. |
| IsPrivate? | No (this computation is public) |
| User-defined keywords | blogtest |
| Estimated Impact | 241 |
Tree of Dependent Computations | |
| Family? (F = Feedback message, R = changed R code, M = changed R Module, P = changed Parameters, D = changed Data) | |
| - [Bagplot] [test] [2009-08-13 21:20:56] [b98453cac15ba1066b407e146608df68] - RMPD [R console] [correlation test] [2009-08-29 23:01:47] [256f657a32c6b2b7628dddcfa9a822d0] [Current] | |
| Feedback Forum | |
Post a new message | |
Dataset | |
| Dataseries X: | |
-1.23898463001445 -0.439966438152365 -0.0603164254528264 -1.25989756140679 -2.58460422516154 0.960528798498823 0.773870982178124 0.954711832326916 0.169528880113061 0.638284198507943 -0.291864272836566 0.0513364392259876 0.198120442799533 0.903618580515252 -1.62276470529960 0.488076763939513 0.693627261433901 2.01585262974704 -1.41033229946526 -0.0906703429223963 0.58979674430614 0.864200377738027 0.0199585399658409 -0.0661524322968324 1.72887002169133 -1.49598116939944 0.958755282429598 -0.178098379973317 1.22537341244611 -0.859053618939166 -0.594948779165072 -1.41526435029997 0.303622665720047 -0.116552815013943 -0.0629552266653635 -0.442718408944128 1.11587834086861 -0.169124458597329 0.0946765288111667 -1.80872741524225 0.389828329377609 2.14636540560490 0.845310035492925 -1.39558250600456 1.63293119286397 -0.503704141522956 0.422854245200915 1.23791149072288 0.315886543345934 -1.19227836937224 -1.31271402308035 0.396710116419303 1.03211242096652 1.75216413819452 0.677376651841988 -0.00616891559632015 1.15530503286584 -1.18272504637606 -1.22996531364669 0.362432101872329 0.30969331782038 -0.500174970524509 -0.9568659561503 -0.99926023344905 0.253723479132294 0.255071917186551 -2.21688879223726 1.56650916893624 -0.730509907787133 0.567602789879964 1.97540537712330 0.0329408859296437 0.673531134725722 -2.66181795078345 -1.52933697531635 0.993496775222839 -0.837300671524453 0.884901250733245 0.162804974022089 0.057030275508549 0.161551310993178 -0.873765543330094 -1.50703832092723 -1.31784076990589 0.771447424831402 3.01009760125672 0.68769484185633 1.34998126288683 2.65985873326011 0.872340280290565 1.84382306749596 -0.112135786556078 0.376588970024935 -0.702737423626425 -0.922129886363108 -1.4714484808884 -1.31609375781377 -1.02687937826102 -1.30557455515497 0.187644369740978 | |
Tables (Output of Computation) | |
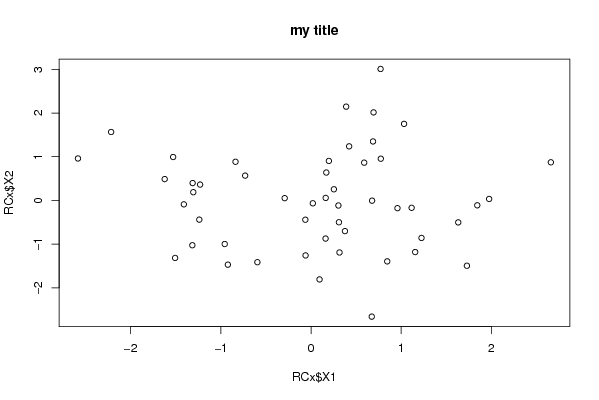
> title = 'my title'


> {
+     plot(RCx$X1, RCx$X2, main = title)
+     res <- cor.test(RCx$X1, RCx$X2)
+     print(res)
+ }

	Pearson's product-moment correlation

data:  RCx$X1 and RCx$X2
t = -0.2282, df = 48, p-value = 0.8204
alternative hypothesis: true correlation is not equal to 0
95 percent confidence interval:
 -0.3084451  0.2476936
sample estimates:
       cor
-0.0329241
| |
Figures (Output of Computation) | |
Input Parameters & R Code | |
| Parameters (Session): | |
| par1 = 'mytitle' ; | |
| Parameters (R input): | |
| R code (body of R function): | |
{ | |