Free Statistics

of Irreproducible Research!

Author's title

Author*Unverified author*
R Software Modulerwasp_exponentialsmoothing.wasp
Title produced by softwareExponential Smoothing
Date of computationTue, 18 Aug 2009 12:42:28 -0600
Cite this page as followsStatistical Computations at FreeStatistics.org, Office for Research Development and Education, URL https://freestatistics.org/blog/index.php?v=date/2009/Aug/18/t1250620980dsqo8xcbndcvv0z.htm/, Retrieved Mon, 06 May 2024 11:28:24 +0000
Statistical Computations at FreeStatistics.org, Office for Research Development and Education, URL https://freestatistics.org/blog/index.php?pk=42868, Retrieved Mon, 06 May 2024 11:28:24 +0000
QR Codes:

Original text written by user:
IsPrivate?No (this computation is public)
User-defined keywords
Estimated Impact193
Family? (F = Feedback message, R = changed R code, M = changed R Module, P = changed Parameters, D = changed Data)
-       [Exponential Smoothing] [opgave 10.1] [2009-08-18 18:42:28] [d41d8cd98f00b204e9800998ecf8427e] [Current]
Feedback Forum

Post a new message
Dataseries X:
108,87
106,38
104,77
105,38
106,74
110
110,73
115,7
115,44
113,66
118,4
116,71
119,7
114,17
110,52
111,27
111,41
111,62
113,91
118,54
122,26
120,44
121,37
121,49
125
117,24
117,18
115,15
115,27
114,6
117,48
120,8
118,62
116,79
115,46
112,83
115,56
106,66
103,39
102,65
103,22
104,1
104,32


Summary of computational transaction
Raw Inputview raw input (R code)
Raw Outputview raw output of R engine
Computing time12 seconds
R Server'George Udny Yule' @ 72.249.76.132

\begin{tabular}{lllllllll}
\hline
Summary of computational transaction \tabularnewline
Raw Input & view raw input (R code)  \tabularnewline
Raw Output & view raw output of R engine  \tabularnewline
Computing time & 12 seconds \tabularnewline
R Server & 'George Udny Yule' @ 72.249.76.132 \tabularnewline
\hline
\end{tabular}
%Source: https://freestatistics.org/blog/index.php?pk=42868&T=0

[TABLE]
[ROW][C]Summary of computational transaction[/C][/ROW]
[ROW][C]Raw Input[/C][C]view raw input (R code) [/C][/ROW]
[ROW][C]Raw Output[/C][C]view raw output of R engine [/C][/ROW]
[ROW][C]Computing time[/C][C]12 seconds[/C][/ROW]
[ROW][C]R Server[/C][C]'George Udny Yule' @ 72.249.76.132[/C][/ROW]
[/TABLE]
Source: https://freestatistics.org/blog/index.php?pk=42868&T=0

Globally Unique Identifier (entire table): ba.freestatistics.org/blog/index.php?pk=42868&T=0

As an alternative you can also use a QR Code:  

The GUIDs for individual cells are displayed in the table below:

Summary of computational transaction
Raw Inputview raw input (R code)
Raw Outputview raw output of R engine
Computing time12 seconds
R Server'George Udny Yule' @ 72.249.76.132


Estimated Parameters of Exponential Smoothing
ParameterValue
alpha0.681306178212979
beta0.19014940357291
gamma0.686106027377372

\begin{tabular}{lllllllll}
\hline
Estimated Parameters of Exponential Smoothing \tabularnewline
Parameter & Value \tabularnewline
alpha & 0.681306178212979 \tabularnewline
beta & 0.19014940357291 \tabularnewline
gamma & 0.686106027377372 \tabularnewline
\hline
\end{tabular}
%Source: https://freestatistics.org/blog/index.php?pk=42868&T=1

[TABLE]
[ROW][C]Estimated Parameters of Exponential Smoothing[/C][/ROW]
[ROW][C]Parameter[/C][C]Value[/C][/ROW]
[ROW][C]alpha[/C][C]0.681306178212979[/C][/ROW]
[ROW][C]beta[/C][C]0.19014940357291[/C][/ROW]
[ROW][C]gamma[/C][C]0.686106027377372[/C][/ROW]
[/TABLE]
Source: https://freestatistics.org/blog/index.php?pk=42868&T=1

Globally Unique Identifier (entire table): ba.freestatistics.org/blog/index.php?pk=42868&T=1

As an alternative you can also use a QR Code:  

The GUIDs for individual cells are displayed in the table below:

Estimated Parameters of Exponential Smoothing
ParameterValue
alpha0.681306178212979
beta0.19014940357291
gamma0.686106027377372


Interpolation Forecasts of Exponential Smoothing
tObservedFittedResiduals
13119.7117.3569551282052.34304487179487
14114.17113.8676083384440.302391661555873
15110.52110.755460070989-0.235460070988893
16111.27111.482199584934-0.212199584934027
17111.41111.747712829934-0.337712829933551
18111.62112.037295774230-0.417295774230311
19113.91116.117764381270-2.20776438126973
20118.54119.100276536231-0.560276536230816
21122.26118.1143152004314.14568479956931
22120.44119.4307943780181.00920562198219
23121.37125.306113465507-3.93611346550738
24121.49121.0501494165790.439850583420792
25125125.086947594697-0.086947594696511
26117.24119.224207960210-1.98420796020952
27117.18113.8687315744943.31126842550589
28115.15116.908595540085-1.75859554008545
29115.27115.784390012376-0.514390012375515
30114.6115.604606540000-1.00460653999951
31117.48118.485757031860-1.00575703185983
32120.8122.39548039581-1.5954803958101
33118.62121.347152766279-2.72715276627878
34116.79116.0188634715640.771136528436188
35115.46119.343364127123-3.88336412712276
36112.83114.779722532049-1.94972253204939
37115.56115.4632777100460.0967222899537603
38106.66107.724593675186-1.06459367518632
39103.39102.6864600017610.703539998238583
40102.65101.0361731545801.61382684542036
41103.22101.1136479477012.10635205229873
42104.1101.5836925605252.51630743947483
43104.32106.291036181868-1.97103618186829

\begin{tabular}{lllllllll}
\hline
Interpolation Forecasts of Exponential Smoothing \tabularnewline
t & Observed & Fitted & Residuals \tabularnewline
13 & 119.7 & 117.356955128205 & 2.34304487179487 \tabularnewline
14 & 114.17 & 113.867608338444 & 0.302391661555873 \tabularnewline
15 & 110.52 & 110.755460070989 & -0.235460070988893 \tabularnewline
16 & 111.27 & 111.482199584934 & -0.212199584934027 \tabularnewline
17 & 111.41 & 111.747712829934 & -0.337712829933551 \tabularnewline
18 & 111.62 & 112.037295774230 & -0.417295774230311 \tabularnewline
19 & 113.91 & 116.117764381270 & -2.20776438126973 \tabularnewline
20 & 118.54 & 119.100276536231 & -0.560276536230816 \tabularnewline
21 & 122.26 & 118.114315200431 & 4.14568479956931 \tabularnewline
22 & 120.44 & 119.430794378018 & 1.00920562198219 \tabularnewline
23 & 121.37 & 125.306113465507 & -3.93611346550738 \tabularnewline
24 & 121.49 & 121.050149416579 & 0.439850583420792 \tabularnewline
25 & 125 & 125.086947594697 & -0.086947594696511 \tabularnewline
26 & 117.24 & 119.224207960210 & -1.98420796020952 \tabularnewline
27 & 117.18 & 113.868731574494 & 3.31126842550589 \tabularnewline
28 & 115.15 & 116.908595540085 & -1.75859554008545 \tabularnewline
29 & 115.27 & 115.784390012376 & -0.514390012375515 \tabularnewline
30 & 114.6 & 115.604606540000 & -1.00460653999951 \tabularnewline
31 & 117.48 & 118.485757031860 & -1.00575703185983 \tabularnewline
32 & 120.8 & 122.39548039581 & -1.5954803958101 \tabularnewline
33 & 118.62 & 121.347152766279 & -2.72715276627878 \tabularnewline
34 & 116.79 & 116.018863471564 & 0.771136528436188 \tabularnewline
35 & 115.46 & 119.343364127123 & -3.88336412712276 \tabularnewline
36 & 112.83 & 114.779722532049 & -1.94972253204939 \tabularnewline
37 & 115.56 & 115.463277710046 & 0.0967222899537603 \tabularnewline
38 & 106.66 & 107.724593675186 & -1.06459367518632 \tabularnewline
39 & 103.39 & 102.686460001761 & 0.703539998238583 \tabularnewline
40 & 102.65 & 101.036173154580 & 1.61382684542036 \tabularnewline
41 & 103.22 & 101.113647947701 & 2.10635205229873 \tabularnewline
42 & 104.1 & 101.583692560525 & 2.51630743947483 \tabularnewline
43 & 104.32 & 106.291036181868 & -1.97103618186829 \tabularnewline
\hline
\end{tabular}
%Source: https://freestatistics.org/blog/index.php?pk=42868&T=2

[TABLE]
[ROW][C]Interpolation Forecasts of Exponential Smoothing[/C][/ROW]
[ROW][C]t[/C][C]Observed[/C][C]Fitted[/C][C]Residuals[/C][/ROW]
[ROW][C]13[/C][C]119.7[/C][C]117.356955128205[/C][C]2.34304487179487[/C][/ROW]
[ROW][C]14[/C][C]114.17[/C][C]113.867608338444[/C][C]0.302391661555873[/C][/ROW]
[ROW][C]15[/C][C]110.52[/C][C]110.755460070989[/C][C]-0.235460070988893[/C][/ROW]
[ROW][C]16[/C][C]111.27[/C][C]111.482199584934[/C][C]-0.212199584934027[/C][/ROW]
[ROW][C]17[/C][C]111.41[/C][C]111.747712829934[/C][C]-0.337712829933551[/C][/ROW]
[ROW][C]18[/C][C]111.62[/C][C]112.037295774230[/C][C]-0.417295774230311[/C][/ROW]
[ROW][C]19[/C][C]113.91[/C][C]116.117764381270[/C][C]-2.20776438126973[/C][/ROW]
[ROW][C]20[/C][C]118.54[/C][C]119.100276536231[/C][C]-0.560276536230816[/C][/ROW]
[ROW][C]21[/C][C]122.26[/C][C]118.114315200431[/C][C]4.14568479956931[/C][/ROW]
[ROW][C]22[/C][C]120.44[/C][C]119.430794378018[/C][C]1.00920562198219[/C][/ROW]
[ROW][C]23[/C][C]121.37[/C][C]125.306113465507[/C][C]-3.93611346550738[/C][/ROW]
[ROW][C]24[/C][C]121.49[/C][C]121.050149416579[/C][C]0.439850583420792[/C][/ROW]
[ROW][C]25[/C][C]125[/C][C]125.086947594697[/C][C]-0.086947594696511[/C][/ROW]
[ROW][C]26[/C][C]117.24[/C][C]119.224207960210[/C][C]-1.98420796020952[/C][/ROW]
[ROW][C]27[/C][C]117.18[/C][C]113.868731574494[/C][C]3.31126842550589[/C][/ROW]
[ROW][C]28[/C][C]115.15[/C][C]116.908595540085[/C][C]-1.75859554008545[/C][/ROW]
[ROW][C]29[/C][C]115.27[/C][C]115.784390012376[/C][C]-0.514390012375515[/C][/ROW]
[ROW][C]30[/C][C]114.6[/C][C]115.604606540000[/C][C]-1.00460653999951[/C][/ROW]
[ROW][C]31[/C][C]117.48[/C][C]118.485757031860[/C][C]-1.00575703185983[/C][/ROW]
[ROW][C]32[/C][C]120.8[/C][C]122.39548039581[/C][C]-1.5954803958101[/C][/ROW]
[ROW][C]33[/C][C]118.62[/C][C]121.347152766279[/C][C]-2.72715276627878[/C][/ROW]
[ROW][C]34[/C][C]116.79[/C][C]116.018863471564[/C][C]0.771136528436188[/C][/ROW]
[ROW][C]35[/C][C]115.46[/C][C]119.343364127123[/C][C]-3.88336412712276[/C][/ROW]
[ROW][C]36[/C][C]112.83[/C][C]114.779722532049[/C][C]-1.94972253204939[/C][/ROW]
[ROW][C]37[/C][C]115.56[/C][C]115.463277710046[/C][C]0.0967222899537603[/C][/ROW]
[ROW][C]38[/C][C]106.66[/C][C]107.724593675186[/C][C]-1.06459367518632[/C][/ROW]
[ROW][C]39[/C][C]103.39[/C][C]102.686460001761[/C][C]0.703539998238583[/C][/ROW]
[ROW][C]40[/C][C]102.65[/C][C]101.036173154580[/C][C]1.61382684542036[/C][/ROW]
[ROW][C]41[/C][C]103.22[/C][C]101.113647947701[/C][C]2.10635205229873[/C][/ROW]
[ROW][C]42[/C][C]104.1[/C][C]101.583692560525[/C][C]2.51630743947483[/C][/ROW]
[ROW][C]43[/C][C]104.32[/C][C]106.291036181868[/C][C]-1.97103618186829[/C][/ROW]
[/TABLE]
Source: https://freestatistics.org/blog/index.php?pk=42868&T=2

Globally Unique Identifier (entire table): ba.freestatistics.org/blog/index.php?pk=42868&T=2

As an alternative you can also use a QR Code:  

The GUIDs for individual cells are displayed in the table below:

Interpolation Forecasts of Exponential Smoothing
tObservedFittedResiduals
13119.7117.3569551282052.34304487179487
14114.17113.8676083384440.302391661555873
15110.52110.755460070989-0.235460070988893
16111.27111.482199584934-0.212199584934027
17111.41111.747712829934-0.337712829933551
18111.62112.037295774230-0.417295774230311
19113.91116.117764381270-2.20776438126973
20118.54119.100276536231-0.560276536230816
21122.26118.1143152004314.14568479956931
22120.44119.4307943780181.00920562198219
23121.37125.306113465507-3.93611346550738
24121.49121.0501494165790.439850583420792
25125125.086947594697-0.086947594696511
26117.24119.224207960210-1.98420796020952
27117.18113.8687315744943.31126842550589
28115.15116.908595540085-1.75859554008545
29115.27115.784390012376-0.514390012375515
30114.6115.604606540000-1.00460653999951
31117.48118.485757031860-1.00575703185983
32120.8122.39548039581-1.5954803958101
33118.62121.347152766279-2.72715276627878
34116.79116.0188634715640.771136528436188
35115.46119.343364127123-3.88336412712276
36112.83114.779722532049-1.94972253204939
37115.56115.4632777100460.0967222899537603
38106.66107.724593675186-1.06459367518632
39103.39102.6864600017610.703539998238583
40102.65101.0361731545801.61382684542036
41103.22101.1136479477012.10635205229873
42104.1101.5836925605252.51630743947483
43104.32106.291036181868-1.97103618186829


Extrapolation Forecasts of Exponential Smoothing
tForecast95% Lower Bound95% Upper Bound
44108.716733679828104.936846395675112.496620963982
45108.017234559261103.150877130440112.883591988083
46105.17446870201499.148124660124111.200812743903
47106.71851525312499.4608783865305113.976152119718
48105.48919766190096.9317198149326114.046675508868
49108.46692666133598.5438320582813118.390021264389
50100.91422881546189.5623561754648112.266101455457
5197.631758017238784.7903552025186110.473160831959
5296.253775209999581.864291922032110.643258497967
5395.682951960166379.6888467048854111.677057215447
5494.878205701140977.2247718010534112.531639601228
5596.634633383624877.2688442882669116.000422478983

\begin{tabular}{lllllllll}
\hline
Extrapolation Forecasts of Exponential Smoothing \tabularnewline
t & Forecast & 95% Lower Bound & 95% Upper Bound \tabularnewline
44 & 108.716733679828 & 104.936846395675 & 112.496620963982 \tabularnewline
45 & 108.017234559261 & 103.150877130440 & 112.883591988083 \tabularnewline
46 & 105.174468702014 & 99.148124660124 & 111.200812743903 \tabularnewline
47 & 106.718515253124 & 99.4608783865305 & 113.976152119718 \tabularnewline
48 & 105.489197661900 & 96.9317198149326 & 114.046675508868 \tabularnewline
49 & 108.466926661335 & 98.5438320582813 & 118.390021264389 \tabularnewline
50 & 100.914228815461 & 89.5623561754648 & 112.266101455457 \tabularnewline
51 & 97.6317580172387 & 84.7903552025186 & 110.473160831959 \tabularnewline
52 & 96.2537752099995 & 81.864291922032 & 110.643258497967 \tabularnewline
53 & 95.6829519601663 & 79.6888467048854 & 111.677057215447 \tabularnewline
54 & 94.8782057011409 & 77.2247718010534 & 112.531639601228 \tabularnewline
55 & 96.6346333836248 & 77.2688442882669 & 116.000422478983 \tabularnewline
\hline
\end{tabular}
%Source: https://freestatistics.org/blog/index.php?pk=42868&T=3

[TABLE]
[ROW][C]Extrapolation Forecasts of Exponential Smoothing[/C][/ROW]
[ROW][C]t[/C][C]Forecast[/C][C]95% Lower Bound[/C][C]95% Upper Bound[/C][/ROW]
[ROW][C]44[/C][C]108.716733679828[/C][C]104.936846395675[/C][C]112.496620963982[/C][/ROW]
[ROW][C]45[/C][C]108.017234559261[/C][C]103.150877130440[/C][C]112.883591988083[/C][/ROW]
[ROW][C]46[/C][C]105.174468702014[/C][C]99.148124660124[/C][C]111.200812743903[/C][/ROW]
[ROW][C]47[/C][C]106.718515253124[/C][C]99.4608783865305[/C][C]113.976152119718[/C][/ROW]
[ROW][C]48[/C][C]105.489197661900[/C][C]96.9317198149326[/C][C]114.046675508868[/C][/ROW]
[ROW][C]49[/C][C]108.466926661335[/C][C]98.5438320582813[/C][C]118.390021264389[/C][/ROW]
[ROW][C]50[/C][C]100.914228815461[/C][C]89.5623561754648[/C][C]112.266101455457[/C][/ROW]
[ROW][C]51[/C][C]97.6317580172387[/C][C]84.7903552025186[/C][C]110.473160831959[/C][/ROW]
[ROW][C]52[/C][C]96.2537752099995[/C][C]81.864291922032[/C][C]110.643258497967[/C][/ROW]
[ROW][C]53[/C][C]95.6829519601663[/C][C]79.6888467048854[/C][C]111.677057215447[/C][/ROW]
[ROW][C]54[/C][C]94.8782057011409[/C][C]77.2247718010534[/C][C]112.531639601228[/C][/ROW]
[ROW][C]55[/C][C]96.6346333836248[/C][C]77.2688442882669[/C][C]116.000422478983[/C][/ROW]
[/TABLE]
Source: https://freestatistics.org/blog/index.php?pk=42868&T=3

Globally Unique Identifier (entire table): ba.freestatistics.org/blog/index.php?pk=42868&T=3

As an alternative you can also use a QR Code:  

The GUIDs for individual cells are displayed in the table below:

Extrapolation Forecasts of Exponential Smoothing
tForecast95% Lower Bound95% Upper Bound
44108.716733679828104.936846395675112.496620963982
45108.017234559261103.150877130440112.883591988083
46105.17446870201499.148124660124111.200812743903
47106.71851525312499.4608783865305113.976152119718
48105.48919766190096.9317198149326114.046675508868
49108.46692666133598.5438320582813118.390021264389
50100.91422881546189.5623561754648112.266101455457
5197.631758017238784.7903552025186110.473160831959
5296.253775209999581.864291922032110.643258497967
5395.682951960166379.6888467048854111.677057215447
5494.878205701140977.2247718010534112.531639601228
5596.634633383624877.2688442882669116.000422478983


Parameters (Session):
par1 = 12 ; par2 = Triple ; par3 = additive ;
Parameters (R input):
par1 = 12 ; par2 = Triple ; par3 = additive ;
R code (references can be found in the software module):
par1 <- as.numeric(par1)
if (par2 == 'Single') K <- 1
if (par2 == 'Double') K <- 2
if (par2 == 'Triple') K <- par1
nx <- length(x)
nxmK <- nx - K
x <- ts(x, frequency = par1)
if (par2 == 'Single') fit <- HoltWinters(x, gamma=0, beta=0)
if (par2 == 'Double') fit <- HoltWinters(x, gamma=0)
if (par2 == 'Triple') fit <- HoltWinters(x, seasonal=par3)
fit
myresid <- x - fit$fitted[,'xhat']
bitmap(file='test1.png')
op <- par(mfrow=c(2,1))
plot(fit,ylab='Observed (black) / Fitted (red)',main='Interpolation Fit of Exponential Smoothing')
plot(myresid,ylab='Residuals',main='Interpolation Prediction Errors')
par(op)
dev.off()
bitmap(file='test2.png')
p <- predict(fit, par1, prediction.interval=TRUE)
np <- length(p[,1])
plot(fit,p,ylab='Observed (black) / Fitted (red)',main='Extrapolation Fit of Exponential Smoothing')
dev.off()
bitmap(file='test3.png')
op <- par(mfrow = c(2,2))
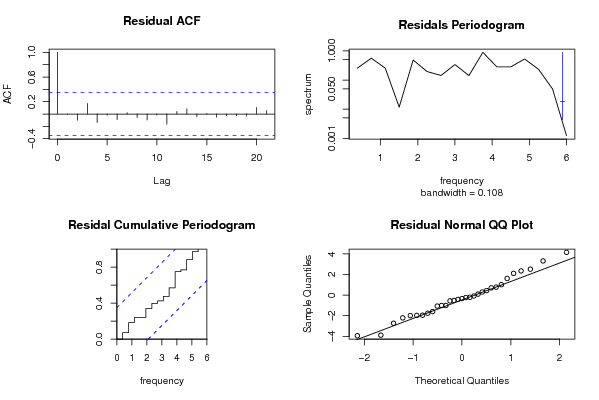
acf(as.numeric(myresid),lag.max = nx/2,main='Residual ACF')
spectrum(myresid,main='Residals Periodogram')
cpgram(myresid,main='Residal Cumulative Periodogram')
qqnorm(myresid,main='Residual Normal QQ Plot')
qqline(myresid)
par(op)
dev.off()
load(file='createtable')
a<-table.start()
a<-table.row.start(a)
a<-table.element(a,'Estimated Parameters of Exponential Smoothing',2,TRUE)
a<-table.row.end(a)
a<-table.row.start(a)
a<-table.element(a,'Parameter',header=TRUE)
a<-table.element(a,'Value',header=TRUE)
a<-table.row.end(a)
a<-table.row.start(a)
a<-table.element(a,'alpha',header=TRUE)
a<-table.element(a,fit$alpha)
a<-table.row.end(a)
a<-table.row.start(a)
a<-table.element(a,'beta',header=TRUE)
a<-table.element(a,fit$beta)
a<-table.row.end(a)
a<-table.row.start(a)
a<-table.element(a,'gamma',header=TRUE)
a<-table.element(a,fit$gamma)
a<-table.row.end(a)
a<-table.end(a)
table.save(a,file='mytable.tab')
a<-table.start()
a<-table.row.start(a)
a<-table.element(a,'Interpolation Forecasts of Exponential Smoothing',4,TRUE)
a<-table.row.end(a)
a<-table.row.start(a)
a<-table.element(a,'t',header=TRUE)
a<-table.element(a,'Observed',header=TRUE)
a<-table.element(a,'Fitted',header=TRUE)
a<-table.element(a,'Residuals',header=TRUE)
a<-table.row.end(a)
for (i in 1:nxmK) {
a<-table.row.start(a)
a<-table.element(a,i+K,header=TRUE)
a<-table.element(a,x[i+K])
a<-table.element(a,fit$fitted[i,'xhat'])
a<-table.element(a,myresid[i])
a<-table.row.end(a)
}
a<-table.end(a)
table.save(a,file='mytable1.tab')
a<-table.start()
a<-table.row.start(a)
a<-table.element(a,'Extrapolation Forecasts of Exponential Smoothing',4,TRUE)
a<-table.row.end(a)
a<-table.row.start(a)
a<-table.element(a,'t',header=TRUE)
a<-table.element(a,'Forecast',header=TRUE)
a<-table.element(a,'95% Lower Bound',header=TRUE)
a<-table.element(a,'95% Upper Bound',header=TRUE)
a<-table.row.end(a)
for (i in 1:np) {
a<-table.row.start(a)
a<-table.element(a,nx+i,header=TRUE)
a<-table.element(a,p[i,'fit'])
a<-table.element(a,p[i,'lwr'])
a<-table.element(a,p[i,'upr'])
a<-table.row.end(a)
}
a<-table.end(a)
table.save(a,file='mytable2.tab')