Free Statistics

of Irreproducible Research!

Author's title

Author*Unverified author*
R Software Modulerwasp_autocorrelation.wasp
Title produced by software(Partial) Autocorrelation Function
Date of computationTue, 18 Aug 2009 07:12:32 -0600
Cite this page as followsStatistical Computations at FreeStatistics.org, Office for Research Development and Education, URL https://freestatistics.org/blog/index.php?v=date/2009/Aug/18/t1250601184dzbyu286edf7agi.htm/, Retrieved Tue, 07 May 2024 03:42:23 +0000
Statistical Computations at FreeStatistics.org, Office for Research Development and Education, URL https://freestatistics.org/blog/index.php?pk=42808, Retrieved Tue, 07 May 2024 03:42:23 +0000
QR Codes:

Original text written by user:
IsPrivate?No (this computation is public)
User-defined keywords
Estimated Impact172
Family? (F = Feedback message, R = changed R code, M = changed R Module, P = changed Parameters, D = changed Data)
-     [Univariate Data Series] [grafiek opdracht ...] [2009-04-24 14:37:54] [74be16979710d4c4e7c6647856088456]
-       [Univariate Data Series] [grafiek opdracht6...] [2009-04-24 15:28:36] [74be16979710d4c4e7c6647856088456]
- RMPD      [(Partial) Autocorrelation Function] [GuyVanHasseltpart...] [2009-08-18 13:12:32] [0d1085ed835696cdd537ad5fa07600ec] [Current]
Feedback Forum

Post a new message
Dataseries X:
0.8800
1.0300
0.6900
0.7100
1.1100
1.0500
1.0300
0.6500
0.5900
0.7700
0.9000
1.2600
0.9600
0.8300
0.8700
0.7900
1.1200
0.8800
0.6400
0.6400
0.5800
0.5000
0.9900
1.0700
0.8900
0.8900
0.8300
0.8600
0.9000
1.1200
0.8800
0.8800
0.8900
0.8200
0.8800
0.8100
0.8800
0.7600
1.1300
0.8500
1.4500
1.5500
0.7100
0.8100
0.8300
0.7300
0.9000
0.9400
1.7800
0.8800
1.0400
0.8300
1.4100
0.9600
1.3000
0.8300
1.4000
0.9100
0.8700
0.9700
1.1900
1.2300
1.3300
1.1700
1.0900
0.6300
0.8900
0.6300
1.5100
0.9700
0.8400
0.9200
0.9500
0.7300
1.0200
0.7900
1.2700
0.9500
0.7500
0.5200
0.9500
0.8200
0.7600
1.2400
0.9400
1.0400
1.8100
0.9500
1.3900
0.8600
1.1500
1.5100
0.6000
0.7200
1.1000
1.6200
1.8400
1.7300
1.3600
1.0700
1.0000
1.4900
0.9000
1.4300
1.5400
0.8100
1.6100
1.3000
1.4000
1.0300
0.7900
1.1100
1.1500
1.0300
1.5900
1.1100
1.3300
0.9300
1.0700
1.1400
1.1200
0.8600
0.8200
1.0200
1.0700
1.3100
0.9800
0.8900
0.8000
0.8000
0.7800
0.9700


Summary of computational transaction
Raw Inputview raw input (R code)
Raw Outputview raw output of R engine
Computing time1 seconds
R Server'Gwilym Jenkins' @ 72.249.127.135

\begin{tabular}{lllllllll}
\hline
Summary of computational transaction \tabularnewline
Raw Input & view raw input (R code)  \tabularnewline
Raw Output & view raw output of R engine  \tabularnewline
Computing time & 1 seconds \tabularnewline
R Server & 'Gwilym Jenkins' @ 72.249.127.135 \tabularnewline
\hline
\end{tabular}
%Source: https://freestatistics.org/blog/index.php?pk=42808&T=0

[TABLE]
[ROW][C]Summary of computational transaction[/C][/ROW]
[ROW][C]Raw Input[/C][C]view raw input (R code) [/C][/ROW]
[ROW][C]Raw Output[/C][C]view raw output of R engine [/C][/ROW]
[ROW][C]Computing time[/C][C]1 seconds[/C][/ROW]
[ROW][C]R Server[/C][C]'Gwilym Jenkins' @ 72.249.127.135[/C][/ROW]
[/TABLE]
Source: https://freestatistics.org/blog/index.php?pk=42808&T=0

Globally Unique Identifier (entire table): ba.freestatistics.org/blog/index.php?pk=42808&T=0

As an alternative you can also use a QR Code:  

The GUIDs for individual cells are displayed in the table below:

Summary of computational transaction
Raw Inputview raw input (R code)
Raw Outputview raw output of R engine
Computing time1 seconds
R Server'Gwilym Jenkins' @ 72.249.127.135


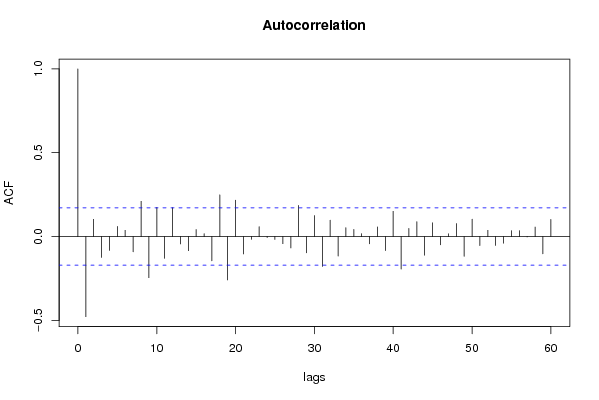
Autocorrelation Function
Time lag kACF(k)T-STATP-value
1-0.478094-5.4720
20.1024761.17290.121483
3-0.12443-1.42420.078388
4-0.082956-0.94950.172063
50.060210.68910.245979
60.037320.42720.334985
7-0.091143-1.04320.149393
80.2100392.4040.008808
9-0.245355-2.80820.002872
100.1737391.98850.024418
11-0.130342-1.49180.069073
120.17181.96630.025687
13-0.044009-0.50370.307656
14-0.084706-0.96950.167041
150.0418720.47920.316281
160.0173050.19810.421653
17-0.144717-1.65640.050021
180.2485782.84510.002577
19-0.259091-2.96540.001796
200.2168922.48240.007157
21-0.103943-1.18970.118161
22-0.016608-0.19010.424766
230.0590570.67590.250134
24-0.006139-0.07030.472043
25-0.017324-0.19830.421565
26-0.0428-0.48990.312524
27-0.067865-0.77670.219355
280.1856792.12520.017724
29-0.097159-1.1120.134079
300.1249561.43020.077522
31-0.178281-2.04050.021654
320.097231.11280.133906
33-0.116677-1.33540.092027
340.0527340.60360.273587
350.0420550.48130.315539
360.0168030.19230.423895
37-0.04354-0.49830.30954
380.0571220.65380.257197
39-0.083693-0.95790.169937
400.1506481.72420.043511
41-0.194275-2.22360.013945
420.0484130.55410.290224
430.0882331.00990.15721
44-0.111179-1.27250.102725
450.0820710.93930.174642
46-0.049223-0.56340.287069
470.0166050.190.424783
480.0776110.88830.188005
49-0.118013-1.35070.089556
500.1035731.18540.118994
51-0.053625-0.61380.270216
520.0373450.42740.334883
53-0.052861-0.6050.273106
54-0.03994-0.45710.324164
550.0347030.39720.345934
560.0349290.39980.344984
57-0.002057-0.02350.490624
580.0563020.64440.26022
59-0.102931-1.17810.120447
600.102191.16960.122139

\begin{tabular}{lllllllll}
\hline
Autocorrelation Function \tabularnewline
Time lag k & ACF(k) & T-STAT & P-value \tabularnewline
1 & -0.478094 & -5.472 & 0 \tabularnewline
2 & 0.102476 & 1.1729 & 0.121483 \tabularnewline
3 & -0.12443 & -1.4242 & 0.078388 \tabularnewline
4 & -0.082956 & -0.9495 & 0.172063 \tabularnewline
5 & 0.06021 & 0.6891 & 0.245979 \tabularnewline
6 & 0.03732 & 0.4272 & 0.334985 \tabularnewline
7 & -0.091143 & -1.0432 & 0.149393 \tabularnewline
8 & 0.210039 & 2.404 & 0.008808 \tabularnewline
9 & -0.245355 & -2.8082 & 0.002872 \tabularnewline
10 & 0.173739 & 1.9885 & 0.024418 \tabularnewline
11 & -0.130342 & -1.4918 & 0.069073 \tabularnewline
12 & 0.1718 & 1.9663 & 0.025687 \tabularnewline
13 & -0.044009 & -0.5037 & 0.307656 \tabularnewline
14 & -0.084706 & -0.9695 & 0.167041 \tabularnewline
15 & 0.041872 & 0.4792 & 0.316281 \tabularnewline
16 & 0.017305 & 0.1981 & 0.421653 \tabularnewline
17 & -0.144717 & -1.6564 & 0.050021 \tabularnewline
18 & 0.248578 & 2.8451 & 0.002577 \tabularnewline
19 & -0.259091 & -2.9654 & 0.001796 \tabularnewline
20 & 0.216892 & 2.4824 & 0.007157 \tabularnewline
21 & -0.103943 & -1.1897 & 0.118161 \tabularnewline
22 & -0.016608 & -0.1901 & 0.424766 \tabularnewline
23 & 0.059057 & 0.6759 & 0.250134 \tabularnewline
24 & -0.006139 & -0.0703 & 0.472043 \tabularnewline
25 & -0.017324 & -0.1983 & 0.421565 \tabularnewline
26 & -0.0428 & -0.4899 & 0.312524 \tabularnewline
27 & -0.067865 & -0.7767 & 0.219355 \tabularnewline
28 & 0.185679 & 2.1252 & 0.017724 \tabularnewline
29 & -0.097159 & -1.112 & 0.134079 \tabularnewline
30 & 0.124956 & 1.4302 & 0.077522 \tabularnewline
31 & -0.178281 & -2.0405 & 0.021654 \tabularnewline
32 & 0.09723 & 1.1128 & 0.133906 \tabularnewline
33 & -0.116677 & -1.3354 & 0.092027 \tabularnewline
34 & 0.052734 & 0.6036 & 0.273587 \tabularnewline
35 & 0.042055 & 0.4813 & 0.315539 \tabularnewline
36 & 0.016803 & 0.1923 & 0.423895 \tabularnewline
37 & -0.04354 & -0.4983 & 0.30954 \tabularnewline
38 & 0.057122 & 0.6538 & 0.257197 \tabularnewline
39 & -0.083693 & -0.9579 & 0.169937 \tabularnewline
40 & 0.150648 & 1.7242 & 0.043511 \tabularnewline
41 & -0.194275 & -2.2236 & 0.013945 \tabularnewline
42 & 0.048413 & 0.5541 & 0.290224 \tabularnewline
43 & 0.088233 & 1.0099 & 0.15721 \tabularnewline
44 & -0.111179 & -1.2725 & 0.102725 \tabularnewline
45 & 0.082071 & 0.9393 & 0.174642 \tabularnewline
46 & -0.049223 & -0.5634 & 0.287069 \tabularnewline
47 & 0.016605 & 0.19 & 0.424783 \tabularnewline
48 & 0.077611 & 0.8883 & 0.188005 \tabularnewline
49 & -0.118013 & -1.3507 & 0.089556 \tabularnewline
50 & 0.103573 & 1.1854 & 0.118994 \tabularnewline
51 & -0.053625 & -0.6138 & 0.270216 \tabularnewline
52 & 0.037345 & 0.4274 & 0.334883 \tabularnewline
53 & -0.052861 & -0.605 & 0.273106 \tabularnewline
54 & -0.03994 & -0.4571 & 0.324164 \tabularnewline
55 & 0.034703 & 0.3972 & 0.345934 \tabularnewline
56 & 0.034929 & 0.3998 & 0.344984 \tabularnewline
57 & -0.002057 & -0.0235 & 0.490624 \tabularnewline
58 & 0.056302 & 0.6444 & 0.26022 \tabularnewline
59 & -0.102931 & -1.1781 & 0.120447 \tabularnewline
60 & 0.10219 & 1.1696 & 0.122139 \tabularnewline
\hline
\end{tabular}
%Source: https://freestatistics.org/blog/index.php?pk=42808&T=1

[TABLE]
[ROW][C]Autocorrelation Function[/C][/ROW]
[ROW][C]Time lag k[/C][C]ACF(k)[/C][C]T-STAT[/C][C]P-value[/C][/ROW]
[ROW][C]1[/C][C]-0.478094[/C][C]-5.472[/C][C]0[/C][/ROW]
[ROW][C]2[/C][C]0.102476[/C][C]1.1729[/C][C]0.121483[/C][/ROW]
[ROW][C]3[/C][C]-0.12443[/C][C]-1.4242[/C][C]0.078388[/C][/ROW]
[ROW][C]4[/C][C]-0.082956[/C][C]-0.9495[/C][C]0.172063[/C][/ROW]
[ROW][C]5[/C][C]0.06021[/C][C]0.6891[/C][C]0.245979[/C][/ROW]
[ROW][C]6[/C][C]0.03732[/C][C]0.4272[/C][C]0.334985[/C][/ROW]
[ROW][C]7[/C][C]-0.091143[/C][C]-1.0432[/C][C]0.149393[/C][/ROW]
[ROW][C]8[/C][C]0.210039[/C][C]2.404[/C][C]0.008808[/C][/ROW]
[ROW][C]9[/C][C]-0.245355[/C][C]-2.8082[/C][C]0.002872[/C][/ROW]
[ROW][C]10[/C][C]0.173739[/C][C]1.9885[/C][C]0.024418[/C][/ROW]
[ROW][C]11[/C][C]-0.130342[/C][C]-1.4918[/C][C]0.069073[/C][/ROW]
[ROW][C]12[/C][C]0.1718[/C][C]1.9663[/C][C]0.025687[/C][/ROW]
[ROW][C]13[/C][C]-0.044009[/C][C]-0.5037[/C][C]0.307656[/C][/ROW]
[ROW][C]14[/C][C]-0.084706[/C][C]-0.9695[/C][C]0.167041[/C][/ROW]
[ROW][C]15[/C][C]0.041872[/C][C]0.4792[/C][C]0.316281[/C][/ROW]
[ROW][C]16[/C][C]0.017305[/C][C]0.1981[/C][C]0.421653[/C][/ROW]
[ROW][C]17[/C][C]-0.144717[/C][C]-1.6564[/C][C]0.050021[/C][/ROW]
[ROW][C]18[/C][C]0.248578[/C][C]2.8451[/C][C]0.002577[/C][/ROW]
[ROW][C]19[/C][C]-0.259091[/C][C]-2.9654[/C][C]0.001796[/C][/ROW]
[ROW][C]20[/C][C]0.216892[/C][C]2.4824[/C][C]0.007157[/C][/ROW]
[ROW][C]21[/C][C]-0.103943[/C][C]-1.1897[/C][C]0.118161[/C][/ROW]
[ROW][C]22[/C][C]-0.016608[/C][C]-0.1901[/C][C]0.424766[/C][/ROW]
[ROW][C]23[/C][C]0.059057[/C][C]0.6759[/C][C]0.250134[/C][/ROW]
[ROW][C]24[/C][C]-0.006139[/C][C]-0.0703[/C][C]0.472043[/C][/ROW]
[ROW][C]25[/C][C]-0.017324[/C][C]-0.1983[/C][C]0.421565[/C][/ROW]
[ROW][C]26[/C][C]-0.0428[/C][C]-0.4899[/C][C]0.312524[/C][/ROW]
[ROW][C]27[/C][C]-0.067865[/C][C]-0.7767[/C][C]0.219355[/C][/ROW]
[ROW][C]28[/C][C]0.185679[/C][C]2.1252[/C][C]0.017724[/C][/ROW]
[ROW][C]29[/C][C]-0.097159[/C][C]-1.112[/C][C]0.134079[/C][/ROW]
[ROW][C]30[/C][C]0.124956[/C][C]1.4302[/C][C]0.077522[/C][/ROW]
[ROW][C]31[/C][C]-0.178281[/C][C]-2.0405[/C][C]0.021654[/C][/ROW]
[ROW][C]32[/C][C]0.09723[/C][C]1.1128[/C][C]0.133906[/C][/ROW]
[ROW][C]33[/C][C]-0.116677[/C][C]-1.3354[/C][C]0.092027[/C][/ROW]
[ROW][C]34[/C][C]0.052734[/C][C]0.6036[/C][C]0.273587[/C][/ROW]
[ROW][C]35[/C][C]0.042055[/C][C]0.4813[/C][C]0.315539[/C][/ROW]
[ROW][C]36[/C][C]0.016803[/C][C]0.1923[/C][C]0.423895[/C][/ROW]
[ROW][C]37[/C][C]-0.04354[/C][C]-0.4983[/C][C]0.30954[/C][/ROW]
[ROW][C]38[/C][C]0.057122[/C][C]0.6538[/C][C]0.257197[/C][/ROW]
[ROW][C]39[/C][C]-0.083693[/C][C]-0.9579[/C][C]0.169937[/C][/ROW]
[ROW][C]40[/C][C]0.150648[/C][C]1.7242[/C][C]0.043511[/C][/ROW]
[ROW][C]41[/C][C]-0.194275[/C][C]-2.2236[/C][C]0.013945[/C][/ROW]
[ROW][C]42[/C][C]0.048413[/C][C]0.5541[/C][C]0.290224[/C][/ROW]
[ROW][C]43[/C][C]0.088233[/C][C]1.0099[/C][C]0.15721[/C][/ROW]
[ROW][C]44[/C][C]-0.111179[/C][C]-1.2725[/C][C]0.102725[/C][/ROW]
[ROW][C]45[/C][C]0.082071[/C][C]0.9393[/C][C]0.174642[/C][/ROW]
[ROW][C]46[/C][C]-0.049223[/C][C]-0.5634[/C][C]0.287069[/C][/ROW]
[ROW][C]47[/C][C]0.016605[/C][C]0.19[/C][C]0.424783[/C][/ROW]
[ROW][C]48[/C][C]0.077611[/C][C]0.8883[/C][C]0.188005[/C][/ROW]
[ROW][C]49[/C][C]-0.118013[/C][C]-1.3507[/C][C]0.089556[/C][/ROW]
[ROW][C]50[/C][C]0.103573[/C][C]1.1854[/C][C]0.118994[/C][/ROW]
[ROW][C]51[/C][C]-0.053625[/C][C]-0.6138[/C][C]0.270216[/C][/ROW]
[ROW][C]52[/C][C]0.037345[/C][C]0.4274[/C][C]0.334883[/C][/ROW]
[ROW][C]53[/C][C]-0.052861[/C][C]-0.605[/C][C]0.273106[/C][/ROW]
[ROW][C]54[/C][C]-0.03994[/C][C]-0.4571[/C][C]0.324164[/C][/ROW]
[ROW][C]55[/C][C]0.034703[/C][C]0.3972[/C][C]0.345934[/C][/ROW]
[ROW][C]56[/C][C]0.034929[/C][C]0.3998[/C][C]0.344984[/C][/ROW]
[ROW][C]57[/C][C]-0.002057[/C][C]-0.0235[/C][C]0.490624[/C][/ROW]
[ROW][C]58[/C][C]0.056302[/C][C]0.6444[/C][C]0.26022[/C][/ROW]
[ROW][C]59[/C][C]-0.102931[/C][C]-1.1781[/C][C]0.120447[/C][/ROW]
[ROW][C]60[/C][C]0.10219[/C][C]1.1696[/C][C]0.122139[/C][/ROW]
[/TABLE]
Source: https://freestatistics.org/blog/index.php?pk=42808&T=1

Globally Unique Identifier (entire table): ba.freestatistics.org/blog/index.php?pk=42808&T=1

As an alternative you can also use a QR Code:  

The GUIDs for individual cells are displayed in the table below:

Autocorrelation Function
Time lag kACF(k)T-STATP-value
1-0.478094-5.4720
20.1024761.17290.121483
3-0.12443-1.42420.078388
4-0.082956-0.94950.172063
50.060210.68910.245979
60.037320.42720.334985
7-0.091143-1.04320.149393
80.2100392.4040.008808
9-0.245355-2.80820.002872
100.1737391.98850.024418
11-0.130342-1.49180.069073
120.17181.96630.025687
13-0.044009-0.50370.307656
14-0.084706-0.96950.167041
150.0418720.47920.316281
160.0173050.19810.421653
17-0.144717-1.65640.050021
180.2485782.84510.002577
19-0.259091-2.96540.001796
200.2168922.48240.007157
21-0.103943-1.18970.118161
22-0.016608-0.19010.424766
230.0590570.67590.250134
24-0.006139-0.07030.472043
25-0.017324-0.19830.421565
26-0.0428-0.48990.312524
27-0.067865-0.77670.219355
280.1856792.12520.017724
29-0.097159-1.1120.134079
300.1249561.43020.077522
31-0.178281-2.04050.021654
320.097231.11280.133906
33-0.116677-1.33540.092027
340.0527340.60360.273587
350.0420550.48130.315539
360.0168030.19230.423895
37-0.04354-0.49830.30954
380.0571220.65380.257197
39-0.083693-0.95790.169937
400.1506481.72420.043511
41-0.194275-2.22360.013945
420.0484130.55410.290224
430.0882331.00990.15721
44-0.111179-1.27250.102725
450.0820710.93930.174642
46-0.049223-0.56340.287069
470.0166050.190.424783
480.0776110.88830.188005
49-0.118013-1.35070.089556
500.1035731.18540.118994
51-0.053625-0.61380.270216
520.0373450.42740.334883
53-0.052861-0.6050.273106
54-0.03994-0.45710.324164
550.0347030.39720.345934
560.0349290.39980.344984
57-0.002057-0.02350.490624
580.0563020.64440.26022
59-0.102931-1.17810.120447
600.102191.16960.122139


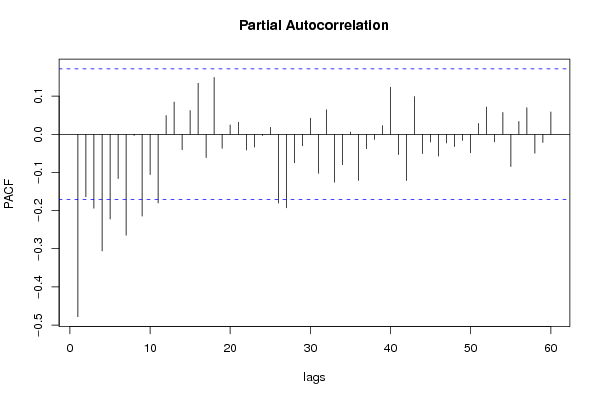
Partial Autocorrelation Function
Time lag kPACF(k)T-STATP-value
1-0.478094-5.4720
2-0.163461-1.87090.031795
3-0.193893-2.21920.014097
4-0.305859-3.50070.000317
5-0.22214-2.54250.006085
6-0.116142-1.32930.093028
7-0.264418-3.02640.00149
8-0.003068-0.03510.48602
9-0.214301-2.45280.007745
10-0.105654-1.20930.11437
11-0.180023-2.06050.020667
120.0490950.56190.287567
130.0845330.96750.167532
14-0.040525-0.46380.321769
150.0620970.71070.239256
160.1334541.52740.06453
17-0.061131-0.69970.242683
180.1490991.70650.045141
19-0.036865-0.42190.336881
200.0245420.28090.389615
210.0313720.35910.360062
22-0.041177-0.47130.319108
23-0.033554-0.3840.350783
24-0.003309-0.03790.484923
250.0180810.20690.418186
26-0.180384-2.06460.020468
27-0.192741-2.2060.014563
28-0.074676-0.85470.197137
29-0.03021-0.34580.365035
300.0421460.48240.315171
31-0.1022-1.16970.122117
320.0640280.73280.232485
33-0.125749-1.43930.076231
34-0.079673-0.91190.181749
350.0056890.06510.474091
36-0.121089-1.38590.084062
37-0.037837-0.43310.332839
38-0.013457-0.1540.438914
390.0227910.26090.397308
400.1233481.41180.080193
41-0.053331-0.61040.271329
42-0.12146-1.39020.083417
430.0987391.13010.130246
44-0.050451-0.57740.282319
45-0.01998-0.22870.409737
46-0.057198-0.65470.256916
47-0.022709-0.25990.397669
48-0.032358-0.37030.35586
49-0.016286-0.18640.426207
50-0.048644-0.55680.289323
510.0285060.32630.372373
520.0714830.81820.207375
53-0.019785-0.22640.410604
540.0571980.65470.256918
55-0.08454-0.96760.167512
560.033530.38380.350887
570.0695580.79610.213699
58-0.049725-0.56910.285121
59-0.021519-0.24630.402918
600.0585130.66970.252109

\begin{tabular}{lllllllll}
\hline
Partial Autocorrelation Function \tabularnewline
Time lag k & PACF(k) & T-STAT & P-value \tabularnewline
1 & -0.478094 & -5.472 & 0 \tabularnewline
2 & -0.163461 & -1.8709 & 0.031795 \tabularnewline
3 & -0.193893 & -2.2192 & 0.014097 \tabularnewline
4 & -0.305859 & -3.5007 & 0.000317 \tabularnewline
5 & -0.22214 & -2.5425 & 0.006085 \tabularnewline
6 & -0.116142 & -1.3293 & 0.093028 \tabularnewline
7 & -0.264418 & -3.0264 & 0.00149 \tabularnewline
8 & -0.003068 & -0.0351 & 0.48602 \tabularnewline
9 & -0.214301 & -2.4528 & 0.007745 \tabularnewline
10 & -0.105654 & -1.2093 & 0.11437 \tabularnewline
11 & -0.180023 & -2.0605 & 0.020667 \tabularnewline
12 & 0.049095 & 0.5619 & 0.287567 \tabularnewline
13 & 0.084533 & 0.9675 & 0.167532 \tabularnewline
14 & -0.040525 & -0.4638 & 0.321769 \tabularnewline
15 & 0.062097 & 0.7107 & 0.239256 \tabularnewline
16 & 0.133454 & 1.5274 & 0.06453 \tabularnewline
17 & -0.061131 & -0.6997 & 0.242683 \tabularnewline
18 & 0.149099 & 1.7065 & 0.045141 \tabularnewline
19 & -0.036865 & -0.4219 & 0.336881 \tabularnewline
20 & 0.024542 & 0.2809 & 0.389615 \tabularnewline
21 & 0.031372 & 0.3591 & 0.360062 \tabularnewline
22 & -0.041177 & -0.4713 & 0.319108 \tabularnewline
23 & -0.033554 & -0.384 & 0.350783 \tabularnewline
24 & -0.003309 & -0.0379 & 0.484923 \tabularnewline
25 & 0.018081 & 0.2069 & 0.418186 \tabularnewline
26 & -0.180384 & -2.0646 & 0.020468 \tabularnewline
27 & -0.192741 & -2.206 & 0.014563 \tabularnewline
28 & -0.074676 & -0.8547 & 0.197137 \tabularnewline
29 & -0.03021 & -0.3458 & 0.365035 \tabularnewline
30 & 0.042146 & 0.4824 & 0.315171 \tabularnewline
31 & -0.1022 & -1.1697 & 0.122117 \tabularnewline
32 & 0.064028 & 0.7328 & 0.232485 \tabularnewline
33 & -0.125749 & -1.4393 & 0.076231 \tabularnewline
34 & -0.079673 & -0.9119 & 0.181749 \tabularnewline
35 & 0.005689 & 0.0651 & 0.474091 \tabularnewline
36 & -0.121089 & -1.3859 & 0.084062 \tabularnewline
37 & -0.037837 & -0.4331 & 0.332839 \tabularnewline
38 & -0.013457 & -0.154 & 0.438914 \tabularnewline
39 & 0.022791 & 0.2609 & 0.397308 \tabularnewline
40 & 0.123348 & 1.4118 & 0.080193 \tabularnewline
41 & -0.053331 & -0.6104 & 0.271329 \tabularnewline
42 & -0.12146 & -1.3902 & 0.083417 \tabularnewline
43 & 0.098739 & 1.1301 & 0.130246 \tabularnewline
44 & -0.050451 & -0.5774 & 0.282319 \tabularnewline
45 & -0.01998 & -0.2287 & 0.409737 \tabularnewline
46 & -0.057198 & -0.6547 & 0.256916 \tabularnewline
47 & -0.022709 & -0.2599 & 0.397669 \tabularnewline
48 & -0.032358 & -0.3703 & 0.35586 \tabularnewline
49 & -0.016286 & -0.1864 & 0.426207 \tabularnewline
50 & -0.048644 & -0.5568 & 0.289323 \tabularnewline
51 & 0.028506 & 0.3263 & 0.372373 \tabularnewline
52 & 0.071483 & 0.8182 & 0.207375 \tabularnewline
53 & -0.019785 & -0.2264 & 0.410604 \tabularnewline
54 & 0.057198 & 0.6547 & 0.256918 \tabularnewline
55 & -0.08454 & -0.9676 & 0.167512 \tabularnewline
56 & 0.03353 & 0.3838 & 0.350887 \tabularnewline
57 & 0.069558 & 0.7961 & 0.213699 \tabularnewline
58 & -0.049725 & -0.5691 & 0.285121 \tabularnewline
59 & -0.021519 & -0.2463 & 0.402918 \tabularnewline
60 & 0.058513 & 0.6697 & 0.252109 \tabularnewline
\hline
\end{tabular}
%Source: https://freestatistics.org/blog/index.php?pk=42808&T=2

[TABLE]
[ROW][C]Partial Autocorrelation Function[/C][/ROW]
[ROW][C]Time lag k[/C][C]PACF(k)[/C][C]T-STAT[/C][C]P-value[/C][/ROW]
[ROW][C]1[/C][C]-0.478094[/C][C]-5.472[/C][C]0[/C][/ROW]
[ROW][C]2[/C][C]-0.163461[/C][C]-1.8709[/C][C]0.031795[/C][/ROW]
[ROW][C]3[/C][C]-0.193893[/C][C]-2.2192[/C][C]0.014097[/C][/ROW]
[ROW][C]4[/C][C]-0.305859[/C][C]-3.5007[/C][C]0.000317[/C][/ROW]
[ROW][C]5[/C][C]-0.22214[/C][C]-2.5425[/C][C]0.006085[/C][/ROW]
[ROW][C]6[/C][C]-0.116142[/C][C]-1.3293[/C][C]0.093028[/C][/ROW]
[ROW][C]7[/C][C]-0.264418[/C][C]-3.0264[/C][C]0.00149[/C][/ROW]
[ROW][C]8[/C][C]-0.003068[/C][C]-0.0351[/C][C]0.48602[/C][/ROW]
[ROW][C]9[/C][C]-0.214301[/C][C]-2.4528[/C][C]0.007745[/C][/ROW]
[ROW][C]10[/C][C]-0.105654[/C][C]-1.2093[/C][C]0.11437[/C][/ROW]
[ROW][C]11[/C][C]-0.180023[/C][C]-2.0605[/C][C]0.020667[/C][/ROW]
[ROW][C]12[/C][C]0.049095[/C][C]0.5619[/C][C]0.287567[/C][/ROW]
[ROW][C]13[/C][C]0.084533[/C][C]0.9675[/C][C]0.167532[/C][/ROW]
[ROW][C]14[/C][C]-0.040525[/C][C]-0.4638[/C][C]0.321769[/C][/ROW]
[ROW][C]15[/C][C]0.062097[/C][C]0.7107[/C][C]0.239256[/C][/ROW]
[ROW][C]16[/C][C]0.133454[/C][C]1.5274[/C][C]0.06453[/C][/ROW]
[ROW][C]17[/C][C]-0.061131[/C][C]-0.6997[/C][C]0.242683[/C][/ROW]
[ROW][C]18[/C][C]0.149099[/C][C]1.7065[/C][C]0.045141[/C][/ROW]
[ROW][C]19[/C][C]-0.036865[/C][C]-0.4219[/C][C]0.336881[/C][/ROW]
[ROW][C]20[/C][C]0.024542[/C][C]0.2809[/C][C]0.389615[/C][/ROW]
[ROW][C]21[/C][C]0.031372[/C][C]0.3591[/C][C]0.360062[/C][/ROW]
[ROW][C]22[/C][C]-0.041177[/C][C]-0.4713[/C][C]0.319108[/C][/ROW]
[ROW][C]23[/C][C]-0.033554[/C][C]-0.384[/C][C]0.350783[/C][/ROW]
[ROW][C]24[/C][C]-0.003309[/C][C]-0.0379[/C][C]0.484923[/C][/ROW]
[ROW][C]25[/C][C]0.018081[/C][C]0.2069[/C][C]0.418186[/C][/ROW]
[ROW][C]26[/C][C]-0.180384[/C][C]-2.0646[/C][C]0.020468[/C][/ROW]
[ROW][C]27[/C][C]-0.192741[/C][C]-2.206[/C][C]0.014563[/C][/ROW]
[ROW][C]28[/C][C]-0.074676[/C][C]-0.8547[/C][C]0.197137[/C][/ROW]
[ROW][C]29[/C][C]-0.03021[/C][C]-0.3458[/C][C]0.365035[/C][/ROW]
[ROW][C]30[/C][C]0.042146[/C][C]0.4824[/C][C]0.315171[/C][/ROW]
[ROW][C]31[/C][C]-0.1022[/C][C]-1.1697[/C][C]0.122117[/C][/ROW]
[ROW][C]32[/C][C]0.064028[/C][C]0.7328[/C][C]0.232485[/C][/ROW]
[ROW][C]33[/C][C]-0.125749[/C][C]-1.4393[/C][C]0.076231[/C][/ROW]
[ROW][C]34[/C][C]-0.079673[/C][C]-0.9119[/C][C]0.181749[/C][/ROW]
[ROW][C]35[/C][C]0.005689[/C][C]0.0651[/C][C]0.474091[/C][/ROW]
[ROW][C]36[/C][C]-0.121089[/C][C]-1.3859[/C][C]0.084062[/C][/ROW]
[ROW][C]37[/C][C]-0.037837[/C][C]-0.4331[/C][C]0.332839[/C][/ROW]
[ROW][C]38[/C][C]-0.013457[/C][C]-0.154[/C][C]0.438914[/C][/ROW]
[ROW][C]39[/C][C]0.022791[/C][C]0.2609[/C][C]0.397308[/C][/ROW]
[ROW][C]40[/C][C]0.123348[/C][C]1.4118[/C][C]0.080193[/C][/ROW]
[ROW][C]41[/C][C]-0.053331[/C][C]-0.6104[/C][C]0.271329[/C][/ROW]
[ROW][C]42[/C][C]-0.12146[/C][C]-1.3902[/C][C]0.083417[/C][/ROW]
[ROW][C]43[/C][C]0.098739[/C][C]1.1301[/C][C]0.130246[/C][/ROW]
[ROW][C]44[/C][C]-0.050451[/C][C]-0.5774[/C][C]0.282319[/C][/ROW]
[ROW][C]45[/C][C]-0.01998[/C][C]-0.2287[/C][C]0.409737[/C][/ROW]
[ROW][C]46[/C][C]-0.057198[/C][C]-0.6547[/C][C]0.256916[/C][/ROW]
[ROW][C]47[/C][C]-0.022709[/C][C]-0.2599[/C][C]0.397669[/C][/ROW]
[ROW][C]48[/C][C]-0.032358[/C][C]-0.3703[/C][C]0.35586[/C][/ROW]
[ROW][C]49[/C][C]-0.016286[/C][C]-0.1864[/C][C]0.426207[/C][/ROW]
[ROW][C]50[/C][C]-0.048644[/C][C]-0.5568[/C][C]0.289323[/C][/ROW]
[ROW][C]51[/C][C]0.028506[/C][C]0.3263[/C][C]0.372373[/C][/ROW]
[ROW][C]52[/C][C]0.071483[/C][C]0.8182[/C][C]0.207375[/C][/ROW]
[ROW][C]53[/C][C]-0.019785[/C][C]-0.2264[/C][C]0.410604[/C][/ROW]
[ROW][C]54[/C][C]0.057198[/C][C]0.6547[/C][C]0.256918[/C][/ROW]
[ROW][C]55[/C][C]-0.08454[/C][C]-0.9676[/C][C]0.167512[/C][/ROW]
[ROW][C]56[/C][C]0.03353[/C][C]0.3838[/C][C]0.350887[/C][/ROW]
[ROW][C]57[/C][C]0.069558[/C][C]0.7961[/C][C]0.213699[/C][/ROW]
[ROW][C]58[/C][C]-0.049725[/C][C]-0.5691[/C][C]0.285121[/C][/ROW]
[ROW][C]59[/C][C]-0.021519[/C][C]-0.2463[/C][C]0.402918[/C][/ROW]
[ROW][C]60[/C][C]0.058513[/C][C]0.6697[/C][C]0.252109[/C][/ROW]
[/TABLE]
Source: https://freestatistics.org/blog/index.php?pk=42808&T=2

Globally Unique Identifier (entire table): ba.freestatistics.org/blog/index.php?pk=42808&T=2

As an alternative you can also use a QR Code:  

The GUIDs for individual cells are displayed in the table below:

Partial Autocorrelation Function
Time lag kPACF(k)T-STATP-value
1-0.478094-5.4720
2-0.163461-1.87090.031795
3-0.193893-2.21920.014097
4-0.305859-3.50070.000317
5-0.22214-2.54250.006085
6-0.116142-1.32930.093028
7-0.264418-3.02640.00149
8-0.003068-0.03510.48602
9-0.214301-2.45280.007745
10-0.105654-1.20930.11437
11-0.180023-2.06050.020667
120.0490950.56190.287567
130.0845330.96750.167532
14-0.040525-0.46380.321769
150.0620970.71070.239256
160.1334541.52740.06453
17-0.061131-0.69970.242683
180.1490991.70650.045141
19-0.036865-0.42190.336881
200.0245420.28090.389615
210.0313720.35910.360062
22-0.041177-0.47130.319108
23-0.033554-0.3840.350783
24-0.003309-0.03790.484923
250.0180810.20690.418186
26-0.180384-2.06460.020468
27-0.192741-2.2060.014563
28-0.074676-0.85470.197137
29-0.03021-0.34580.365035
300.0421460.48240.315171
31-0.1022-1.16970.122117
320.0640280.73280.232485
33-0.125749-1.43930.076231
34-0.079673-0.91190.181749
350.0056890.06510.474091
36-0.121089-1.38590.084062
37-0.037837-0.43310.332839
38-0.013457-0.1540.438914
390.0227910.26090.397308
400.1233481.41180.080193
41-0.053331-0.61040.271329
42-0.12146-1.39020.083417
430.0987391.13010.130246
44-0.050451-0.57740.282319
45-0.01998-0.22870.409737
46-0.057198-0.65470.256916
47-0.022709-0.25990.397669
48-0.032358-0.37030.35586
49-0.016286-0.18640.426207
50-0.048644-0.55680.289323
510.0285060.32630.372373
520.0714830.81820.207375
53-0.019785-0.22640.410604
540.0571980.65470.256918
55-0.08454-0.96760.167512
560.033530.38380.350887
570.0695580.79610.213699
58-0.049725-0.56910.285121
59-0.021519-0.24630.402918
600.0585130.66970.252109


Parameters (Session):
par1 = 60 ; par2 = 1 ; par3 = 1 ; par4 = 0 ; par5 = 12 ;
Parameters (R input):
par1 = 60 ; par2 = 1 ; par3 = 1 ; par4 = 0 ; par5 = 12 ;
R code (references can be found in the software module):
if (par1 == 'Default') {
par1 = 10*log10(length(x))
} else {
par1 <- as.numeric(par1)
}
par2 <- as.numeric(par2)
par3 <- as.numeric(par3)
par4 <- as.numeric(par4)
par5 <- as.numeric(par5)
if (par2 == 0) {
x <- log(x)
} else {
x <- (x ^ par2 - 1) / par2
}
if (par3 > 0) x <- diff(x,lag=1,difference=par3)
if (par4 > 0) x <- diff(x,lag=par5,difference=par4)
bitmap(file='pic1.png')
racf <- acf(x,par1,main='Autocorrelation',xlab='lags',ylab='ACF')
dev.off()
bitmap(file='pic2.png')
rpacf <- pacf(x,par1,main='Partial Autocorrelation',xlab='lags',ylab='PACF')
dev.off()
(myacf <- c(racf$acf))
(mypacf <- c(rpacf$acf))
lengthx <- length(x)
sqrtn <- sqrt(lengthx)
load(file='createtable')
a<-table.start()
a<-table.row.start(a)
a<-table.element(a,'Autocorrelation Function',4,TRUE)
a<-table.row.end(a)
a<-table.row.start(a)
a<-table.element(a,'Time lag k',header=TRUE)
a<-table.element(a,hyperlink('basics.htm','ACF(k)','click here for more information about the Autocorrelation Function'),header=TRUE)
a<-table.element(a,'T-STAT',header=TRUE)
a<-table.element(a,'P-value',header=TRUE)
a<-table.row.end(a)
for (i in 2:(par1+1)) {
a<-table.row.start(a)
a<-table.element(a,i-1,header=TRUE)
a<-table.element(a,round(myacf[i],6))
mytstat <- myacf[i]*sqrtn
a<-table.element(a,round(mytstat,4))
a<-table.element(a,round(1-pt(abs(mytstat),lengthx),6))
a<-table.row.end(a)
}
a<-table.end(a)
table.save(a,file='mytable.tab')
a<-table.start()
a<-table.row.start(a)
a<-table.element(a,'Partial Autocorrelation Function',4,TRUE)
a<-table.row.end(a)
a<-table.row.start(a)
a<-table.element(a,'Time lag k',header=TRUE)
a<-table.element(a,hyperlink('basics.htm','PACF(k)','click here for more information about the Partial Autocorrelation Function'),header=TRUE)
a<-table.element(a,'T-STAT',header=TRUE)
a<-table.element(a,'P-value',header=TRUE)
a<-table.row.end(a)
for (i in 1:par1) {
a<-table.row.start(a)
a<-table.element(a,i,header=TRUE)
a<-table.element(a,round(mypacf[i],6))
mytstat <- mypacf[i]*sqrtn
a<-table.element(a,round(mytstat,4))
a<-table.element(a,round(1-pt(abs(mytstat),lengthx),6))
a<-table.row.end(a)
}
a<-table.end(a)
table.save(a,file='mytable1.tab')