Free Statistics

of Irreproducible Research!

Author's title

Author*Unverified author*
R Software Modulerwasp_autocorrelation.wasp
Title produced by software(Partial) Autocorrelation Function
Date of computationTue, 18 Aug 2009 07:09:39 -0600
Cite this page as followsStatistical Computations at FreeStatistics.org, Office for Research Development and Education, URL https://freestatistics.org/blog/index.php?v=date/2009/Aug/18/t125060104334eqlam4hdgjbsx.htm/, Retrieved Tue, 07 May 2024 02:30:43 +0000
Statistical Computations at FreeStatistics.org, Office for Research Development and Education, URL https://freestatistics.org/blog/index.php?pk=42807, Retrieved Tue, 07 May 2024 02:30:43 +0000
QR Codes:

Original text written by user:
IsPrivate?No (this computation is public)
User-defined keywords
Estimated Impact195
Family? (F = Feedback message, R = changed R code, M = changed R Module, P = changed Parameters, D = changed Data)
-     [Univariate Data Series] [grafiek opdracht ...] [2009-04-24 14:37:54] [74be16979710d4c4e7c6647856088456]
-       [Univariate Data Series] [grafiek opdracht6...] [2009-04-24 15:28:36] [74be16979710d4c4e7c6647856088456]
- RMPD      [(Partial) Autocorrelation Function] [GuyVanHasseltPart...] [2009-08-18 13:09:39] [0d1085ed835696cdd537ad5fa07600ec] [Current]
Feedback Forum

Post a new message
Dataseries X:
0.8800
1.0300
0.6900
0.7100
1.1100
1.0500
1.0300
0.6500
0.5900
0.7700
0.9000
1.2600
0.9600
0.8300
0.8700
0.7900
1.1200
0.8800
0.6400
0.6400
0.5800
0.5000
0.9900
1.0700
0.8900
0.8900
0.8300
0.8600
0.9000
1.1200
0.8800
0.8800
0.8900
0.8200
0.8800
0.8100
0.8800
0.7600
1.1300
0.8500
1.4500
1.5500
0.7100
0.8100
0.8300
0.7300
0.9000
0.9400
1.7800
0.8800
1.0400
0.8300
1.4100
0.9600
1.3000
0.8300
1.4000
0.9100
0.8700
0.9700
1.1900
1.2300
1.3300
1.1700
1.0900
0.6300
0.8900
0.6300
1.5100
0.9700
0.8400
0.9200
0.9500
0.7300
1.0200
0.7900
1.2700
0.9500
0.7500
0.5200
0.9500
0.8200
0.7600
1.2400
0.9400
1.0400
1.8100
0.9500
1.3900
0.8600
1.1500
1.5100
0.6000
0.7200
1.1000
1.6200
1.8400
1.7300
1.3600
1.0700
1.0000
1.4900
0.9000
1.4300
1.5400
0.8100
1.6100
1.3000
1.4000
1.0300
0.7900
1.1100
1.1500
1.0300
1.5900
1.1100
1.3300
0.9300
1.0700
1.1400
1.1200
0.8600
0.8200
1.0200
1.0700
1.3100
0.9800
0.8900
0.8000
0.8000
0.7800
0.9700


Summary of computational transaction
Raw Inputview raw input (R code)
Raw Outputview raw output of R engine
Computing time5 seconds
R Server'George Udny Yule' @ 72.249.76.132

\begin{tabular}{lllllllll}
\hline
Summary of computational transaction \tabularnewline
Raw Input & view raw input (R code)  \tabularnewline
Raw Output & view raw output of R engine  \tabularnewline
Computing time & 5 seconds \tabularnewline
R Server & 'George Udny Yule' @ 72.249.76.132 \tabularnewline
\hline
\end{tabular}
%Source: https://freestatistics.org/blog/index.php?pk=42807&T=0

[TABLE]
[ROW][C]Summary of computational transaction[/C][/ROW]
[ROW][C]Raw Input[/C][C]view raw input (R code) [/C][/ROW]
[ROW][C]Raw Output[/C][C]view raw output of R engine [/C][/ROW]
[ROW][C]Computing time[/C][C]5 seconds[/C][/ROW]
[ROW][C]R Server[/C][C]'George Udny Yule' @ 72.249.76.132[/C][/ROW]
[/TABLE]
Source: https://freestatistics.org/blog/index.php?pk=42807&T=0

Globally Unique Identifier (entire table): ba.freestatistics.org/blog/index.php?pk=42807&T=0

As an alternative you can also use a QR Code:  

The GUIDs for individual cells are displayed in the table below:

Summary of computational transaction
Raw Inputview raw input (R code)
Raw Outputview raw output of R engine
Computing time5 seconds
R Server'George Udny Yule' @ 72.249.76.132


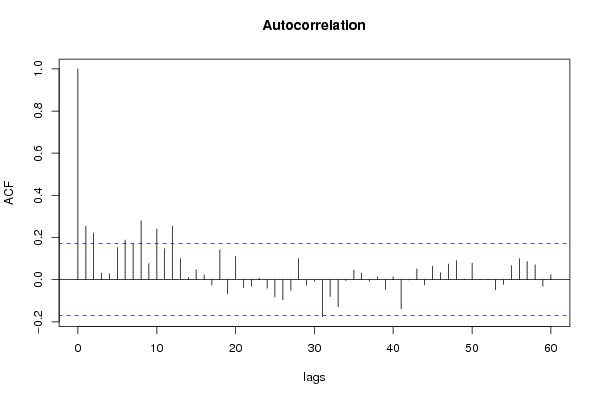
Autocorrelation Function
Time lag kACF(k)T-STATP-value
10.253552.91310.002102
20.2210612.53980.006125
30.0314870.36180.359054
40.0276860.31810.375459
50.1531141.75910.040435
60.1883872.16440.016117
70.1691471.94330.027051
80.2798593.21530.000819
90.0763960.87770.190843
100.240212.75980.003303
110.1468291.68690.046989
120.2535332.91290.002103
130.1003011.15240.125626
140.0106990.12290.451179
150.0473030.54350.29386
160.0221180.25410.3999
17-0.02556-0.29370.384737
180.1414421.6250.053269
19-0.06768-0.77760.219102
200.1099721.26350.104321
21-0.036732-0.4220.336848
22-0.030874-0.35470.361685
230.007070.08120.467692
24-0.040455-0.46480.321423
25-0.081596-0.93750.175116
26-0.095634-1.09870.136939
27-0.050041-0.57490.28316
280.1001891.15110.12589
29-0.026415-0.30350.381
30-0.007573-0.0870.4654
31-0.17565-2.01810.022806
32-0.080012-0.91930.179815
33-0.128928-1.48130.070459
34-0.003583-0.04120.483611
350.0454290.52190.301295
360.0312370.35890.360126
37-0.008095-0.0930.463023
380.0137060.15750.437558
39-0.046496-0.53420.297051
400.0139870.16070.43629
41-0.13855-1.59180.056909
42-0.001652-0.0190.492443
430.051010.58610.279419
44-0.024375-0.280.389941
450.0643760.73960.230419
460.033070.37990.352299
470.0740460.85070.198232
480.0903511.03810.150571
490.0030590.03510.486008
500.0781030.89730.185588
510.0010490.0120.495202
520.0017910.02060.491806
53-0.047463-0.54530.293232
54-0.022699-0.26080.397328
550.0668610.76820.221877
560.0999671.14850.126413
570.0863180.99170.161575
580.0704040.80890.210019
59-0.031199-0.35840.360291
600.0228880.2630.396493

\begin{tabular}{lllllllll}
\hline
Autocorrelation Function \tabularnewline
Time lag k & ACF(k) & T-STAT & P-value \tabularnewline
1 & 0.25355 & 2.9131 & 0.002102 \tabularnewline
2 & 0.221061 & 2.5398 & 0.006125 \tabularnewline
3 & 0.031487 & 0.3618 & 0.359054 \tabularnewline
4 & 0.027686 & 0.3181 & 0.375459 \tabularnewline
5 & 0.153114 & 1.7591 & 0.040435 \tabularnewline
6 & 0.188387 & 2.1644 & 0.016117 \tabularnewline
7 & 0.169147 & 1.9433 & 0.027051 \tabularnewline
8 & 0.279859 & 3.2153 & 0.000819 \tabularnewline
9 & 0.076396 & 0.8777 & 0.190843 \tabularnewline
10 & 0.24021 & 2.7598 & 0.003303 \tabularnewline
11 & 0.146829 & 1.6869 & 0.046989 \tabularnewline
12 & 0.253533 & 2.9129 & 0.002103 \tabularnewline
13 & 0.100301 & 1.1524 & 0.125626 \tabularnewline
14 & 0.010699 & 0.1229 & 0.451179 \tabularnewline
15 & 0.047303 & 0.5435 & 0.29386 \tabularnewline
16 & 0.022118 & 0.2541 & 0.3999 \tabularnewline
17 & -0.02556 & -0.2937 & 0.384737 \tabularnewline
18 & 0.141442 & 1.625 & 0.053269 \tabularnewline
19 & -0.06768 & -0.7776 & 0.219102 \tabularnewline
20 & 0.109972 & 1.2635 & 0.104321 \tabularnewline
21 & -0.036732 & -0.422 & 0.336848 \tabularnewline
22 & -0.030874 & -0.3547 & 0.361685 \tabularnewline
23 & 0.00707 & 0.0812 & 0.467692 \tabularnewline
24 & -0.040455 & -0.4648 & 0.321423 \tabularnewline
25 & -0.081596 & -0.9375 & 0.175116 \tabularnewline
26 & -0.095634 & -1.0987 & 0.136939 \tabularnewline
27 & -0.050041 & -0.5749 & 0.28316 \tabularnewline
28 & 0.100189 & 1.1511 & 0.12589 \tabularnewline
29 & -0.026415 & -0.3035 & 0.381 \tabularnewline
30 & -0.007573 & -0.087 & 0.4654 \tabularnewline
31 & -0.17565 & -2.0181 & 0.022806 \tabularnewline
32 & -0.080012 & -0.9193 & 0.179815 \tabularnewline
33 & -0.128928 & -1.4813 & 0.070459 \tabularnewline
34 & -0.003583 & -0.0412 & 0.483611 \tabularnewline
35 & 0.045429 & 0.5219 & 0.301295 \tabularnewline
36 & 0.031237 & 0.3589 & 0.360126 \tabularnewline
37 & -0.008095 & -0.093 & 0.463023 \tabularnewline
38 & 0.013706 & 0.1575 & 0.437558 \tabularnewline
39 & -0.046496 & -0.5342 & 0.297051 \tabularnewline
40 & 0.013987 & 0.1607 & 0.43629 \tabularnewline
41 & -0.13855 & -1.5918 & 0.056909 \tabularnewline
42 & -0.001652 & -0.019 & 0.492443 \tabularnewline
43 & 0.05101 & 0.5861 & 0.279419 \tabularnewline
44 & -0.024375 & -0.28 & 0.389941 \tabularnewline
45 & 0.064376 & 0.7396 & 0.230419 \tabularnewline
46 & 0.03307 & 0.3799 & 0.352299 \tabularnewline
47 & 0.074046 & 0.8507 & 0.198232 \tabularnewline
48 & 0.090351 & 1.0381 & 0.150571 \tabularnewline
49 & 0.003059 & 0.0351 & 0.486008 \tabularnewline
50 & 0.078103 & 0.8973 & 0.185588 \tabularnewline
51 & 0.001049 & 0.012 & 0.495202 \tabularnewline
52 & 0.001791 & 0.0206 & 0.491806 \tabularnewline
53 & -0.047463 & -0.5453 & 0.293232 \tabularnewline
54 & -0.022699 & -0.2608 & 0.397328 \tabularnewline
55 & 0.066861 & 0.7682 & 0.221877 \tabularnewline
56 & 0.099967 & 1.1485 & 0.126413 \tabularnewline
57 & 0.086318 & 0.9917 & 0.161575 \tabularnewline
58 & 0.070404 & 0.8089 & 0.210019 \tabularnewline
59 & -0.031199 & -0.3584 & 0.360291 \tabularnewline
60 & 0.022888 & 0.263 & 0.396493 \tabularnewline
\hline
\end{tabular}
%Source: https://freestatistics.org/blog/index.php?pk=42807&T=1

[TABLE]
[ROW][C]Autocorrelation Function[/C][/ROW]
[ROW][C]Time lag k[/C][C]ACF(k)[/C][C]T-STAT[/C][C]P-value[/C][/ROW]
[ROW][C]1[/C][C]0.25355[/C][C]2.9131[/C][C]0.002102[/C][/ROW]
[ROW][C]2[/C][C]0.221061[/C][C]2.5398[/C][C]0.006125[/C][/ROW]
[ROW][C]3[/C][C]0.031487[/C][C]0.3618[/C][C]0.359054[/C][/ROW]
[ROW][C]4[/C][C]0.027686[/C][C]0.3181[/C][C]0.375459[/C][/ROW]
[ROW][C]5[/C][C]0.153114[/C][C]1.7591[/C][C]0.040435[/C][/ROW]
[ROW][C]6[/C][C]0.188387[/C][C]2.1644[/C][C]0.016117[/C][/ROW]
[ROW][C]7[/C][C]0.169147[/C][C]1.9433[/C][C]0.027051[/C][/ROW]
[ROW][C]8[/C][C]0.279859[/C][C]3.2153[/C][C]0.000819[/C][/ROW]
[ROW][C]9[/C][C]0.076396[/C][C]0.8777[/C][C]0.190843[/C][/ROW]
[ROW][C]10[/C][C]0.24021[/C][C]2.7598[/C][C]0.003303[/C][/ROW]
[ROW][C]11[/C][C]0.146829[/C][C]1.6869[/C][C]0.046989[/C][/ROW]
[ROW][C]12[/C][C]0.253533[/C][C]2.9129[/C][C]0.002103[/C][/ROW]
[ROW][C]13[/C][C]0.100301[/C][C]1.1524[/C][C]0.125626[/C][/ROW]
[ROW][C]14[/C][C]0.010699[/C][C]0.1229[/C][C]0.451179[/C][/ROW]
[ROW][C]15[/C][C]0.047303[/C][C]0.5435[/C][C]0.29386[/C][/ROW]
[ROW][C]16[/C][C]0.022118[/C][C]0.2541[/C][C]0.3999[/C][/ROW]
[ROW][C]17[/C][C]-0.02556[/C][C]-0.2937[/C][C]0.384737[/C][/ROW]
[ROW][C]18[/C][C]0.141442[/C][C]1.625[/C][C]0.053269[/C][/ROW]
[ROW][C]19[/C][C]-0.06768[/C][C]-0.7776[/C][C]0.219102[/C][/ROW]
[ROW][C]20[/C][C]0.109972[/C][C]1.2635[/C][C]0.104321[/C][/ROW]
[ROW][C]21[/C][C]-0.036732[/C][C]-0.422[/C][C]0.336848[/C][/ROW]
[ROW][C]22[/C][C]-0.030874[/C][C]-0.3547[/C][C]0.361685[/C][/ROW]
[ROW][C]23[/C][C]0.00707[/C][C]0.0812[/C][C]0.467692[/C][/ROW]
[ROW][C]24[/C][C]-0.040455[/C][C]-0.4648[/C][C]0.321423[/C][/ROW]
[ROW][C]25[/C][C]-0.081596[/C][C]-0.9375[/C][C]0.175116[/C][/ROW]
[ROW][C]26[/C][C]-0.095634[/C][C]-1.0987[/C][C]0.136939[/C][/ROW]
[ROW][C]27[/C][C]-0.050041[/C][C]-0.5749[/C][C]0.28316[/C][/ROW]
[ROW][C]28[/C][C]0.100189[/C][C]1.1511[/C][C]0.12589[/C][/ROW]
[ROW][C]29[/C][C]-0.026415[/C][C]-0.3035[/C][C]0.381[/C][/ROW]
[ROW][C]30[/C][C]-0.007573[/C][C]-0.087[/C][C]0.4654[/C][/ROW]
[ROW][C]31[/C][C]-0.17565[/C][C]-2.0181[/C][C]0.022806[/C][/ROW]
[ROW][C]32[/C][C]-0.080012[/C][C]-0.9193[/C][C]0.179815[/C][/ROW]
[ROW][C]33[/C][C]-0.128928[/C][C]-1.4813[/C][C]0.070459[/C][/ROW]
[ROW][C]34[/C][C]-0.003583[/C][C]-0.0412[/C][C]0.483611[/C][/ROW]
[ROW][C]35[/C][C]0.045429[/C][C]0.5219[/C][C]0.301295[/C][/ROW]
[ROW][C]36[/C][C]0.031237[/C][C]0.3589[/C][C]0.360126[/C][/ROW]
[ROW][C]37[/C][C]-0.008095[/C][C]-0.093[/C][C]0.463023[/C][/ROW]
[ROW][C]38[/C][C]0.013706[/C][C]0.1575[/C][C]0.437558[/C][/ROW]
[ROW][C]39[/C][C]-0.046496[/C][C]-0.5342[/C][C]0.297051[/C][/ROW]
[ROW][C]40[/C][C]0.013987[/C][C]0.1607[/C][C]0.43629[/C][/ROW]
[ROW][C]41[/C][C]-0.13855[/C][C]-1.5918[/C][C]0.056909[/C][/ROW]
[ROW][C]42[/C][C]-0.001652[/C][C]-0.019[/C][C]0.492443[/C][/ROW]
[ROW][C]43[/C][C]0.05101[/C][C]0.5861[/C][C]0.279419[/C][/ROW]
[ROW][C]44[/C][C]-0.024375[/C][C]-0.28[/C][C]0.389941[/C][/ROW]
[ROW][C]45[/C][C]0.064376[/C][C]0.7396[/C][C]0.230419[/C][/ROW]
[ROW][C]46[/C][C]0.03307[/C][C]0.3799[/C][C]0.352299[/C][/ROW]
[ROW][C]47[/C][C]0.074046[/C][C]0.8507[/C][C]0.198232[/C][/ROW]
[ROW][C]48[/C][C]0.090351[/C][C]1.0381[/C][C]0.150571[/C][/ROW]
[ROW][C]49[/C][C]0.003059[/C][C]0.0351[/C][C]0.486008[/C][/ROW]
[ROW][C]50[/C][C]0.078103[/C][C]0.8973[/C][C]0.185588[/C][/ROW]
[ROW][C]51[/C][C]0.001049[/C][C]0.012[/C][C]0.495202[/C][/ROW]
[ROW][C]52[/C][C]0.001791[/C][C]0.0206[/C][C]0.491806[/C][/ROW]
[ROW][C]53[/C][C]-0.047463[/C][C]-0.5453[/C][C]0.293232[/C][/ROW]
[ROW][C]54[/C][C]-0.022699[/C][C]-0.2608[/C][C]0.397328[/C][/ROW]
[ROW][C]55[/C][C]0.066861[/C][C]0.7682[/C][C]0.221877[/C][/ROW]
[ROW][C]56[/C][C]0.099967[/C][C]1.1485[/C][C]0.126413[/C][/ROW]
[ROW][C]57[/C][C]0.086318[/C][C]0.9917[/C][C]0.161575[/C][/ROW]
[ROW][C]58[/C][C]0.070404[/C][C]0.8089[/C][C]0.210019[/C][/ROW]
[ROW][C]59[/C][C]-0.031199[/C][C]-0.3584[/C][C]0.360291[/C][/ROW]
[ROW][C]60[/C][C]0.022888[/C][C]0.263[/C][C]0.396493[/C][/ROW]
[/TABLE]
Source: https://freestatistics.org/blog/index.php?pk=42807&T=1

Globally Unique Identifier (entire table): ba.freestatistics.org/blog/index.php?pk=42807&T=1

As an alternative you can also use a QR Code:  

The GUIDs for individual cells are displayed in the table below:

Autocorrelation Function
Time lag kACF(k)T-STATP-value
10.253552.91310.002102
20.2210612.53980.006125
30.0314870.36180.359054
40.0276860.31810.375459
50.1531141.75910.040435
60.1883872.16440.016117
70.1691471.94330.027051
80.2798593.21530.000819
90.0763960.87770.190843
100.240212.75980.003303
110.1468291.68690.046989
120.2535332.91290.002103
130.1003011.15240.125626
140.0106990.12290.451179
150.0473030.54350.29386
160.0221180.25410.3999
17-0.02556-0.29370.384737
180.1414421.6250.053269
19-0.06768-0.77760.219102
200.1099721.26350.104321
21-0.036732-0.4220.336848
22-0.030874-0.35470.361685
230.007070.08120.467692
24-0.040455-0.46480.321423
25-0.081596-0.93750.175116
26-0.095634-1.09870.136939
27-0.050041-0.57490.28316
280.1001891.15110.12589
29-0.026415-0.30350.381
30-0.007573-0.0870.4654
31-0.17565-2.01810.022806
32-0.080012-0.91930.179815
33-0.128928-1.48130.070459
34-0.003583-0.04120.483611
350.0454290.52190.301295
360.0312370.35890.360126
37-0.008095-0.0930.463023
380.0137060.15750.437558
39-0.046496-0.53420.297051
400.0139870.16070.43629
41-0.13855-1.59180.056909
42-0.001652-0.0190.492443
430.051010.58610.279419
44-0.024375-0.280.389941
450.0643760.73960.230419
460.033070.37990.352299
470.0740460.85070.198232
480.0903511.03810.150571
490.0030590.03510.486008
500.0781030.89730.185588
510.0010490.0120.495202
520.0017910.02060.491806
53-0.047463-0.54530.293232
54-0.022699-0.26080.397328
550.0668610.76820.221877
560.0999671.14850.126413
570.0863180.99170.161575
580.0704040.80890.210019
59-0.031199-0.35840.360291
600.0228880.2630.396493


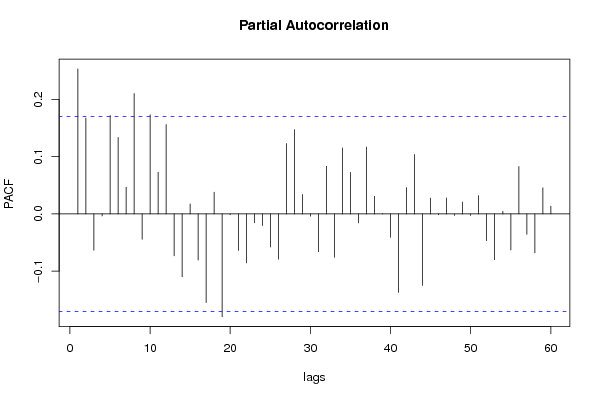
Partial Autocorrelation Function
Time lag kPACF(k)T-STATP-value
10.253552.91310.002102
20.1675451.92490.028194
3-0.063394-0.72830.233849
4-0.003551-0.04080.48376
50.1722331.97880.024959
60.1337581.53680.063372
70.0466850.53640.296305
80.2106082.41970.008447
9-0.04442-0.51030.305331
100.1734621.99290.024166
110.0729960.83870.201589
120.156181.79440.037521
13-0.073299-0.84210.200616
14-0.110034-1.26420.104194
150.0174470.20050.420719
16-0.080717-0.92740.177715
17-0.155109-1.78210.038519
180.0379960.43650.331578
19-0.179697-2.06460.020461
20-0.001316-0.01510.49398
21-0.063818-0.73320.232365
22-0.085841-0.98620.162909
23-0.015589-0.17910.429065
24-0.02045-0.2350.407305
25-0.057972-0.6660.253271
26-0.079088-0.90870.182595
270.1229911.41310.079996
280.1475621.69540.046182
290.0340580.39130.348105
30-0.0039-0.04480.482163
31-0.066184-0.76040.224187
320.0832070.9560.170417
33-0.076016-0.87340.192027
340.1154241.32610.093545
350.0724860.83280.20323
36-0.015768-0.18120.428262
370.1168261.34220.090914
380.030910.35510.361528
390.0002910.00330.498669
40-0.040852-0.46940.319795
41-0.137239-1.57680.058623
420.0460060.52860.298998
430.1040381.19530.117055
44-0.125028-1.43650.076618
450.0277950.31930.374986
46-0.001487-0.01710.493199
470.027920.32080.374442
48-0.002605-0.02990.488083
490.0207490.23840.405973
50-0.002727-0.03130.487528
510.0320870.36860.356491
52-0.046864-0.53840.295594
53-0.080342-0.92310.178831
540.0046580.05350.478699
55-0.063068-0.72460.234991
560.0828240.95160.171526
57-0.035709-0.41030.341137
58-0.068081-0.78220.217753
590.0456830.52490.30028
600.0135390.15550.438314

\begin{tabular}{lllllllll}
\hline
Partial Autocorrelation Function \tabularnewline
Time lag k & PACF(k) & T-STAT & P-value \tabularnewline
1 & 0.25355 & 2.9131 & 0.002102 \tabularnewline
2 & 0.167545 & 1.9249 & 0.028194 \tabularnewline
3 & -0.063394 & -0.7283 & 0.233849 \tabularnewline
4 & -0.003551 & -0.0408 & 0.48376 \tabularnewline
5 & 0.172233 & 1.9788 & 0.024959 \tabularnewline
6 & 0.133758 & 1.5368 & 0.063372 \tabularnewline
7 & 0.046685 & 0.5364 & 0.296305 \tabularnewline
8 & 0.210608 & 2.4197 & 0.008447 \tabularnewline
9 & -0.04442 & -0.5103 & 0.305331 \tabularnewline
10 & 0.173462 & 1.9929 & 0.024166 \tabularnewline
11 & 0.072996 & 0.8387 & 0.201589 \tabularnewline
12 & 0.15618 & 1.7944 & 0.037521 \tabularnewline
13 & -0.073299 & -0.8421 & 0.200616 \tabularnewline
14 & -0.110034 & -1.2642 & 0.104194 \tabularnewline
15 & 0.017447 & 0.2005 & 0.420719 \tabularnewline
16 & -0.080717 & -0.9274 & 0.177715 \tabularnewline
17 & -0.155109 & -1.7821 & 0.038519 \tabularnewline
18 & 0.037996 & 0.4365 & 0.331578 \tabularnewline
19 & -0.179697 & -2.0646 & 0.020461 \tabularnewline
20 & -0.001316 & -0.0151 & 0.49398 \tabularnewline
21 & -0.063818 & -0.7332 & 0.232365 \tabularnewline
22 & -0.085841 & -0.9862 & 0.162909 \tabularnewline
23 & -0.015589 & -0.1791 & 0.429065 \tabularnewline
24 & -0.02045 & -0.235 & 0.407305 \tabularnewline
25 & -0.057972 & -0.666 & 0.253271 \tabularnewline
26 & -0.079088 & -0.9087 & 0.182595 \tabularnewline
27 & 0.122991 & 1.4131 & 0.079996 \tabularnewline
28 & 0.147562 & 1.6954 & 0.046182 \tabularnewline
29 & 0.034058 & 0.3913 & 0.348105 \tabularnewline
30 & -0.0039 & -0.0448 & 0.482163 \tabularnewline
31 & -0.066184 & -0.7604 & 0.224187 \tabularnewline
32 & 0.083207 & 0.956 & 0.170417 \tabularnewline
33 & -0.076016 & -0.8734 & 0.192027 \tabularnewline
34 & 0.115424 & 1.3261 & 0.093545 \tabularnewline
35 & 0.072486 & 0.8328 & 0.20323 \tabularnewline
36 & -0.015768 & -0.1812 & 0.428262 \tabularnewline
37 & 0.116826 & 1.3422 & 0.090914 \tabularnewline
38 & 0.03091 & 0.3551 & 0.361528 \tabularnewline
39 & 0.000291 & 0.0033 & 0.498669 \tabularnewline
40 & -0.040852 & -0.4694 & 0.319795 \tabularnewline
41 & -0.137239 & -1.5768 & 0.058623 \tabularnewline
42 & 0.046006 & 0.5286 & 0.298998 \tabularnewline
43 & 0.104038 & 1.1953 & 0.117055 \tabularnewline
44 & -0.125028 & -1.4365 & 0.076618 \tabularnewline
45 & 0.027795 & 0.3193 & 0.374986 \tabularnewline
46 & -0.001487 & -0.0171 & 0.493199 \tabularnewline
47 & 0.02792 & 0.3208 & 0.374442 \tabularnewline
48 & -0.002605 & -0.0299 & 0.488083 \tabularnewline
49 & 0.020749 & 0.2384 & 0.405973 \tabularnewline
50 & -0.002727 & -0.0313 & 0.487528 \tabularnewline
51 & 0.032087 & 0.3686 & 0.356491 \tabularnewline
52 & -0.046864 & -0.5384 & 0.295594 \tabularnewline
53 & -0.080342 & -0.9231 & 0.178831 \tabularnewline
54 & 0.004658 & 0.0535 & 0.478699 \tabularnewline
55 & -0.063068 & -0.7246 & 0.234991 \tabularnewline
56 & 0.082824 & 0.9516 & 0.171526 \tabularnewline
57 & -0.035709 & -0.4103 & 0.341137 \tabularnewline
58 & -0.068081 & -0.7822 & 0.217753 \tabularnewline
59 & 0.045683 & 0.5249 & 0.30028 \tabularnewline
60 & 0.013539 & 0.1555 & 0.438314 \tabularnewline
\hline
\end{tabular}
%Source: https://freestatistics.org/blog/index.php?pk=42807&T=2

[TABLE]
[ROW][C]Partial Autocorrelation Function[/C][/ROW]
[ROW][C]Time lag k[/C][C]PACF(k)[/C][C]T-STAT[/C][C]P-value[/C][/ROW]
[ROW][C]1[/C][C]0.25355[/C][C]2.9131[/C][C]0.002102[/C][/ROW]
[ROW][C]2[/C][C]0.167545[/C][C]1.9249[/C][C]0.028194[/C][/ROW]
[ROW][C]3[/C][C]-0.063394[/C][C]-0.7283[/C][C]0.233849[/C][/ROW]
[ROW][C]4[/C][C]-0.003551[/C][C]-0.0408[/C][C]0.48376[/C][/ROW]
[ROW][C]5[/C][C]0.172233[/C][C]1.9788[/C][C]0.024959[/C][/ROW]
[ROW][C]6[/C][C]0.133758[/C][C]1.5368[/C][C]0.063372[/C][/ROW]
[ROW][C]7[/C][C]0.046685[/C][C]0.5364[/C][C]0.296305[/C][/ROW]
[ROW][C]8[/C][C]0.210608[/C][C]2.4197[/C][C]0.008447[/C][/ROW]
[ROW][C]9[/C][C]-0.04442[/C][C]-0.5103[/C][C]0.305331[/C][/ROW]
[ROW][C]10[/C][C]0.173462[/C][C]1.9929[/C][C]0.024166[/C][/ROW]
[ROW][C]11[/C][C]0.072996[/C][C]0.8387[/C][C]0.201589[/C][/ROW]
[ROW][C]12[/C][C]0.15618[/C][C]1.7944[/C][C]0.037521[/C][/ROW]
[ROW][C]13[/C][C]-0.073299[/C][C]-0.8421[/C][C]0.200616[/C][/ROW]
[ROW][C]14[/C][C]-0.110034[/C][C]-1.2642[/C][C]0.104194[/C][/ROW]
[ROW][C]15[/C][C]0.017447[/C][C]0.2005[/C][C]0.420719[/C][/ROW]
[ROW][C]16[/C][C]-0.080717[/C][C]-0.9274[/C][C]0.177715[/C][/ROW]
[ROW][C]17[/C][C]-0.155109[/C][C]-1.7821[/C][C]0.038519[/C][/ROW]
[ROW][C]18[/C][C]0.037996[/C][C]0.4365[/C][C]0.331578[/C][/ROW]
[ROW][C]19[/C][C]-0.179697[/C][C]-2.0646[/C][C]0.020461[/C][/ROW]
[ROW][C]20[/C][C]-0.001316[/C][C]-0.0151[/C][C]0.49398[/C][/ROW]
[ROW][C]21[/C][C]-0.063818[/C][C]-0.7332[/C][C]0.232365[/C][/ROW]
[ROW][C]22[/C][C]-0.085841[/C][C]-0.9862[/C][C]0.162909[/C][/ROW]
[ROW][C]23[/C][C]-0.015589[/C][C]-0.1791[/C][C]0.429065[/C][/ROW]
[ROW][C]24[/C][C]-0.02045[/C][C]-0.235[/C][C]0.407305[/C][/ROW]
[ROW][C]25[/C][C]-0.057972[/C][C]-0.666[/C][C]0.253271[/C][/ROW]
[ROW][C]26[/C][C]-0.079088[/C][C]-0.9087[/C][C]0.182595[/C][/ROW]
[ROW][C]27[/C][C]0.122991[/C][C]1.4131[/C][C]0.079996[/C][/ROW]
[ROW][C]28[/C][C]0.147562[/C][C]1.6954[/C][C]0.046182[/C][/ROW]
[ROW][C]29[/C][C]0.034058[/C][C]0.3913[/C][C]0.348105[/C][/ROW]
[ROW][C]30[/C][C]-0.0039[/C][C]-0.0448[/C][C]0.482163[/C][/ROW]
[ROW][C]31[/C][C]-0.066184[/C][C]-0.7604[/C][C]0.224187[/C][/ROW]
[ROW][C]32[/C][C]0.083207[/C][C]0.956[/C][C]0.170417[/C][/ROW]
[ROW][C]33[/C][C]-0.076016[/C][C]-0.8734[/C][C]0.192027[/C][/ROW]
[ROW][C]34[/C][C]0.115424[/C][C]1.3261[/C][C]0.093545[/C][/ROW]
[ROW][C]35[/C][C]0.072486[/C][C]0.8328[/C][C]0.20323[/C][/ROW]
[ROW][C]36[/C][C]-0.015768[/C][C]-0.1812[/C][C]0.428262[/C][/ROW]
[ROW][C]37[/C][C]0.116826[/C][C]1.3422[/C][C]0.090914[/C][/ROW]
[ROW][C]38[/C][C]0.03091[/C][C]0.3551[/C][C]0.361528[/C][/ROW]
[ROW][C]39[/C][C]0.000291[/C][C]0.0033[/C][C]0.498669[/C][/ROW]
[ROW][C]40[/C][C]-0.040852[/C][C]-0.4694[/C][C]0.319795[/C][/ROW]
[ROW][C]41[/C][C]-0.137239[/C][C]-1.5768[/C][C]0.058623[/C][/ROW]
[ROW][C]42[/C][C]0.046006[/C][C]0.5286[/C][C]0.298998[/C][/ROW]
[ROW][C]43[/C][C]0.104038[/C][C]1.1953[/C][C]0.117055[/C][/ROW]
[ROW][C]44[/C][C]-0.125028[/C][C]-1.4365[/C][C]0.076618[/C][/ROW]
[ROW][C]45[/C][C]0.027795[/C][C]0.3193[/C][C]0.374986[/C][/ROW]
[ROW][C]46[/C][C]-0.001487[/C][C]-0.0171[/C][C]0.493199[/C][/ROW]
[ROW][C]47[/C][C]0.02792[/C][C]0.3208[/C][C]0.374442[/C][/ROW]
[ROW][C]48[/C][C]-0.002605[/C][C]-0.0299[/C][C]0.488083[/C][/ROW]
[ROW][C]49[/C][C]0.020749[/C][C]0.2384[/C][C]0.405973[/C][/ROW]
[ROW][C]50[/C][C]-0.002727[/C][C]-0.0313[/C][C]0.487528[/C][/ROW]
[ROW][C]51[/C][C]0.032087[/C][C]0.3686[/C][C]0.356491[/C][/ROW]
[ROW][C]52[/C][C]-0.046864[/C][C]-0.5384[/C][C]0.295594[/C][/ROW]
[ROW][C]53[/C][C]-0.080342[/C][C]-0.9231[/C][C]0.178831[/C][/ROW]
[ROW][C]54[/C][C]0.004658[/C][C]0.0535[/C][C]0.478699[/C][/ROW]
[ROW][C]55[/C][C]-0.063068[/C][C]-0.7246[/C][C]0.234991[/C][/ROW]
[ROW][C]56[/C][C]0.082824[/C][C]0.9516[/C][C]0.171526[/C][/ROW]
[ROW][C]57[/C][C]-0.035709[/C][C]-0.4103[/C][C]0.341137[/C][/ROW]
[ROW][C]58[/C][C]-0.068081[/C][C]-0.7822[/C][C]0.217753[/C][/ROW]
[ROW][C]59[/C][C]0.045683[/C][C]0.5249[/C][C]0.30028[/C][/ROW]
[ROW][C]60[/C][C]0.013539[/C][C]0.1555[/C][C]0.438314[/C][/ROW]
[/TABLE]
Source: https://freestatistics.org/blog/index.php?pk=42807&T=2

Globally Unique Identifier (entire table): ba.freestatistics.org/blog/index.php?pk=42807&T=2

As an alternative you can also use a QR Code:  

The GUIDs for individual cells are displayed in the table below:

Partial Autocorrelation Function
Time lag kPACF(k)T-STATP-value
10.253552.91310.002102
20.1675451.92490.028194
3-0.063394-0.72830.233849
4-0.003551-0.04080.48376
50.1722331.97880.024959
60.1337581.53680.063372
70.0466850.53640.296305
80.2106082.41970.008447
9-0.04442-0.51030.305331
100.1734621.99290.024166
110.0729960.83870.201589
120.156181.79440.037521
13-0.073299-0.84210.200616
14-0.110034-1.26420.104194
150.0174470.20050.420719
16-0.080717-0.92740.177715
17-0.155109-1.78210.038519
180.0379960.43650.331578
19-0.179697-2.06460.020461
20-0.001316-0.01510.49398
21-0.063818-0.73320.232365
22-0.085841-0.98620.162909
23-0.015589-0.17910.429065
24-0.02045-0.2350.407305
25-0.057972-0.6660.253271
26-0.079088-0.90870.182595
270.1229911.41310.079996
280.1475621.69540.046182
290.0340580.39130.348105
30-0.0039-0.04480.482163
31-0.066184-0.76040.224187
320.0832070.9560.170417
33-0.076016-0.87340.192027
340.1154241.32610.093545
350.0724860.83280.20323
36-0.015768-0.18120.428262
370.1168261.34220.090914
380.030910.35510.361528
390.0002910.00330.498669
40-0.040852-0.46940.319795
41-0.137239-1.57680.058623
420.0460060.52860.298998
430.1040381.19530.117055
44-0.125028-1.43650.076618
450.0277950.31930.374986
46-0.001487-0.01710.493199
470.027920.32080.374442
48-0.002605-0.02990.488083
490.0207490.23840.405973
50-0.002727-0.03130.487528
510.0320870.36860.356491
52-0.046864-0.53840.295594
53-0.080342-0.92310.178831
540.0046580.05350.478699
55-0.063068-0.72460.234991
560.0828240.95160.171526
57-0.035709-0.41030.341137
58-0.068081-0.78220.217753
590.0456830.52490.30028
600.0135390.15550.438314


Parameters (Session):
par1 = 60 ; par2 = 1 ; par3 = 0 ; par4 = 0 ; par5 = 12 ;
Parameters (R input):
par1 = 60 ; par2 = 1 ; par3 = 0 ; par4 = 0 ; par5 = 12 ;
R code (references can be found in the software module):
if (par1 == 'Default') {
par1 = 10*log10(length(x))
} else {
par1 <- as.numeric(par1)
}
par2 <- as.numeric(par2)
par3 <- as.numeric(par3)
par4 <- as.numeric(par4)
par5 <- as.numeric(par5)
if (par2 == 0) {
x <- log(x)
} else {
x <- (x ^ par2 - 1) / par2
}
if (par3 > 0) x <- diff(x,lag=1,difference=par3)
if (par4 > 0) x <- diff(x,lag=par5,difference=par4)
bitmap(file='pic1.png')
racf <- acf(x,par1,main='Autocorrelation',xlab='lags',ylab='ACF')
dev.off()
bitmap(file='pic2.png')
rpacf <- pacf(x,par1,main='Partial Autocorrelation',xlab='lags',ylab='PACF')
dev.off()
(myacf <- c(racf$acf))
(mypacf <- c(rpacf$acf))
lengthx <- length(x)
sqrtn <- sqrt(lengthx)
load(file='createtable')
a<-table.start()
a<-table.row.start(a)
a<-table.element(a,'Autocorrelation Function',4,TRUE)
a<-table.row.end(a)
a<-table.row.start(a)
a<-table.element(a,'Time lag k',header=TRUE)
a<-table.element(a,hyperlink('basics.htm','ACF(k)','click here for more information about the Autocorrelation Function'),header=TRUE)
a<-table.element(a,'T-STAT',header=TRUE)
a<-table.element(a,'P-value',header=TRUE)
a<-table.row.end(a)
for (i in 2:(par1+1)) {
a<-table.row.start(a)
a<-table.element(a,i-1,header=TRUE)
a<-table.element(a,round(myacf[i],6))
mytstat <- myacf[i]*sqrtn
a<-table.element(a,round(mytstat,4))
a<-table.element(a,round(1-pt(abs(mytstat),lengthx),6))
a<-table.row.end(a)
}
a<-table.end(a)
table.save(a,file='mytable.tab')
a<-table.start()
a<-table.row.start(a)
a<-table.element(a,'Partial Autocorrelation Function',4,TRUE)
a<-table.row.end(a)
a<-table.row.start(a)
a<-table.element(a,'Time lag k',header=TRUE)
a<-table.element(a,hyperlink('basics.htm','PACF(k)','click here for more information about the Partial Autocorrelation Function'),header=TRUE)
a<-table.element(a,'T-STAT',header=TRUE)
a<-table.element(a,'P-value',header=TRUE)
a<-table.row.end(a)
for (i in 1:par1) {
a<-table.row.start(a)
a<-table.element(a,i,header=TRUE)
a<-table.element(a,round(mypacf[i],6))
mytstat <- mypacf[i]*sqrtn
a<-table.element(a,round(mytstat,4))
a<-table.element(a,round(1-pt(abs(mytstat),lengthx),6))
a<-table.row.end(a)
}
a<-table.end(a)
table.save(a,file='mytable1.tab')