Free Statistics

of Irreproducible Research!

Author's title

Author*Unverified author*
R Software Modulerwasp_smp.wasp
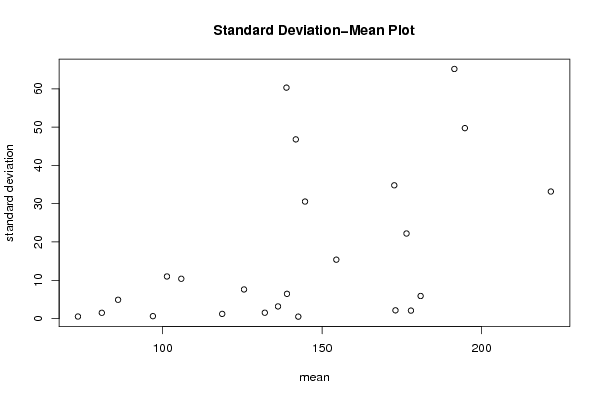
Title produced by softwareStandard Deviation-Mean Plot
Date of computationSun, 16 Aug 2009 10:22:21 -0600
Cite this page as followsStatistical Computations at FreeStatistics.org, Office for Research Development and Education, URL https://freestatistics.org/blog/index.php?v=date/2009/Aug/16/t1250439756851wtljg7nk7071.htm/, Retrieved Sun, 05 May 2024 12:50:08 +0000
Statistical Computations at FreeStatistics.org, Office for Research Development and Education, URL https://freestatistics.org/blog/index.php?pk=42659, Retrieved Sun, 05 May 2024 12:50:08 +0000
QR Codes:

Original text written by user:
IsPrivate?No (this computation is public)
User-defined keywords
Estimated Impact160
Family? (F = Feedback message, R = changed R code, M = changed R Module, P = changed Parameters, D = changed Data)
-     [Central Tendency] [Maarten Verhaegen...] [2008-08-17 13:34:14] [b57209f6d0b19d479b8c06a8ae81c48a]
- RMPD    [Standard Deviation-Mean Plot] [] [2009-08-16 16:22:21] [e921d89db97faa9283224ee60d8fb091] [Current]
Feedback Forum

Post a new message
Dataseries X:
72.84
73.96
73.26
73.86
73.04
212.8
157.92
111.55
99.01
89.5
100.95
116.06
131.5
137.43
138.53
137.26
136.81
182.98
149.45
109.34
93.37
84.09
83.83
82.94
82.88
81.41
79.87
79.66
76.07
182.69
165.78
142.5
120.6
105.73
98.72
98.41
96.08
97.3
97.5
97.02
98.75
232.81
240.83
193.4
148.28
138.34
135.34
134.02
133.86
131.67
132.43
130.21
129.98
206.16
195.17
159.16
136.33
125.18
121.21
119.38
119.26
119.75
118.78
116.97
121.69
223.51
228.58
205.22
189.4
180.14
177.59
176.39
171.16
173.11
171.74
175.97
179.64
254.62
240.5
212.01
176.36
153.24
146.69
141.52
142.6
143.19
142.32
142.03
144.92
177.31
194.4
189.19
180.44
175.84
178.54
176.55


Summary of computational transaction
Raw Inputview raw input (R code)
Raw Outputview raw output of R engine
Computing time2 seconds
R Server'George Udny Yule' @ 72.249.76.132

\begin{tabular}{lllllllll}
\hline
Summary of computational transaction \tabularnewline
Raw Input & view raw input (R code)  \tabularnewline
Raw Output & view raw output of R engine  \tabularnewline
Computing time & 2 seconds \tabularnewline
R Server & 'George Udny Yule' @ 72.249.76.132 \tabularnewline
\hline
\end{tabular}
%Source: https://freestatistics.org/blog/index.php?pk=42659&T=0

[TABLE]
[ROW][C]Summary of computational transaction[/C][/ROW]
[ROW][C]Raw Input[/C][C]view raw input (R code) [/C][/ROW]
[ROW][C]Raw Output[/C][C]view raw output of R engine [/C][/ROW]
[ROW][C]Computing time[/C][C]2 seconds[/C][/ROW]
[ROW][C]R Server[/C][C]'George Udny Yule' @ 72.249.76.132[/C][/ROW]
[/TABLE]
Source: https://freestatistics.org/blog/index.php?pk=42659&T=0

Globally Unique Identifier (entire table): ba.freestatistics.org/blog/index.php?pk=42659&T=0

As an alternative you can also use a QR Code:  

The GUIDs for individual cells are displayed in the table below:

Summary of computational transaction
Raw Inputview raw input (R code)
Raw Outputview raw output of R engine
Computing time2 seconds
R Server'George Udny Yule' @ 72.249.76.132


Standard Deviation-Mean Plot
SectionMeanStandard DeviationRange
173.480.5268775948927761.11999999999999
2138.827560.3006674230615139.76
3101.3810.991490648072626.56
4136.183.170373269296017.03
5144.64530.553180412738373.64
686.05754.8998052682394110.43
780.9551.501876603897053.22
8141.7646.790130725756106.62
9105.86510.388559412481922.19
1096.9750.6283045970440351.42000000000000
11191.447565.1821204395807142.08
12138.9956.4485114561424114.26
13132.04251.522090119977573.65000000000001
14172.617534.798348979034476.18
15125.5257.5992828609020816.9500000000000
16118.691.213122692338522.78
17194.7549.7292368732922106.89
18180.885.8912986683752613.0100000000000
19172.9952.145235029858814.81
20221.692533.166779941180174.98
21154.452515.372211671281034.84
22142.5350.4948063594309721.16000000000000
23176.45522.206534323632549.48
24177.84252.074775088212374.59999999999999

\begin{tabular}{lllllllll}
\hline
Standard Deviation-Mean Plot \tabularnewline
Section & Mean & Standard Deviation & Range \tabularnewline
1 & 73.48 & 0.526877594892776 & 1.11999999999999 \tabularnewline
2 & 138.8275 & 60.3006674230615 & 139.76 \tabularnewline
3 & 101.38 & 10.9914906480726 & 26.56 \tabularnewline
4 & 136.18 & 3.17037326929601 & 7.03 \tabularnewline
5 & 144.645 & 30.5531804127383 & 73.64 \tabularnewline
6 & 86.0575 & 4.89980526823941 & 10.43 \tabularnewline
7 & 80.955 & 1.50187660389705 & 3.22 \tabularnewline
8 & 141.76 & 46.790130725756 & 106.62 \tabularnewline
9 & 105.865 & 10.3885594124819 & 22.19 \tabularnewline
10 & 96.975 & 0.628304597044035 & 1.42000000000000 \tabularnewline
11 & 191.4475 & 65.1821204395807 & 142.08 \tabularnewline
12 & 138.995 & 6.44851145614241 & 14.26 \tabularnewline
13 & 132.0425 & 1.52209011997757 & 3.65000000000001 \tabularnewline
14 & 172.6175 & 34.7983489790344 & 76.18 \tabularnewline
15 & 125.525 & 7.59928286090208 & 16.9500000000000 \tabularnewline
16 & 118.69 & 1.21312269233852 & 2.78 \tabularnewline
17 & 194.75 & 49.7292368732922 & 106.89 \tabularnewline
18 & 180.88 & 5.89129866837526 & 13.0100000000000 \tabularnewline
19 & 172.995 & 2.14523502985881 & 4.81 \tabularnewline
20 & 221.6925 & 33.1667799411801 & 74.98 \tabularnewline
21 & 154.4525 & 15.3722116712810 & 34.84 \tabularnewline
22 & 142.535 & 0.494806359430972 & 1.16000000000000 \tabularnewline
23 & 176.455 & 22.2065343236325 & 49.48 \tabularnewline
24 & 177.8425 & 2.07477508821237 & 4.59999999999999 \tabularnewline
\hline
\end{tabular}
%Source: https://freestatistics.org/blog/index.php?pk=42659&T=1

[TABLE]
[ROW][C]Standard Deviation-Mean Plot[/C][/ROW]
[ROW][C]Section[/C][C]Mean[/C][C]Standard Deviation[/C][C]Range[/C][/ROW]
[ROW][C]1[/C][C]73.48[/C][C]0.526877594892776[/C][C]1.11999999999999[/C][/ROW]
[ROW][C]2[/C][C]138.8275[/C][C]60.3006674230615[/C][C]139.76[/C][/ROW]
[ROW][C]3[/C][C]101.38[/C][C]10.9914906480726[/C][C]26.56[/C][/ROW]
[ROW][C]4[/C][C]136.18[/C][C]3.17037326929601[/C][C]7.03[/C][/ROW]
[ROW][C]5[/C][C]144.645[/C][C]30.5531804127383[/C][C]73.64[/C][/ROW]
[ROW][C]6[/C][C]86.0575[/C][C]4.89980526823941[/C][C]10.43[/C][/ROW]
[ROW][C]7[/C][C]80.955[/C][C]1.50187660389705[/C][C]3.22[/C][/ROW]
[ROW][C]8[/C][C]141.76[/C][C]46.790130725756[/C][C]106.62[/C][/ROW]
[ROW][C]9[/C][C]105.865[/C][C]10.3885594124819[/C][C]22.19[/C][/ROW]
[ROW][C]10[/C][C]96.975[/C][C]0.628304597044035[/C][C]1.42000000000000[/C][/ROW]
[ROW][C]11[/C][C]191.4475[/C][C]65.1821204395807[/C][C]142.08[/C][/ROW]
[ROW][C]12[/C][C]138.995[/C][C]6.44851145614241[/C][C]14.26[/C][/ROW]
[ROW][C]13[/C][C]132.0425[/C][C]1.52209011997757[/C][C]3.65000000000001[/C][/ROW]
[ROW][C]14[/C][C]172.6175[/C][C]34.7983489790344[/C][C]76.18[/C][/ROW]
[ROW][C]15[/C][C]125.525[/C][C]7.59928286090208[/C][C]16.9500000000000[/C][/ROW]
[ROW][C]16[/C][C]118.69[/C][C]1.21312269233852[/C][C]2.78[/C][/ROW]
[ROW][C]17[/C][C]194.75[/C][C]49.7292368732922[/C][C]106.89[/C][/ROW]
[ROW][C]18[/C][C]180.88[/C][C]5.89129866837526[/C][C]13.0100000000000[/C][/ROW]
[ROW][C]19[/C][C]172.995[/C][C]2.14523502985881[/C][C]4.81[/C][/ROW]
[ROW][C]20[/C][C]221.6925[/C][C]33.1667799411801[/C][C]74.98[/C][/ROW]
[ROW][C]21[/C][C]154.4525[/C][C]15.3722116712810[/C][C]34.84[/C][/ROW]
[ROW][C]22[/C][C]142.535[/C][C]0.494806359430972[/C][C]1.16000000000000[/C][/ROW]
[ROW][C]23[/C][C]176.455[/C][C]22.2065343236325[/C][C]49.48[/C][/ROW]
[ROW][C]24[/C][C]177.8425[/C][C]2.07477508821237[/C][C]4.59999999999999[/C][/ROW]
[/TABLE]
Source: https://freestatistics.org/blog/index.php?pk=42659&T=1

Globally Unique Identifier (entire table): ba.freestatistics.org/blog/index.php?pk=42659&T=1

As an alternative you can also use a QR Code:  

The GUIDs for individual cells are displayed in the table below:

Standard Deviation-Mean Plot
SectionMeanStandard DeviationRange
173.480.5268775948927761.11999999999999
2138.827560.3006674230615139.76
3101.3810.991490648072626.56
4136.183.170373269296017.03
5144.64530.553180412738373.64
686.05754.8998052682394110.43
780.9551.501876603897053.22
8141.7646.790130725756106.62
9105.86510.388559412481922.19
1096.9750.6283045970440351.42000000000000
11191.447565.1821204395807142.08
12138.9956.4485114561424114.26
13132.04251.522090119977573.65000000000001
14172.617534.798348979034476.18
15125.5257.5992828609020816.9500000000000
16118.691.213122692338522.78
17194.7549.7292368732922106.89
18180.885.8912986683752613.0100000000000
19172.9952.145235029858814.81
20221.692533.166779941180174.98
21154.452515.372211671281034.84
22142.5350.4948063594309721.16000000000000
23176.45522.206534323632549.48
24177.84252.074775088212374.59999999999999


Regression: S.E.(k) = alpha + beta * Mean(k)
alpha-20.2612786891337
beta0.265293328675708
S.D.0.0964998671882017
T-STAT2.74915744866583
p-value0.0117087227791648

\begin{tabular}{lllllllll}
\hline
Regression: S.E.(k) = alpha + beta * Mean(k) \tabularnewline
alpha & -20.2612786891337 \tabularnewline
beta & 0.265293328675708 \tabularnewline
S.D. & 0.0964998671882017 \tabularnewline
T-STAT & 2.74915744866583 \tabularnewline
p-value & 0.0117087227791648 \tabularnewline
\hline
\end{tabular}
%Source: https://freestatistics.org/blog/index.php?pk=42659&T=2

[TABLE]
[ROW][C]Regression: S.E.(k) = alpha + beta * Mean(k)[/C][/ROW]
[ROW][C]alpha[/C][C]-20.2612786891337[/C][/ROW]
[ROW][C]beta[/C][C]0.265293328675708[/C][/ROW]
[ROW][C]S.D.[/C][C]0.0964998671882017[/C][/ROW]
[ROW][C]T-STAT[/C][C]2.74915744866583[/C][/ROW]
[ROW][C]p-value[/C][C]0.0117087227791648[/C][/ROW]
[/TABLE]
Source: https://freestatistics.org/blog/index.php?pk=42659&T=2

Globally Unique Identifier (entire table): ba.freestatistics.org/blog/index.php?pk=42659&T=2

As an alternative you can also use a QR Code:  

The GUIDs for individual cells are displayed in the table below:

Regression: S.E.(k) = alpha + beta * Mean(k)
alpha-20.2612786891337
beta0.265293328675708
S.D.0.0964998671882017
T-STAT2.74915744866583
p-value0.0117087227791648


Regression: ln S.E.(k) = alpha + beta * ln Mean(k)
alpha-12.5243197076913
beta2.93902427765588
S.D.0.958925356060677
T-STAT3.0649145515659
p-value0.00567106532999836
Lambda-1.93902427765588

\begin{tabular}{lllllllll}
\hline
Regression: ln S.E.(k) = alpha + beta * ln Mean(k) \tabularnewline
alpha & -12.5243197076913 \tabularnewline
beta & 2.93902427765588 \tabularnewline
S.D. & 0.958925356060677 \tabularnewline
T-STAT & 3.0649145515659 \tabularnewline
p-value & 0.00567106532999836 \tabularnewline
Lambda & -1.93902427765588 \tabularnewline
\hline
\end{tabular}
%Source: https://freestatistics.org/blog/index.php?pk=42659&T=3

[TABLE]
[ROW][C]Regression: ln S.E.(k) = alpha + beta * ln Mean(k)[/C][/ROW]
[ROW][C]alpha[/C][C]-12.5243197076913[/C][/ROW]
[ROW][C]beta[/C][C]2.93902427765588[/C][/ROW]
[ROW][C]S.D.[/C][C]0.958925356060677[/C][/ROW]
[ROW][C]T-STAT[/C][C]3.0649145515659[/C][/ROW]
[ROW][C]p-value[/C][C]0.00567106532999836[/C][/ROW]
[ROW][C]Lambda[/C][C]-1.93902427765588[/C][/ROW]
[/TABLE]
Source: https://freestatistics.org/blog/index.php?pk=42659&T=3

Globally Unique Identifier (entire table): ba.freestatistics.org/blog/index.php?pk=42659&T=3

As an alternative you can also use a QR Code:  

The GUIDs for individual cells are displayed in the table below:

Regression: ln S.E.(k) = alpha + beta * ln Mean(k)
alpha-12.5243197076913
beta2.93902427765588
S.D.0.958925356060677
T-STAT3.0649145515659
p-value0.00567106532999836
Lambda-1.93902427765588


Parameters (Session):
par2 = grey ; par3 = FALSE ; par4 = Unknown ;
Parameters (R input):
par1 = 4 ;
R code (references can be found in the software module):
par1 <- as.numeric(par1)
(n <- length(x))
(np <- floor(n / par1))
arr <- array(NA,dim=c(par1,np))
j <- 0
k <- 1
for (i in 1:(np*par1))
{
j = j + 1
arr[j,k] <- x[i]
if (j == par1) {
j = 0
k=k+1
}
}
arr
arr.mean <- array(NA,dim=np)
arr.sd <- array(NA,dim=np)
arr.range <- array(NA,dim=np)
for (j in 1:np)
{
arr.mean[j] <- mean(arr[,j],na.rm=TRUE)
arr.sd[j] <- sd(arr[,j],na.rm=TRUE)
arr.range[j] <- max(arr[,j],na.rm=TRUE) - min(arr[,j],na.rm=TRUE)
}
arr.mean
arr.sd
arr.range
(lm1 <- lm(arr.sd~arr.mean))
(lnlm1 <- lm(log(arr.sd)~log(arr.mean)))
(lm2 <- lm(arr.range~arr.mean))
bitmap(file='test1.png')
plot(arr.mean,arr.sd,main='Standard Deviation-Mean Plot',xlab='mean',ylab='standard deviation')
dev.off()
bitmap(file='test2.png')
plot(arr.mean,arr.range,main='Range-Mean Plot',xlab='mean',ylab='range')
dev.off()
load(file='createtable')
a<-table.start()
a<-table.row.start(a)
a<-table.element(a,'Standard Deviation-Mean Plot',4,TRUE)
a<-table.row.end(a)
a<-table.row.start(a)
a<-table.element(a,'Section',header=TRUE)
a<-table.element(a,'Mean',header=TRUE)
a<-table.element(a,'Standard Deviation',header=TRUE)
a<-table.element(a,'Range',header=TRUE)
a<-table.row.end(a)
for (j in 1:np) {
a<-table.row.start(a)
a<-table.element(a,j,header=TRUE)
a<-table.element(a,arr.mean[j])
a<-table.element(a,arr.sd[j] )
a<-table.element(a,arr.range[j] )
a<-table.row.end(a)
}
a<-table.end(a)
table.save(a,file='mytable.tab')
a<-table.start()
a<-table.row.start(a)
a<-table.element(a,'Regression: S.E.(k) = alpha + beta * Mean(k)',2,TRUE)
a<-table.row.end(a)
a<-table.row.start(a)
a<-table.element(a,'alpha',header=TRUE)
a<-table.element(a,lm1$coefficients[[1]])
a<-table.row.end(a)
a<-table.row.start(a)
a<-table.element(a,'beta',header=TRUE)
a<-table.element(a,lm1$coefficients[[2]])
a<-table.row.end(a)
a<-table.row.start(a)
a<-table.element(a,'S.D.',header=TRUE)
a<-table.element(a,summary(lm1)$coefficients[2,2])
a<-table.row.end(a)
a<-table.row.start(a)
a<-table.element(a,'T-STAT',header=TRUE)
a<-table.element(a,summary(lm1)$coefficients[2,3])
a<-table.row.end(a)
a<-table.row.start(a)
a<-table.element(a,'p-value',header=TRUE)
a<-table.element(a,summary(lm1)$coefficients[2,4])
a<-table.row.end(a)
a<-table.end(a)
table.save(a,file='mytable1.tab')
a<-table.start()
a<-table.row.start(a)
a<-table.element(a,'Regression: ln S.E.(k) = alpha + beta * ln Mean(k)',2,TRUE)
a<-table.row.end(a)
a<-table.row.start(a)
a<-table.element(a,'alpha',header=TRUE)
a<-table.element(a,lnlm1$coefficients[[1]])
a<-table.row.end(a)
a<-table.row.start(a)
a<-table.element(a,'beta',header=TRUE)
a<-table.element(a,lnlm1$coefficients[[2]])
a<-table.row.end(a)
a<-table.row.start(a)
a<-table.element(a,'S.D.',header=TRUE)
a<-table.element(a,summary(lnlm1)$coefficients[2,2])
a<-table.row.end(a)
a<-table.row.start(a)
a<-table.element(a,'T-STAT',header=TRUE)
a<-table.element(a,summary(lnlm1)$coefficients[2,3])
a<-table.row.end(a)
a<-table.row.start(a)
a<-table.element(a,'p-value',header=TRUE)
a<-table.element(a,summary(lnlm1)$coefficients[2,4])
a<-table.row.end(a)
a<-table.row.start(a)
a<-table.element(a,'Lambda',header=TRUE)
a<-table.element(a,1-lnlm1$coefficients[[2]])
a<-table.row.end(a)
a<-table.end(a)
table.save(a,file='mytable2.tab')