Free Statistics

of Irreproducible Research!

Author's title

Author*Unverified author*
R Software Modulerwasp_autocorrelation.wasp
Title produced by software(Partial) Autocorrelation Function
Date of computationSun, 16 Aug 2009 09:34:29 -0600
Cite this page as followsStatistical Computations at FreeStatistics.org, Office for Research Development and Education, URL https://freestatistics.org/blog/index.php?v=date/2009/Aug/16/t1250436922k9rx5juf89fh09t.htm/, Retrieved Sun, 05 May 2024 17:22:06 +0000
Statistical Computations at FreeStatistics.org, Office for Research Development and Education, URL https://freestatistics.org/blog/index.php?pk=42646, Retrieved Sun, 05 May 2024 17:22:06 +0000
QR Codes:

Original text written by user:
IsPrivate?No (this computation is public)
User-defined keywords
Estimated Impact196
Family? (F = Feedback message, R = changed R code, M = changed R Module, P = changed Parameters, D = changed Data)
-     [Central Tendency] [Maarten Verhaegen...] [2008-08-17 13:34:14] [b57209f6d0b19d479b8c06a8ae81c48a]
- RMPD    [(Partial) Autocorrelation Function] [] [2009-08-16 15:34:29] [0d1085ed835696cdd537ad5fa07600ec] [Current]
Feedback Forum

Post a new message
Dataseries X:
105.46
104.66
103.52
103.71
103.78
103.67
103.66
102.76
102
101.5
101.5
99.22
98.97
98.9
99.78
104.4
106.21
105.46
108.33
111.72
111.88
112.86
113.09
116.9
114.62
118.86
124.71
122.53
127.89
136.16
134.12
130.26
135.35
131.43
129.61
123.96
121.1
125.38
123.1
129.92
136.68
131.17
124.82
122.47
126.15
118.74
116.8
116.64
116.53
117.68
119.46
126.19
124.39
121.9
122.53
122.93
124.66
124.41
120.93
120.18
123.44
126.1
125.82
122.18
117.27
117.86
119.09
123.08
125.42
121.81
121.66
121.27
120.92
122.16
124.17
127.26
134.16
134.09
135.57
136.13
136.23
140.6
136.5
130.59
129.5
135.25
138.06
146.28
145.04
147.96
156.71
160.97
168.17
163.91
153.05
151.76


Summary of computational transaction
Raw Inputview raw input (R code)
Raw Outputview raw output of R engine
Computing time2 seconds
R Server'Sir Ronald Aylmer Fisher' @ 193.190.124.24

\begin{tabular}{lllllllll}
\hline
Summary of computational transaction \tabularnewline
Raw Input & view raw input (R code)  \tabularnewline
Raw Output & view raw output of R engine  \tabularnewline
Computing time & 2 seconds \tabularnewline
R Server & 'Sir Ronald Aylmer Fisher' @ 193.190.124.24 \tabularnewline
\hline
\end{tabular}
%Source: https://freestatistics.org/blog/index.php?pk=42646&T=0

[TABLE]
[ROW][C]Summary of computational transaction[/C][/ROW]
[ROW][C]Raw Input[/C][C]view raw input (R code) [/C][/ROW]
[ROW][C]Raw Output[/C][C]view raw output of R engine [/C][/ROW]
[ROW][C]Computing time[/C][C]2 seconds[/C][/ROW]
[ROW][C]R Server[/C][C]'Sir Ronald Aylmer Fisher' @ 193.190.124.24[/C][/ROW]
[/TABLE]
Source: https://freestatistics.org/blog/index.php?pk=42646&T=0

Globally Unique Identifier (entire table): ba.freestatistics.org/blog/index.php?pk=42646&T=0

As an alternative you can also use a QR Code:  

The GUIDs for individual cells are displayed in the table below:

Summary of computational transaction
Raw Inputview raw input (R code)
Raw Outputview raw output of R engine
Computing time2 seconds
R Server'Sir Ronald Aylmer Fisher' @ 193.190.124.24


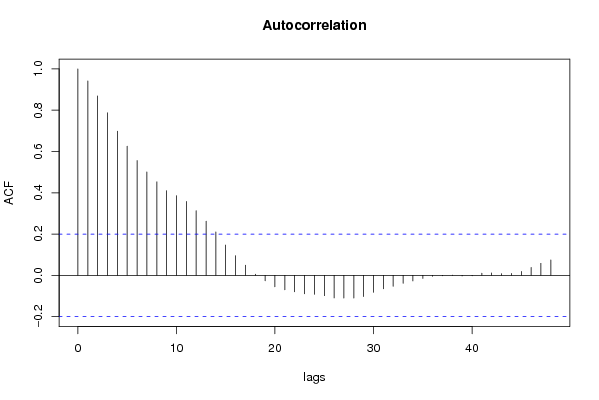
Autocorrelation Function
Time lag kACF(k)T-STATP-value
10.9420359.230
20.8693888.51820
30.7874767.71570
40.6987266.84610
50.6254346.1280
60.5561075.44870
70.5008454.90732e-06
80.4529794.43831.2e-05
90.4104394.02155.8e-05
100.3857113.77920.000137
110.3582113.50970.000342
120.3131523.06830.001399
130.2624332.57130.005833
140.2105142.06260.020925
150.1466851.43720.076954
160.0953660.93440.176223
170.0492910.4830.315114
180.0058450.05730.477225
19-0.026444-0.25910.398057
20-0.055122-0.54010.295195
21-0.07003-0.68620.247135
22-0.079755-0.78140.218235
23-0.089362-0.87560.191727
24-0.091525-0.89680.186045
25-0.098378-0.96390.168758
26-0.109342-1.07130.143354
27-0.109999-1.07780.141919
28-0.11001-1.07790.141895
29-0.102507-1.00440.158864
30-0.081646-0.80.212854
31-0.064657-0.63350.263955
32-0.052835-0.51770.302936
33-0.038752-0.37970.352508
34-0.026989-0.26440.396005
35-0.014616-0.14320.443213
36-0.004805-0.04710.481273
37-0.002224-0.02180.491329
380.0006980.00680.497278
39-0.002647-0.02590.48968
40-0.001735-0.0170.493237
410.010640.10430.458593
420.0116290.11390.454762
430.0076410.07490.470239
440.0090280.08850.464849
450.018880.1850.426815
460.0378980.37130.355607
470.0583310.57150.28449
480.0747650.73250.232811

\begin{tabular}{lllllllll}
\hline
Autocorrelation Function \tabularnewline
Time lag k & ACF(k) & T-STAT & P-value \tabularnewline
1 & 0.942035 & 9.23 & 0 \tabularnewline
2 & 0.869388 & 8.5182 & 0 \tabularnewline
3 & 0.787476 & 7.7157 & 0 \tabularnewline
4 & 0.698726 & 6.8461 & 0 \tabularnewline
5 & 0.625434 & 6.128 & 0 \tabularnewline
6 & 0.556107 & 5.4487 & 0 \tabularnewline
7 & 0.500845 & 4.9073 & 2e-06 \tabularnewline
8 & 0.452979 & 4.4383 & 1.2e-05 \tabularnewline
9 & 0.410439 & 4.0215 & 5.8e-05 \tabularnewline
10 & 0.385711 & 3.7792 & 0.000137 \tabularnewline
11 & 0.358211 & 3.5097 & 0.000342 \tabularnewline
12 & 0.313152 & 3.0683 & 0.001399 \tabularnewline
13 & 0.262433 & 2.5713 & 0.005833 \tabularnewline
14 & 0.210514 & 2.0626 & 0.020925 \tabularnewline
15 & 0.146685 & 1.4372 & 0.076954 \tabularnewline
16 & 0.095366 & 0.9344 & 0.176223 \tabularnewline
17 & 0.049291 & 0.483 & 0.315114 \tabularnewline
18 & 0.005845 & 0.0573 & 0.477225 \tabularnewline
19 & -0.026444 & -0.2591 & 0.398057 \tabularnewline
20 & -0.055122 & -0.5401 & 0.295195 \tabularnewline
21 & -0.07003 & -0.6862 & 0.247135 \tabularnewline
22 & -0.079755 & -0.7814 & 0.218235 \tabularnewline
23 & -0.089362 & -0.8756 & 0.191727 \tabularnewline
24 & -0.091525 & -0.8968 & 0.186045 \tabularnewline
25 & -0.098378 & -0.9639 & 0.168758 \tabularnewline
26 & -0.109342 & -1.0713 & 0.143354 \tabularnewline
27 & -0.109999 & -1.0778 & 0.141919 \tabularnewline
28 & -0.11001 & -1.0779 & 0.141895 \tabularnewline
29 & -0.102507 & -1.0044 & 0.158864 \tabularnewline
30 & -0.081646 & -0.8 & 0.212854 \tabularnewline
31 & -0.064657 & -0.6335 & 0.263955 \tabularnewline
32 & -0.052835 & -0.5177 & 0.302936 \tabularnewline
33 & -0.038752 & -0.3797 & 0.352508 \tabularnewline
34 & -0.026989 & -0.2644 & 0.396005 \tabularnewline
35 & -0.014616 & -0.1432 & 0.443213 \tabularnewline
36 & -0.004805 & -0.0471 & 0.481273 \tabularnewline
37 & -0.002224 & -0.0218 & 0.491329 \tabularnewline
38 & 0.000698 & 0.0068 & 0.497278 \tabularnewline
39 & -0.002647 & -0.0259 & 0.48968 \tabularnewline
40 & -0.001735 & -0.017 & 0.493237 \tabularnewline
41 & 0.01064 & 0.1043 & 0.458593 \tabularnewline
42 & 0.011629 & 0.1139 & 0.454762 \tabularnewline
43 & 0.007641 & 0.0749 & 0.470239 \tabularnewline
44 & 0.009028 & 0.0885 & 0.464849 \tabularnewline
45 & 0.01888 & 0.185 & 0.426815 \tabularnewline
46 & 0.037898 & 0.3713 & 0.355607 \tabularnewline
47 & 0.058331 & 0.5715 & 0.28449 \tabularnewline
48 & 0.074765 & 0.7325 & 0.232811 \tabularnewline
\hline
\end{tabular}
%Source: https://freestatistics.org/blog/index.php?pk=42646&T=1

[TABLE]
[ROW][C]Autocorrelation Function[/C][/ROW]
[ROW][C]Time lag k[/C][C]ACF(k)[/C][C]T-STAT[/C][C]P-value[/C][/ROW]
[ROW][C]1[/C][C]0.942035[/C][C]9.23[/C][C]0[/C][/ROW]
[ROW][C]2[/C][C]0.869388[/C][C]8.5182[/C][C]0[/C][/ROW]
[ROW][C]3[/C][C]0.787476[/C][C]7.7157[/C][C]0[/C][/ROW]
[ROW][C]4[/C][C]0.698726[/C][C]6.8461[/C][C]0[/C][/ROW]
[ROW][C]5[/C][C]0.625434[/C][C]6.128[/C][C]0[/C][/ROW]
[ROW][C]6[/C][C]0.556107[/C][C]5.4487[/C][C]0[/C][/ROW]
[ROW][C]7[/C][C]0.500845[/C][C]4.9073[/C][C]2e-06[/C][/ROW]
[ROW][C]8[/C][C]0.452979[/C][C]4.4383[/C][C]1.2e-05[/C][/ROW]
[ROW][C]9[/C][C]0.410439[/C][C]4.0215[/C][C]5.8e-05[/C][/ROW]
[ROW][C]10[/C][C]0.385711[/C][C]3.7792[/C][C]0.000137[/C][/ROW]
[ROW][C]11[/C][C]0.358211[/C][C]3.5097[/C][C]0.000342[/C][/ROW]
[ROW][C]12[/C][C]0.313152[/C][C]3.0683[/C][C]0.001399[/C][/ROW]
[ROW][C]13[/C][C]0.262433[/C][C]2.5713[/C][C]0.005833[/C][/ROW]
[ROW][C]14[/C][C]0.210514[/C][C]2.0626[/C][C]0.020925[/C][/ROW]
[ROW][C]15[/C][C]0.146685[/C][C]1.4372[/C][C]0.076954[/C][/ROW]
[ROW][C]16[/C][C]0.095366[/C][C]0.9344[/C][C]0.176223[/C][/ROW]
[ROW][C]17[/C][C]0.049291[/C][C]0.483[/C][C]0.315114[/C][/ROW]
[ROW][C]18[/C][C]0.005845[/C][C]0.0573[/C][C]0.477225[/C][/ROW]
[ROW][C]19[/C][C]-0.026444[/C][C]-0.2591[/C][C]0.398057[/C][/ROW]
[ROW][C]20[/C][C]-0.055122[/C][C]-0.5401[/C][C]0.295195[/C][/ROW]
[ROW][C]21[/C][C]-0.07003[/C][C]-0.6862[/C][C]0.247135[/C][/ROW]
[ROW][C]22[/C][C]-0.079755[/C][C]-0.7814[/C][C]0.218235[/C][/ROW]
[ROW][C]23[/C][C]-0.089362[/C][C]-0.8756[/C][C]0.191727[/C][/ROW]
[ROW][C]24[/C][C]-0.091525[/C][C]-0.8968[/C][C]0.186045[/C][/ROW]
[ROW][C]25[/C][C]-0.098378[/C][C]-0.9639[/C][C]0.168758[/C][/ROW]
[ROW][C]26[/C][C]-0.109342[/C][C]-1.0713[/C][C]0.143354[/C][/ROW]
[ROW][C]27[/C][C]-0.109999[/C][C]-1.0778[/C][C]0.141919[/C][/ROW]
[ROW][C]28[/C][C]-0.11001[/C][C]-1.0779[/C][C]0.141895[/C][/ROW]
[ROW][C]29[/C][C]-0.102507[/C][C]-1.0044[/C][C]0.158864[/C][/ROW]
[ROW][C]30[/C][C]-0.081646[/C][C]-0.8[/C][C]0.212854[/C][/ROW]
[ROW][C]31[/C][C]-0.064657[/C][C]-0.6335[/C][C]0.263955[/C][/ROW]
[ROW][C]32[/C][C]-0.052835[/C][C]-0.5177[/C][C]0.302936[/C][/ROW]
[ROW][C]33[/C][C]-0.038752[/C][C]-0.3797[/C][C]0.352508[/C][/ROW]
[ROW][C]34[/C][C]-0.026989[/C][C]-0.2644[/C][C]0.396005[/C][/ROW]
[ROW][C]35[/C][C]-0.014616[/C][C]-0.1432[/C][C]0.443213[/C][/ROW]
[ROW][C]36[/C][C]-0.004805[/C][C]-0.0471[/C][C]0.481273[/C][/ROW]
[ROW][C]37[/C][C]-0.002224[/C][C]-0.0218[/C][C]0.491329[/C][/ROW]
[ROW][C]38[/C][C]0.000698[/C][C]0.0068[/C][C]0.497278[/C][/ROW]
[ROW][C]39[/C][C]-0.002647[/C][C]-0.0259[/C][C]0.48968[/C][/ROW]
[ROW][C]40[/C][C]-0.001735[/C][C]-0.017[/C][C]0.493237[/C][/ROW]
[ROW][C]41[/C][C]0.01064[/C][C]0.1043[/C][C]0.458593[/C][/ROW]
[ROW][C]42[/C][C]0.011629[/C][C]0.1139[/C][C]0.454762[/C][/ROW]
[ROW][C]43[/C][C]0.007641[/C][C]0.0749[/C][C]0.470239[/C][/ROW]
[ROW][C]44[/C][C]0.009028[/C][C]0.0885[/C][C]0.464849[/C][/ROW]
[ROW][C]45[/C][C]0.01888[/C][C]0.185[/C][C]0.426815[/C][/ROW]
[ROW][C]46[/C][C]0.037898[/C][C]0.3713[/C][C]0.355607[/C][/ROW]
[ROW][C]47[/C][C]0.058331[/C][C]0.5715[/C][C]0.28449[/C][/ROW]
[ROW][C]48[/C][C]0.074765[/C][C]0.7325[/C][C]0.232811[/C][/ROW]
[/TABLE]
Source: https://freestatistics.org/blog/index.php?pk=42646&T=1

Globally Unique Identifier (entire table): ba.freestatistics.org/blog/index.php?pk=42646&T=1

As an alternative you can also use a QR Code:  

The GUIDs for individual cells are displayed in the table below:

Autocorrelation Function
Time lag kACF(k)T-STATP-value
10.9420359.230
20.8693888.51820
30.7874767.71570
40.6987266.84610
50.6254346.1280
60.5561075.44870
70.5008454.90732e-06
80.4529794.43831.2e-05
90.4104394.02155.8e-05
100.3857113.77920.000137
110.3582113.50970.000342
120.3131523.06830.001399
130.2624332.57130.005833
140.2105142.06260.020925
150.1466851.43720.076954
160.0953660.93440.176223
170.0492910.4830.315114
180.0058450.05730.477225
19-0.026444-0.25910.398057
20-0.055122-0.54010.295195
21-0.07003-0.68620.247135
22-0.079755-0.78140.218235
23-0.089362-0.87560.191727
24-0.091525-0.89680.186045
25-0.098378-0.96390.168758
26-0.109342-1.07130.143354
27-0.109999-1.07780.141919
28-0.11001-1.07790.141895
29-0.102507-1.00440.158864
30-0.081646-0.80.212854
31-0.064657-0.63350.263955
32-0.052835-0.51770.302936
33-0.038752-0.37970.352508
34-0.026989-0.26440.396005
35-0.014616-0.14320.443213
36-0.004805-0.04710.481273
37-0.002224-0.02180.491329
380.0006980.00680.497278
39-0.002647-0.02590.48968
40-0.001735-0.0170.493237
410.010640.10430.458593
420.0116290.11390.454762
430.0076410.07490.470239
440.0090280.08850.464849
450.018880.1850.426815
460.0378980.37130.355607
470.0583310.57150.28449
480.0747650.73250.232811


Partial Autocorrelation Function
Time lag kPACF(k)T-STATP-value
10.9420359.230
2-0.160261-1.57020.059826
3-0.107579-1.05410.147252
4-0.091942-0.90080.184963
50.1072331.05070.148026
6-0.033921-0.33240.370172
70.0643090.63010.265064
8-0.017393-0.17040.432522
90.0064020.06270.475056
100.10721.05030.1481
11-0.066673-0.65330.257576
12-0.199204-1.95180.026938
13-0.048973-0.47980.316216
140.0338750.33190.370341
15-0.135863-1.33120.093142
160.0832290.81550.208411
17-0.016823-0.16480.43471
18-0.049615-0.48610.313991
190.0286120.28030.389909
20-0.010777-0.10560.458061
210.0122480.120.452364
220.0071630.07020.472099
230.0089310.08750.465227
240.0105440.10330.458965
25-0.013523-0.13250.447433
26-0.022481-0.22030.413067
270.0729490.71480.238249
28-0.005983-0.05860.476687
290.0655110.64190.261242
300.084530.82820.2048
31-0.059787-0.58580.279694
32-0.086219-0.84480.200169
330.0530730.520.302127
340.0077630.07610.469764
35-0.024023-0.23540.407211
360.0278640.2730.392718
37-0.053096-0.52020.30205
38-0.011865-0.11630.453846
39-0.004097-0.04010.48403
400.0196240.19230.423966
410.0212310.2080.417826
42-0.080557-0.78930.215944
43-0.047754-0.46790.320461
440.0667880.65440.257215
450.1407621.37920.085522
460.0428590.41990.337737
47-0.014339-0.14050.444284
48-0.03608-0.35350.362241

\begin{tabular}{lllllllll}
\hline
Partial Autocorrelation Function \tabularnewline
Time lag k & PACF(k) & T-STAT & P-value \tabularnewline
1 & 0.942035 & 9.23 & 0 \tabularnewline
2 & -0.160261 & -1.5702 & 0.059826 \tabularnewline
3 & -0.107579 & -1.0541 & 0.147252 \tabularnewline
4 & -0.091942 & -0.9008 & 0.184963 \tabularnewline
5 & 0.107233 & 1.0507 & 0.148026 \tabularnewline
6 & -0.033921 & -0.3324 & 0.370172 \tabularnewline
7 & 0.064309 & 0.6301 & 0.265064 \tabularnewline
8 & -0.017393 & -0.1704 & 0.432522 \tabularnewline
9 & 0.006402 & 0.0627 & 0.475056 \tabularnewline
10 & 0.1072 & 1.0503 & 0.1481 \tabularnewline
11 & -0.066673 & -0.6533 & 0.257576 \tabularnewline
12 & -0.199204 & -1.9518 & 0.026938 \tabularnewline
13 & -0.048973 & -0.4798 & 0.316216 \tabularnewline
14 & 0.033875 & 0.3319 & 0.370341 \tabularnewline
15 & -0.135863 & -1.3312 & 0.093142 \tabularnewline
16 & 0.083229 & 0.8155 & 0.208411 \tabularnewline
17 & -0.016823 & -0.1648 & 0.43471 \tabularnewline
18 & -0.049615 & -0.4861 & 0.313991 \tabularnewline
19 & 0.028612 & 0.2803 & 0.389909 \tabularnewline
20 & -0.010777 & -0.1056 & 0.458061 \tabularnewline
21 & 0.012248 & 0.12 & 0.452364 \tabularnewline
22 & 0.007163 & 0.0702 & 0.472099 \tabularnewline
23 & 0.008931 & 0.0875 & 0.465227 \tabularnewline
24 & 0.010544 & 0.1033 & 0.458965 \tabularnewline
25 & -0.013523 & -0.1325 & 0.447433 \tabularnewline
26 & -0.022481 & -0.2203 & 0.413067 \tabularnewline
27 & 0.072949 & 0.7148 & 0.238249 \tabularnewline
28 & -0.005983 & -0.0586 & 0.476687 \tabularnewline
29 & 0.065511 & 0.6419 & 0.261242 \tabularnewline
30 & 0.08453 & 0.8282 & 0.2048 \tabularnewline
31 & -0.059787 & -0.5858 & 0.279694 \tabularnewline
32 & -0.086219 & -0.8448 & 0.200169 \tabularnewline
33 & 0.053073 & 0.52 & 0.302127 \tabularnewline
34 & 0.007763 & 0.0761 & 0.469764 \tabularnewline
35 & -0.024023 & -0.2354 & 0.407211 \tabularnewline
36 & 0.027864 & 0.273 & 0.392718 \tabularnewline
37 & -0.053096 & -0.5202 & 0.30205 \tabularnewline
38 & -0.011865 & -0.1163 & 0.453846 \tabularnewline
39 & -0.004097 & -0.0401 & 0.48403 \tabularnewline
40 & 0.019624 & 0.1923 & 0.423966 \tabularnewline
41 & 0.021231 & 0.208 & 0.417826 \tabularnewline
42 & -0.080557 & -0.7893 & 0.215944 \tabularnewline
43 & -0.047754 & -0.4679 & 0.320461 \tabularnewline
44 & 0.066788 & 0.6544 & 0.257215 \tabularnewline
45 & 0.140762 & 1.3792 & 0.085522 \tabularnewline
46 & 0.042859 & 0.4199 & 0.337737 \tabularnewline
47 & -0.014339 & -0.1405 & 0.444284 \tabularnewline
48 & -0.03608 & -0.3535 & 0.362241 \tabularnewline
\hline
\end{tabular}
%Source: https://freestatistics.org/blog/index.php?pk=42646&T=2

[TABLE]
[ROW][C]Partial Autocorrelation Function[/C][/ROW]
[ROW][C]Time lag k[/C][C]PACF(k)[/C][C]T-STAT[/C][C]P-value[/C][/ROW]
[ROW][C]1[/C][C]0.942035[/C][C]9.23[/C][C]0[/C][/ROW]
[ROW][C]2[/C][C]-0.160261[/C][C]-1.5702[/C][C]0.059826[/C][/ROW]
[ROW][C]3[/C][C]-0.107579[/C][C]-1.0541[/C][C]0.147252[/C][/ROW]
[ROW][C]4[/C][C]-0.091942[/C][C]-0.9008[/C][C]0.184963[/C][/ROW]
[ROW][C]5[/C][C]0.107233[/C][C]1.0507[/C][C]0.148026[/C][/ROW]
[ROW][C]6[/C][C]-0.033921[/C][C]-0.3324[/C][C]0.370172[/C][/ROW]
[ROW][C]7[/C][C]0.064309[/C][C]0.6301[/C][C]0.265064[/C][/ROW]
[ROW][C]8[/C][C]-0.017393[/C][C]-0.1704[/C][C]0.432522[/C][/ROW]
[ROW][C]9[/C][C]0.006402[/C][C]0.0627[/C][C]0.475056[/C][/ROW]
[ROW][C]10[/C][C]0.1072[/C][C]1.0503[/C][C]0.1481[/C][/ROW]
[ROW][C]11[/C][C]-0.066673[/C][C]-0.6533[/C][C]0.257576[/C][/ROW]
[ROW][C]12[/C][C]-0.199204[/C][C]-1.9518[/C][C]0.026938[/C][/ROW]
[ROW][C]13[/C][C]-0.048973[/C][C]-0.4798[/C][C]0.316216[/C][/ROW]
[ROW][C]14[/C][C]0.033875[/C][C]0.3319[/C][C]0.370341[/C][/ROW]
[ROW][C]15[/C][C]-0.135863[/C][C]-1.3312[/C][C]0.093142[/C][/ROW]
[ROW][C]16[/C][C]0.083229[/C][C]0.8155[/C][C]0.208411[/C][/ROW]
[ROW][C]17[/C][C]-0.016823[/C][C]-0.1648[/C][C]0.43471[/C][/ROW]
[ROW][C]18[/C][C]-0.049615[/C][C]-0.4861[/C][C]0.313991[/C][/ROW]
[ROW][C]19[/C][C]0.028612[/C][C]0.2803[/C][C]0.389909[/C][/ROW]
[ROW][C]20[/C][C]-0.010777[/C][C]-0.1056[/C][C]0.458061[/C][/ROW]
[ROW][C]21[/C][C]0.012248[/C][C]0.12[/C][C]0.452364[/C][/ROW]
[ROW][C]22[/C][C]0.007163[/C][C]0.0702[/C][C]0.472099[/C][/ROW]
[ROW][C]23[/C][C]0.008931[/C][C]0.0875[/C][C]0.465227[/C][/ROW]
[ROW][C]24[/C][C]0.010544[/C][C]0.1033[/C][C]0.458965[/C][/ROW]
[ROW][C]25[/C][C]-0.013523[/C][C]-0.1325[/C][C]0.447433[/C][/ROW]
[ROW][C]26[/C][C]-0.022481[/C][C]-0.2203[/C][C]0.413067[/C][/ROW]
[ROW][C]27[/C][C]0.072949[/C][C]0.7148[/C][C]0.238249[/C][/ROW]
[ROW][C]28[/C][C]-0.005983[/C][C]-0.0586[/C][C]0.476687[/C][/ROW]
[ROW][C]29[/C][C]0.065511[/C][C]0.6419[/C][C]0.261242[/C][/ROW]
[ROW][C]30[/C][C]0.08453[/C][C]0.8282[/C][C]0.2048[/C][/ROW]
[ROW][C]31[/C][C]-0.059787[/C][C]-0.5858[/C][C]0.279694[/C][/ROW]
[ROW][C]32[/C][C]-0.086219[/C][C]-0.8448[/C][C]0.200169[/C][/ROW]
[ROW][C]33[/C][C]0.053073[/C][C]0.52[/C][C]0.302127[/C][/ROW]
[ROW][C]34[/C][C]0.007763[/C][C]0.0761[/C][C]0.469764[/C][/ROW]
[ROW][C]35[/C][C]-0.024023[/C][C]-0.2354[/C][C]0.407211[/C][/ROW]
[ROW][C]36[/C][C]0.027864[/C][C]0.273[/C][C]0.392718[/C][/ROW]
[ROW][C]37[/C][C]-0.053096[/C][C]-0.5202[/C][C]0.30205[/C][/ROW]
[ROW][C]38[/C][C]-0.011865[/C][C]-0.1163[/C][C]0.453846[/C][/ROW]
[ROW][C]39[/C][C]-0.004097[/C][C]-0.0401[/C][C]0.48403[/C][/ROW]
[ROW][C]40[/C][C]0.019624[/C][C]0.1923[/C][C]0.423966[/C][/ROW]
[ROW][C]41[/C][C]0.021231[/C][C]0.208[/C][C]0.417826[/C][/ROW]
[ROW][C]42[/C][C]-0.080557[/C][C]-0.7893[/C][C]0.215944[/C][/ROW]
[ROW][C]43[/C][C]-0.047754[/C][C]-0.4679[/C][C]0.320461[/C][/ROW]
[ROW][C]44[/C][C]0.066788[/C][C]0.6544[/C][C]0.257215[/C][/ROW]
[ROW][C]45[/C][C]0.140762[/C][C]1.3792[/C][C]0.085522[/C][/ROW]
[ROW][C]46[/C][C]0.042859[/C][C]0.4199[/C][C]0.337737[/C][/ROW]
[ROW][C]47[/C][C]-0.014339[/C][C]-0.1405[/C][C]0.444284[/C][/ROW]
[ROW][C]48[/C][C]-0.03608[/C][C]-0.3535[/C][C]0.362241[/C][/ROW]
[/TABLE]
Source: https://freestatistics.org/blog/index.php?pk=42646&T=2

Globally Unique Identifier (entire table): ba.freestatistics.org/blog/index.php?pk=42646&T=2

As an alternative you can also use a QR Code:  

The GUIDs for individual cells are displayed in the table below:

Partial Autocorrelation Function
Time lag kPACF(k)T-STATP-value
10.9420359.230
2-0.160261-1.57020.059826
3-0.107579-1.05410.147252
4-0.091942-0.90080.184963
50.1072331.05070.148026
6-0.033921-0.33240.370172
70.0643090.63010.265064
8-0.017393-0.17040.432522
90.0064020.06270.475056
100.10721.05030.1481
11-0.066673-0.65330.257576
12-0.199204-1.95180.026938
13-0.048973-0.47980.316216
140.0338750.33190.370341
15-0.135863-1.33120.093142
160.0832290.81550.208411
17-0.016823-0.16480.43471
18-0.049615-0.48610.313991
190.0286120.28030.389909
20-0.010777-0.10560.458061
210.0122480.120.452364
220.0071630.07020.472099
230.0089310.08750.465227
240.0105440.10330.458965
25-0.013523-0.13250.447433
26-0.022481-0.22030.413067
270.0729490.71480.238249
28-0.005983-0.05860.476687
290.0655110.64190.261242
300.084530.82820.2048
31-0.059787-0.58580.279694
32-0.086219-0.84480.200169
330.0530730.520.302127
340.0077630.07610.469764
35-0.024023-0.23540.407211
360.0278640.2730.392718
37-0.053096-0.52020.30205
38-0.011865-0.11630.453846
39-0.004097-0.04010.48403
400.0196240.19230.423966
410.0212310.2080.417826
42-0.080557-0.78930.215944
43-0.047754-0.46790.320461
440.0667880.65440.257215
450.1407621.37920.085522
460.0428590.41990.337737
47-0.014339-0.14050.444284
48-0.03608-0.35350.362241


Parameters (Session):
par2 = grey ; par3 = FALSE ; par4 = Unknown ;
Parameters (R input):
par1 = 48 ; par2 = 1 ; par3 = 0 ; par4 = 0 ; par5 = 12 ;
R code (references can be found in the software module):
if (par1 == 'Default') {
par1 = 10*log10(length(x))
} else {
par1 <- as.numeric(par1)
}
par2 <- as.numeric(par2)
par3 <- as.numeric(par3)
par4 <- as.numeric(par4)
par5 <- as.numeric(par5)
if (par2 == 0) {
x <- log(x)
} else {
x <- (x ^ par2 - 1) / par2
}
if (par3 > 0) x <- diff(x,lag=1,difference=par3)
if (par4 > 0) x <- diff(x,lag=par5,difference=par4)
bitmap(file='pic1.png')
racf <- acf(x,par1,main='Autocorrelation',xlab='lags',ylab='ACF')
dev.off()
bitmap(file='pic2.png')
rpacf <- pacf(x,par1,main='Partial Autocorrelation',xlab='lags',ylab='PACF')
dev.off()
(myacf <- c(racf$acf))
(mypacf <- c(rpacf$acf))
lengthx <- length(x)
sqrtn <- sqrt(lengthx)
load(file='createtable')
a<-table.start()
a<-table.row.start(a)
a<-table.element(a,'Autocorrelation Function',4,TRUE)
a<-table.row.end(a)
a<-table.row.start(a)
a<-table.element(a,'Time lag k',header=TRUE)
a<-table.element(a,hyperlink('basics.htm','ACF(k)','click here for more information about the Autocorrelation Function'),header=TRUE)
a<-table.element(a,'T-STAT',header=TRUE)
a<-table.element(a,'P-value',header=TRUE)
a<-table.row.end(a)
for (i in 2:(par1+1)) {
a<-table.row.start(a)
a<-table.element(a,i-1,header=TRUE)
a<-table.element(a,round(myacf[i],6))
mytstat <- myacf[i]*sqrtn
a<-table.element(a,round(mytstat,4))
a<-table.element(a,round(1-pt(abs(mytstat),lengthx),6))
a<-table.row.end(a)
}
a<-table.end(a)
table.save(a,file='mytable.tab')
a<-table.start()
a<-table.row.start(a)
a<-table.element(a,'Partial Autocorrelation Function',4,TRUE)
a<-table.row.end(a)
a<-table.row.start(a)
a<-table.element(a,'Time lag k',header=TRUE)
a<-table.element(a,hyperlink('basics.htm','PACF(k)','click here for more information about the Partial Autocorrelation Function'),header=TRUE)
a<-table.element(a,'T-STAT',header=TRUE)
a<-table.element(a,'P-value',header=TRUE)
a<-table.row.end(a)
for (i in 1:par1) {
a<-table.row.start(a)
a<-table.element(a,i,header=TRUE)
a<-table.element(a,round(mypacf[i],6))
mytstat <- mypacf[i]*sqrtn
a<-table.element(a,round(mytstat,4))
a<-table.element(a,round(1-pt(abs(mytstat),lengthx),6))
a<-table.row.end(a)
}
a<-table.end(a)
table.save(a,file='mytable1.tab')