Free Statistics

of Irreproducible Research!

Author's title

Author*Unverified author*
R Software Modulerwasp_autocorrelation.wasp
Title produced by software(Partial) Autocorrelation Function
Date of computationWed, 12 Aug 2009 10:03:12 -0600
Cite this page as followsStatistical Computations at FreeStatistics.org, Office for Research Development and Education, URL https://freestatistics.org/blog/index.php?v=date/2009/Aug/12/t1250093044r5044u2imkto4pp.htm/, Retrieved Sun, 28 Apr 2024 16:40:36 +0000
Statistical Computations at FreeStatistics.org, Office for Research Development and Education, URL https://freestatistics.org/blog/index.php?pk=42586, Retrieved Sun, 28 Apr 2024 16:40:36 +0000
QR Codes:

Original text written by user:
IsPrivate?No (this computation is public)
User-defined keywords
Estimated Impact214
Family? (F = Feedback message, R = changed R code, M = changed R Module, P = changed Parameters, D = changed Data)
-       [(Partial) Autocorrelation Function] [Autocorrelatiefun...] [2009-08-12 16:03:12] [768ad88abce8b6ce0be22cfe8ac9beaf] [Current]
Feedback Forum

Post a new message
Dataseries X:
613.20
614.70
618.40
628.20
629.00
629.70
630.40
630.40
639.30
639.40
640.90
640.80
642.10
645.30
647.60
648.40
648.80
648.90
648.90
648.90
650.30
650.30
650.00
650.00
650.50
658.40
666.00
675.50
680.70
690.60
690.60
691.10
692.90
693.80
692.80
697.50
699.00
702.10
704.80
715.50
721.80
726.40
727.70
727.40
731.30
734.40
733.40
733.40
738.10
742.60
747.20
751.10
752.60
758.90
759.10
764.30
765.60
767.60
767.60
765.60
768.20
770.90
775.10
777.60
778.60
778.90
779.40
779.90
781.70
789.10
788.70
788.80
790.80
794.10
795.10
797.30
803.80
805.60
804.60
804.50
805.80
806.80
805.20
814.90
816.60
819.50
823.00
824.00
831.40
831.70
831.10
832.10
833.30
838.80
838.00
837.30
994.20
994.20
994.20
994.20
994.20
1092.60
1100.00
1100.00
1092.60
1000.70
1000.70
1000.50
1000.50
1000.50
1000.50
1000.50
1000.50
1087.70
1113.20
1116.00
1085.20
1031.30
1028.70
1027.50
1027.50
1027.50
1027.50
1027.50
1027.50
1152.20
1155.30
1154.00
1119.90
1079.30
1074.30
1069.80


Summary of computational transaction
Raw Inputview raw input (R code)
Raw Outputview raw output of R engine
Computing time2 seconds
R Server'Sir Ronald Aylmer Fisher' @ 193.190.124.24

\begin{tabular}{lllllllll}
\hline
Summary of computational transaction \tabularnewline
Raw Input & view raw input (R code)  \tabularnewline
Raw Output & view raw output of R engine  \tabularnewline
Computing time & 2 seconds \tabularnewline
R Server & 'Sir Ronald Aylmer Fisher' @ 193.190.124.24 \tabularnewline
\hline
\end{tabular}
%Source: https://freestatistics.org/blog/index.php?pk=42586&T=0

[TABLE]
[ROW][C]Summary of computational transaction[/C][/ROW]
[ROW][C]Raw Input[/C][C]view raw input (R code) [/C][/ROW]
[ROW][C]Raw Output[/C][C]view raw output of R engine [/C][/ROW]
[ROW][C]Computing time[/C][C]2 seconds[/C][/ROW]
[ROW][C]R Server[/C][C]'Sir Ronald Aylmer Fisher' @ 193.190.124.24[/C][/ROW]
[/TABLE]
Source: https://freestatistics.org/blog/index.php?pk=42586&T=0

Globally Unique Identifier (entire table): ba.freestatistics.org/blog/index.php?pk=42586&T=0

As an alternative you can also use a QR Code:  

The GUIDs for individual cells are displayed in the table below:

Summary of computational transaction
Raw Inputview raw input (R code)
Raw Outputview raw output of R engine
Computing time2 seconds
R Server'Sir Ronald Aylmer Fisher' @ 193.190.124.24


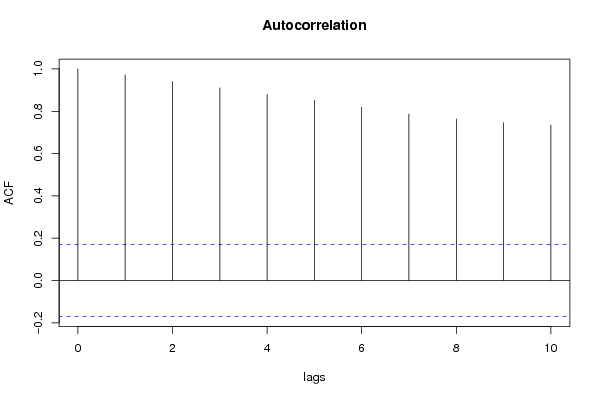
Autocorrelation Function
Time lag kACF(k)T-STATP-value
10.97198811.16730
20.94123110.81390
30.91030910.45870
40.87942310.10380
50.8515989.78410
60.8189859.40940
70.7865079.03630
80.7637758.77510
90.7459098.56980
100.7344738.43850

\begin{tabular}{lllllllll}
\hline
Autocorrelation Function \tabularnewline
Time lag k & ACF(k) & T-STAT & P-value \tabularnewline
1 & 0.971988 & 11.1673 & 0 \tabularnewline
2 & 0.941231 & 10.8139 & 0 \tabularnewline
3 & 0.910309 & 10.4587 & 0 \tabularnewline
4 & 0.879423 & 10.1038 & 0 \tabularnewline
5 & 0.851598 & 9.7841 & 0 \tabularnewline
6 & 0.818985 & 9.4094 & 0 \tabularnewline
7 & 0.786507 & 9.0363 & 0 \tabularnewline
8 & 0.763775 & 8.7751 & 0 \tabularnewline
9 & 0.745909 & 8.5698 & 0 \tabularnewline
10 & 0.734473 & 8.4385 & 0 \tabularnewline
\hline
\end{tabular}
%Source: https://freestatistics.org/blog/index.php?pk=42586&T=1

[TABLE]
[ROW][C]Autocorrelation Function[/C][/ROW]
[ROW][C]Time lag k[/C][C]ACF(k)[/C][C]T-STAT[/C][C]P-value[/C][/ROW]
[ROW][C]1[/C][C]0.971988[/C][C]11.1673[/C][C]0[/C][/ROW]
[ROW][C]2[/C][C]0.941231[/C][C]10.8139[/C][C]0[/C][/ROW]
[ROW][C]3[/C][C]0.910309[/C][C]10.4587[/C][C]0[/C][/ROW]
[ROW][C]4[/C][C]0.879423[/C][C]10.1038[/C][C]0[/C][/ROW]
[ROW][C]5[/C][C]0.851598[/C][C]9.7841[/C][C]0[/C][/ROW]
[ROW][C]6[/C][C]0.818985[/C][C]9.4094[/C][C]0[/C][/ROW]
[ROW][C]7[/C][C]0.786507[/C][C]9.0363[/C][C]0[/C][/ROW]
[ROW][C]8[/C][C]0.763775[/C][C]8.7751[/C][C]0[/C][/ROW]
[ROW][C]9[/C][C]0.745909[/C][C]8.5698[/C][C]0[/C][/ROW]
[ROW][C]10[/C][C]0.734473[/C][C]8.4385[/C][C]0[/C][/ROW]
[/TABLE]
Source: https://freestatistics.org/blog/index.php?pk=42586&T=1

Globally Unique Identifier (entire table): ba.freestatistics.org/blog/index.php?pk=42586&T=1

As an alternative you can also use a QR Code:  

The GUIDs for individual cells are displayed in the table below:

Autocorrelation Function
Time lag kACF(k)T-STATP-value
10.97198811.16730
20.94123110.81390
30.91030910.45870
40.87942310.10380
50.8515989.78410
60.8189859.40940
70.7865079.03630
80.7637758.77510
90.7459098.56980
100.7344738.43850


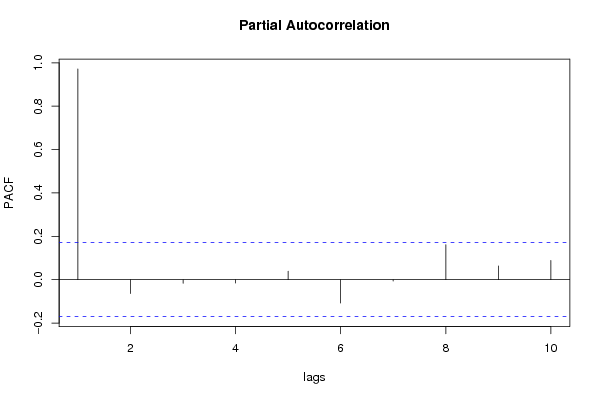
Partial Autocorrelation Function
Time lag kPACF(k)T-STATP-value
10.97198811.16730
2-0.063904-0.73420.232064
3-0.016463-0.18910.425135
4-0.01537-0.17660.430049
50.0391630.450.326742
6-0.107608-1.23630.109266
7-0.006624-0.07610.469726
80.1608771.84830.033396
90.0627850.72130.235988
100.0887851.02010.154783

\begin{tabular}{lllllllll}
\hline
Partial Autocorrelation Function \tabularnewline
Time lag k & PACF(k) & T-STAT & P-value \tabularnewline
1 & 0.971988 & 11.1673 & 0 \tabularnewline
2 & -0.063904 & -0.7342 & 0.232064 \tabularnewline
3 & -0.016463 & -0.1891 & 0.425135 \tabularnewline
4 & -0.01537 & -0.1766 & 0.430049 \tabularnewline
5 & 0.039163 & 0.45 & 0.326742 \tabularnewline
6 & -0.107608 & -1.2363 & 0.109266 \tabularnewline
7 & -0.006624 & -0.0761 & 0.469726 \tabularnewline
8 & 0.160877 & 1.8483 & 0.033396 \tabularnewline
9 & 0.062785 & 0.7213 & 0.235988 \tabularnewline
10 & 0.088785 & 1.0201 & 0.154783 \tabularnewline
\hline
\end{tabular}
%Source: https://freestatistics.org/blog/index.php?pk=42586&T=2

[TABLE]
[ROW][C]Partial Autocorrelation Function[/C][/ROW]
[ROW][C]Time lag k[/C][C]PACF(k)[/C][C]T-STAT[/C][C]P-value[/C][/ROW]
[ROW][C]1[/C][C]0.971988[/C][C]11.1673[/C][C]0[/C][/ROW]
[ROW][C]2[/C][C]-0.063904[/C][C]-0.7342[/C][C]0.232064[/C][/ROW]
[ROW][C]3[/C][C]-0.016463[/C][C]-0.1891[/C][C]0.425135[/C][/ROW]
[ROW][C]4[/C][C]-0.01537[/C][C]-0.1766[/C][C]0.430049[/C][/ROW]
[ROW][C]5[/C][C]0.039163[/C][C]0.45[/C][C]0.326742[/C][/ROW]
[ROW][C]6[/C][C]-0.107608[/C][C]-1.2363[/C][C]0.109266[/C][/ROW]
[ROW][C]7[/C][C]-0.006624[/C][C]-0.0761[/C][C]0.469726[/C][/ROW]
[ROW][C]8[/C][C]0.160877[/C][C]1.8483[/C][C]0.033396[/C][/ROW]
[ROW][C]9[/C][C]0.062785[/C][C]0.7213[/C][C]0.235988[/C][/ROW]
[ROW][C]10[/C][C]0.088785[/C][C]1.0201[/C][C]0.154783[/C][/ROW]
[/TABLE]
Source: https://freestatistics.org/blog/index.php?pk=42586&T=2

Globally Unique Identifier (entire table): ba.freestatistics.org/blog/index.php?pk=42586&T=2

As an alternative you can also use a QR Code:  

The GUIDs for individual cells are displayed in the table below:

Partial Autocorrelation Function
Time lag kPACF(k)T-STATP-value
10.97198811.16730
2-0.063904-0.73420.232064
3-0.016463-0.18910.425135
4-0.01537-0.17660.430049
50.0391630.450.326742
6-0.107608-1.23630.109266
7-0.006624-0.07610.469726
80.1608771.84830.033396
90.0627850.72130.235988
100.0887851.02010.154783


Parameters (Session):
par1 = 10 ; par2 = 1 ; par3 = 0 ; par4 = 0 ; par5 = 12 ;
Parameters (R input):
par1 = 10 ; par2 = 1 ; par3 = 0 ; par4 = 0 ; par5 = 12 ;
R code (references can be found in the software module):
if (par1 == 'Default') {
par1 = 10*log10(length(x))
} else {
par1 <- as.numeric(par1)
}
par2 <- as.numeric(par2)
par3 <- as.numeric(par3)
par4 <- as.numeric(par4)
par5 <- as.numeric(par5)
if (par2 == 0) {
x <- log(x)
} else {
x <- (x ^ par2 - 1) / par2
}
if (par3 > 0) x <- diff(x,lag=1,difference=par3)
if (par4 > 0) x <- diff(x,lag=par5,difference=par4)
bitmap(file='pic1.png')
racf <- acf(x,par1,main='Autocorrelation',xlab='lags',ylab='ACF')
dev.off()
bitmap(file='pic2.png')
rpacf <- pacf(x,par1,main='Partial Autocorrelation',xlab='lags',ylab='PACF')
dev.off()
(myacf <- c(racf$acf))
(mypacf <- c(rpacf$acf))
lengthx <- length(x)
sqrtn <- sqrt(lengthx)
load(file='createtable')
a<-table.start()
a<-table.row.start(a)
a<-table.element(a,'Autocorrelation Function',4,TRUE)
a<-table.row.end(a)
a<-table.row.start(a)
a<-table.element(a,'Time lag k',header=TRUE)
a<-table.element(a,hyperlink('basics.htm','ACF(k)','click here for more information about the Autocorrelation Function'),header=TRUE)
a<-table.element(a,'T-STAT',header=TRUE)
a<-table.element(a,'P-value',header=TRUE)
a<-table.row.end(a)
for (i in 2:(par1+1)) {
a<-table.row.start(a)
a<-table.element(a,i-1,header=TRUE)
a<-table.element(a,round(myacf[i],6))
mytstat <- myacf[i]*sqrtn
a<-table.element(a,round(mytstat,4))
a<-table.element(a,round(1-pt(abs(mytstat),lengthx),6))
a<-table.row.end(a)
}
a<-table.end(a)
table.save(a,file='mytable.tab')
a<-table.start()
a<-table.row.start(a)
a<-table.element(a,'Partial Autocorrelation Function',4,TRUE)
a<-table.row.end(a)
a<-table.row.start(a)
a<-table.element(a,'Time lag k',header=TRUE)
a<-table.element(a,hyperlink('basics.htm','PACF(k)','click here for more information about the Partial Autocorrelation Function'),header=TRUE)
a<-table.element(a,'T-STAT',header=TRUE)
a<-table.element(a,'P-value',header=TRUE)
a<-table.row.end(a)
for (i in 1:par1) {
a<-table.row.start(a)
a<-table.element(a,i,header=TRUE)
a<-table.element(a,round(mypacf[i],6))
mytstat <- mypacf[i]*sqrtn
a<-table.element(a,round(mytstat,4))
a<-table.element(a,round(1-pt(abs(mytstat),lengthx),6))
a<-table.row.end(a)
}
a<-table.end(a)
table.save(a,file='mytable1.tab')