Free Statistics

of Irreproducible Research!

Author's title

Author*Unverified author*
R Software Modulerwasp_autocorrelation.wasp
Title produced by software(Partial) Autocorrelation Function
Date of computationTue, 11 Aug 2009 11:44:48 -0600
Cite this page as followsStatistical Computations at FreeStatistics.org, Office for Research Development and Education, URL https://freestatistics.org/blog/index.php?v=date/2009/Aug/11/t1250012794pkqsqwpx9egvlwg.htm/, Retrieved Thu, 02 May 2024 01:02:02 +0000
Statistical Computations at FreeStatistics.org, Office for Research Development and Education, URL https://freestatistics.org/blog/index.php?pk=42560, Retrieved Thu, 02 May 2024 01:02:02 +0000
QR Codes:

Original text written by user:
IsPrivate?No (this computation is public)
User-defined keywords
Estimated Impact237
Family? (F = Feedback message, R = changed R code, M = changed R Module, P = changed Parameters, D = changed Data)
-       [(Partial) Autocorrelation Function] [opgave 6.3] [2009-08-11 17:44:48] [0d1085ed835696cdd537ad5fa07600ec] [Current]
Feedback Forum

Post a new message
Dataseries X:
108.87
106.38
104.77
105.38
106.74
110
110.73
115.7
115.44
113.66
118.4
116.71
119.7
114.17
110.52
111.27
111.41
111.62
113.91
118.54
122.26
120.44
121.37
121.49
125
117.24
117.18
115.15
115.27
114.6
117.48
120.8
118.62
116.79
115.46
112.83
115.56
106.66
103.39
102.65
103.22
104.1
104.32


Summary of computational transaction
Raw Inputview raw input (R code)
Raw Outputview raw output of R engine
Computing time2 seconds
R Server'Sir Ronald Aylmer Fisher' @ 193.190.124.24

\begin{tabular}{lllllllll}
\hline
Summary of computational transaction \tabularnewline
Raw Input & view raw input (R code)  \tabularnewline
Raw Output & view raw output of R engine  \tabularnewline
Computing time & 2 seconds \tabularnewline
R Server & 'Sir Ronald Aylmer Fisher' @ 193.190.124.24 \tabularnewline
\hline
\end{tabular}
%Source: https://freestatistics.org/blog/index.php?pk=42560&T=0

[TABLE]
[ROW][C]Summary of computational transaction[/C][/ROW]
[ROW][C]Raw Input[/C][C]view raw input (R code) [/C][/ROW]
[ROW][C]Raw Output[/C][C]view raw output of R engine [/C][/ROW]
[ROW][C]Computing time[/C][C]2 seconds[/C][/ROW]
[ROW][C]R Server[/C][C]'Sir Ronald Aylmer Fisher' @ 193.190.124.24[/C][/ROW]
[/TABLE]
Source: https://freestatistics.org/blog/index.php?pk=42560&T=0

Globally Unique Identifier (entire table): ba.freestatistics.org/blog/index.php?pk=42560&T=0

As an alternative you can also use a QR Code:  

The GUIDs for individual cells are displayed in the table below:

Summary of computational transaction
Raw Inputview raw input (R code)
Raw Outputview raw output of R engine
Computing time2 seconds
R Server'Sir Ronald Aylmer Fisher' @ 193.190.124.24


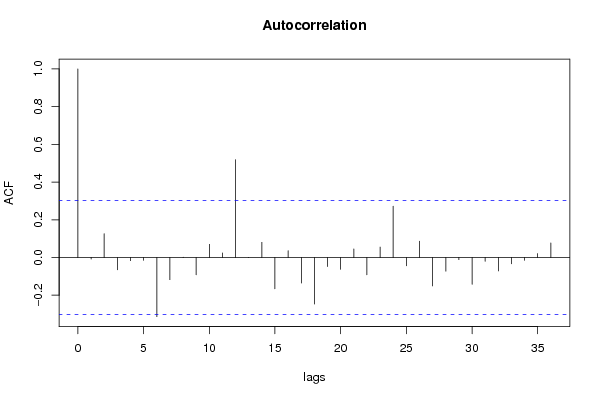
Autocorrelation Function
Time lag kACF(k)T-STATP-value
1-0.00832-0.05390.478626
20.1258580.81570.20965
3-0.065139-0.42220.337534
4-0.016727-0.10840.457097
5-0.015037-0.09750.461416
6-0.313555-2.03210.024252
7-0.117273-0.760.225746
80.0015280.00990.496074
9-0.091037-0.590.27918
100.0698090.45240.32665
110.0241510.15650.438187
120.5184973.36020.000833
130.0001560.0010.499599
140.0806480.52270.301979
15-0.165279-1.07110.145114
160.0363560.23560.407438
17-0.135145-0.87580.193049
18-0.246298-1.59620.058972
19-0.047617-0.30860.379577
20-0.061942-0.40140.345069
210.0457570.29650.384139
22-0.091264-0.59150.278693
230.0552540.35810.361036
240.2718521.76180.04269
25-0.04362-0.28270.389401
260.0869470.56350.288052
27-0.150453-0.9750.16756
28-0.072239-0.46820.321044
29-0.011238-0.07280.471143
30-0.141586-0.91760.182038
31-0.019959-0.12940.448849
32-0.070948-0.45980.324017
33-0.032711-0.2120.416569
34-0.015059-0.09760.461359
350.0208210.13490.446655
360.0774080.50170.309264

\begin{tabular}{lllllllll}
\hline
Autocorrelation Function \tabularnewline
Time lag k & ACF(k) & T-STAT & P-value \tabularnewline
1 & -0.00832 & -0.0539 & 0.478626 \tabularnewline
2 & 0.125858 & 0.8157 & 0.20965 \tabularnewline
3 & -0.065139 & -0.4222 & 0.337534 \tabularnewline
4 & -0.016727 & -0.1084 & 0.457097 \tabularnewline
5 & -0.015037 & -0.0975 & 0.461416 \tabularnewline
6 & -0.313555 & -2.0321 & 0.024252 \tabularnewline
7 & -0.117273 & -0.76 & 0.225746 \tabularnewline
8 & 0.001528 & 0.0099 & 0.496074 \tabularnewline
9 & -0.091037 & -0.59 & 0.27918 \tabularnewline
10 & 0.069809 & 0.4524 & 0.32665 \tabularnewline
11 & 0.024151 & 0.1565 & 0.438187 \tabularnewline
12 & 0.518497 & 3.3602 & 0.000833 \tabularnewline
13 & 0.000156 & 0.001 & 0.499599 \tabularnewline
14 & 0.080648 & 0.5227 & 0.301979 \tabularnewline
15 & -0.165279 & -1.0711 & 0.145114 \tabularnewline
16 & 0.036356 & 0.2356 & 0.407438 \tabularnewline
17 & -0.135145 & -0.8758 & 0.193049 \tabularnewline
18 & -0.246298 & -1.5962 & 0.058972 \tabularnewline
19 & -0.047617 & -0.3086 & 0.379577 \tabularnewline
20 & -0.061942 & -0.4014 & 0.345069 \tabularnewline
21 & 0.045757 & 0.2965 & 0.384139 \tabularnewline
22 & -0.091264 & -0.5915 & 0.278693 \tabularnewline
23 & 0.055254 & 0.3581 & 0.361036 \tabularnewline
24 & 0.271852 & 1.7618 & 0.04269 \tabularnewline
25 & -0.04362 & -0.2827 & 0.389401 \tabularnewline
26 & 0.086947 & 0.5635 & 0.288052 \tabularnewline
27 & -0.150453 & -0.975 & 0.16756 \tabularnewline
28 & -0.072239 & -0.4682 & 0.321044 \tabularnewline
29 & -0.011238 & -0.0728 & 0.471143 \tabularnewline
30 & -0.141586 & -0.9176 & 0.182038 \tabularnewline
31 & -0.019959 & -0.1294 & 0.448849 \tabularnewline
32 & -0.070948 & -0.4598 & 0.324017 \tabularnewline
33 & -0.032711 & -0.212 & 0.416569 \tabularnewline
34 & -0.015059 & -0.0976 & 0.461359 \tabularnewline
35 & 0.020821 & 0.1349 & 0.446655 \tabularnewline
36 & 0.077408 & 0.5017 & 0.309264 \tabularnewline
\hline
\end{tabular}
%Source: https://freestatistics.org/blog/index.php?pk=42560&T=1

[TABLE]
[ROW][C]Autocorrelation Function[/C][/ROW]
[ROW][C]Time lag k[/C][C]ACF(k)[/C][C]T-STAT[/C][C]P-value[/C][/ROW]
[ROW][C]1[/C][C]-0.00832[/C][C]-0.0539[/C][C]0.478626[/C][/ROW]
[ROW][C]2[/C][C]0.125858[/C][C]0.8157[/C][C]0.20965[/C][/ROW]
[ROW][C]3[/C][C]-0.065139[/C][C]-0.4222[/C][C]0.337534[/C][/ROW]
[ROW][C]4[/C][C]-0.016727[/C][C]-0.1084[/C][C]0.457097[/C][/ROW]
[ROW][C]5[/C][C]-0.015037[/C][C]-0.0975[/C][C]0.461416[/C][/ROW]
[ROW][C]6[/C][C]-0.313555[/C][C]-2.0321[/C][C]0.024252[/C][/ROW]
[ROW][C]7[/C][C]-0.117273[/C][C]-0.76[/C][C]0.225746[/C][/ROW]
[ROW][C]8[/C][C]0.001528[/C][C]0.0099[/C][C]0.496074[/C][/ROW]
[ROW][C]9[/C][C]-0.091037[/C][C]-0.59[/C][C]0.27918[/C][/ROW]
[ROW][C]10[/C][C]0.069809[/C][C]0.4524[/C][C]0.32665[/C][/ROW]
[ROW][C]11[/C][C]0.024151[/C][C]0.1565[/C][C]0.438187[/C][/ROW]
[ROW][C]12[/C][C]0.518497[/C][C]3.3602[/C][C]0.000833[/C][/ROW]
[ROW][C]13[/C][C]0.000156[/C][C]0.001[/C][C]0.499599[/C][/ROW]
[ROW][C]14[/C][C]0.080648[/C][C]0.5227[/C][C]0.301979[/C][/ROW]
[ROW][C]15[/C][C]-0.165279[/C][C]-1.0711[/C][C]0.145114[/C][/ROW]
[ROW][C]16[/C][C]0.036356[/C][C]0.2356[/C][C]0.407438[/C][/ROW]
[ROW][C]17[/C][C]-0.135145[/C][C]-0.8758[/C][C]0.193049[/C][/ROW]
[ROW][C]18[/C][C]-0.246298[/C][C]-1.5962[/C][C]0.058972[/C][/ROW]
[ROW][C]19[/C][C]-0.047617[/C][C]-0.3086[/C][C]0.379577[/C][/ROW]
[ROW][C]20[/C][C]-0.061942[/C][C]-0.4014[/C][C]0.345069[/C][/ROW]
[ROW][C]21[/C][C]0.045757[/C][C]0.2965[/C][C]0.384139[/C][/ROW]
[ROW][C]22[/C][C]-0.091264[/C][C]-0.5915[/C][C]0.278693[/C][/ROW]
[ROW][C]23[/C][C]0.055254[/C][C]0.3581[/C][C]0.361036[/C][/ROW]
[ROW][C]24[/C][C]0.271852[/C][C]1.7618[/C][C]0.04269[/C][/ROW]
[ROW][C]25[/C][C]-0.04362[/C][C]-0.2827[/C][C]0.389401[/C][/ROW]
[ROW][C]26[/C][C]0.086947[/C][C]0.5635[/C][C]0.288052[/C][/ROW]
[ROW][C]27[/C][C]-0.150453[/C][C]-0.975[/C][C]0.16756[/C][/ROW]
[ROW][C]28[/C][C]-0.072239[/C][C]-0.4682[/C][C]0.321044[/C][/ROW]
[ROW][C]29[/C][C]-0.011238[/C][C]-0.0728[/C][C]0.471143[/C][/ROW]
[ROW][C]30[/C][C]-0.141586[/C][C]-0.9176[/C][C]0.182038[/C][/ROW]
[ROW][C]31[/C][C]-0.019959[/C][C]-0.1294[/C][C]0.448849[/C][/ROW]
[ROW][C]32[/C][C]-0.070948[/C][C]-0.4598[/C][C]0.324017[/C][/ROW]
[ROW][C]33[/C][C]-0.032711[/C][C]-0.212[/C][C]0.416569[/C][/ROW]
[ROW][C]34[/C][C]-0.015059[/C][C]-0.0976[/C][C]0.461359[/C][/ROW]
[ROW][C]35[/C][C]0.020821[/C][C]0.1349[/C][C]0.446655[/C][/ROW]
[ROW][C]36[/C][C]0.077408[/C][C]0.5017[/C][C]0.309264[/C][/ROW]
[/TABLE]
Source: https://freestatistics.org/blog/index.php?pk=42560&T=1

Globally Unique Identifier (entire table): ba.freestatistics.org/blog/index.php?pk=42560&T=1

As an alternative you can also use a QR Code:  

The GUIDs for individual cells are displayed in the table below:

Autocorrelation Function
Time lag kACF(k)T-STATP-value
1-0.00832-0.05390.478626
20.1258580.81570.20965
3-0.065139-0.42220.337534
4-0.016727-0.10840.457097
5-0.015037-0.09750.461416
6-0.313555-2.03210.024252
7-0.117273-0.760.225746
80.0015280.00990.496074
9-0.091037-0.590.27918
100.0698090.45240.32665
110.0241510.15650.438187
120.5184973.36020.000833
130.0001560.0010.499599
140.0806480.52270.301979
15-0.165279-1.07110.145114
160.0363560.23560.407438
17-0.135145-0.87580.193049
18-0.246298-1.59620.058972
19-0.047617-0.30860.379577
20-0.061942-0.40140.345069
210.0457570.29650.384139
22-0.091264-0.59150.278693
230.0552540.35810.361036
240.2718521.76180.04269
25-0.04362-0.28270.389401
260.0869470.56350.288052
27-0.150453-0.9750.16756
28-0.072239-0.46820.321044
29-0.011238-0.07280.471143
30-0.141586-0.91760.182038
31-0.019959-0.12940.448849
32-0.070948-0.45980.324017
33-0.032711-0.2120.416569
34-0.015059-0.09760.461359
350.0208210.13490.446655
360.0774080.50170.309264


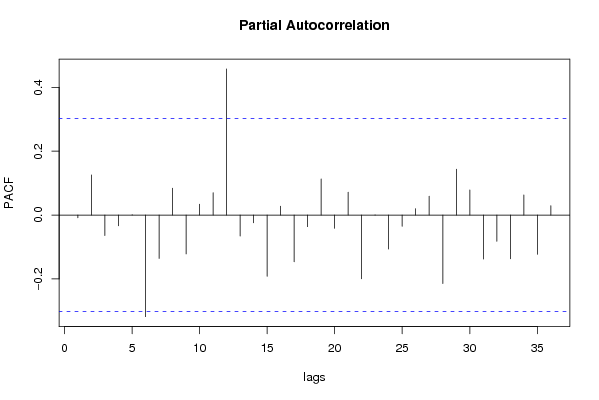
Partial Autocorrelation Function
Time lag kPACF(k)T-STATP-value
1-0.00832-0.05390.478626
20.1257980.81530.209761
3-0.064197-0.4160.339747
4-0.033654-0.21810.414203
50.0012010.00780.496914
6-0.318049-2.06120.022755
7-0.135749-0.87980.192
80.083790.5430.294993
9-0.121638-0.78830.217474
100.0341550.22130.412947
110.0699580.45340.326305
120.4575012.96490.002487
13-0.065726-0.4260.336159
14-0.023851-0.15460.43895
15-0.191542-1.24130.110685
160.0278290.18040.428871
17-0.146201-0.94750.174404
18-0.036324-0.23540.407518
190.1127970.7310.234416
20-0.041288-0.26760.395168
210.0715550.46370.322619
22-0.199189-1.29090.101901
23-0.000457-0.0030.498827
24-0.106468-0.690.246996
25-0.03506-0.22720.41068
260.0198990.1290.449003
270.0591470.38330.35171
28-0.214169-1.3880.086232
290.1438150.9320.178324
300.078330.50760.307181
31-0.137638-0.8920.188739
32-0.081837-0.53040.299326
33-0.136916-0.88730.189981
340.0630360.40850.342484
35-0.122651-0.79490.215579
360.029560.19160.424501

\begin{tabular}{lllllllll}
\hline
Partial Autocorrelation Function \tabularnewline
Time lag k & PACF(k) & T-STAT & P-value \tabularnewline
1 & -0.00832 & -0.0539 & 0.478626 \tabularnewline
2 & 0.125798 & 0.8153 & 0.209761 \tabularnewline
3 & -0.064197 & -0.416 & 0.339747 \tabularnewline
4 & -0.033654 & -0.2181 & 0.414203 \tabularnewline
5 & 0.001201 & 0.0078 & 0.496914 \tabularnewline
6 & -0.318049 & -2.0612 & 0.022755 \tabularnewline
7 & -0.135749 & -0.8798 & 0.192 \tabularnewline
8 & 0.08379 & 0.543 & 0.294993 \tabularnewline
9 & -0.121638 & -0.7883 & 0.217474 \tabularnewline
10 & 0.034155 & 0.2213 & 0.412947 \tabularnewline
11 & 0.069958 & 0.4534 & 0.326305 \tabularnewline
12 & 0.457501 & 2.9649 & 0.002487 \tabularnewline
13 & -0.065726 & -0.426 & 0.336159 \tabularnewline
14 & -0.023851 & -0.1546 & 0.43895 \tabularnewline
15 & -0.191542 & -1.2413 & 0.110685 \tabularnewline
16 & 0.027829 & 0.1804 & 0.428871 \tabularnewline
17 & -0.146201 & -0.9475 & 0.174404 \tabularnewline
18 & -0.036324 & -0.2354 & 0.407518 \tabularnewline
19 & 0.112797 & 0.731 & 0.234416 \tabularnewline
20 & -0.041288 & -0.2676 & 0.395168 \tabularnewline
21 & 0.071555 & 0.4637 & 0.322619 \tabularnewline
22 & -0.199189 & -1.2909 & 0.101901 \tabularnewline
23 & -0.000457 & -0.003 & 0.498827 \tabularnewline
24 & -0.106468 & -0.69 & 0.246996 \tabularnewline
25 & -0.03506 & -0.2272 & 0.41068 \tabularnewline
26 & 0.019899 & 0.129 & 0.449003 \tabularnewline
27 & 0.059147 & 0.3833 & 0.35171 \tabularnewline
28 & -0.214169 & -1.388 & 0.086232 \tabularnewline
29 & 0.143815 & 0.932 & 0.178324 \tabularnewline
30 & 0.07833 & 0.5076 & 0.307181 \tabularnewline
31 & -0.137638 & -0.892 & 0.188739 \tabularnewline
32 & -0.081837 & -0.5304 & 0.299326 \tabularnewline
33 & -0.136916 & -0.8873 & 0.189981 \tabularnewline
34 & 0.063036 & 0.4085 & 0.342484 \tabularnewline
35 & -0.122651 & -0.7949 & 0.215579 \tabularnewline
36 & 0.02956 & 0.1916 & 0.424501 \tabularnewline
\hline
\end{tabular}
%Source: https://freestatistics.org/blog/index.php?pk=42560&T=2

[TABLE]
[ROW][C]Partial Autocorrelation Function[/C][/ROW]
[ROW][C]Time lag k[/C][C]PACF(k)[/C][C]T-STAT[/C][C]P-value[/C][/ROW]
[ROW][C]1[/C][C]-0.00832[/C][C]-0.0539[/C][C]0.478626[/C][/ROW]
[ROW][C]2[/C][C]0.125798[/C][C]0.8153[/C][C]0.209761[/C][/ROW]
[ROW][C]3[/C][C]-0.064197[/C][C]-0.416[/C][C]0.339747[/C][/ROW]
[ROW][C]4[/C][C]-0.033654[/C][C]-0.2181[/C][C]0.414203[/C][/ROW]
[ROW][C]5[/C][C]0.001201[/C][C]0.0078[/C][C]0.496914[/C][/ROW]
[ROW][C]6[/C][C]-0.318049[/C][C]-2.0612[/C][C]0.022755[/C][/ROW]
[ROW][C]7[/C][C]-0.135749[/C][C]-0.8798[/C][C]0.192[/C][/ROW]
[ROW][C]8[/C][C]0.08379[/C][C]0.543[/C][C]0.294993[/C][/ROW]
[ROW][C]9[/C][C]-0.121638[/C][C]-0.7883[/C][C]0.217474[/C][/ROW]
[ROW][C]10[/C][C]0.034155[/C][C]0.2213[/C][C]0.412947[/C][/ROW]
[ROW][C]11[/C][C]0.069958[/C][C]0.4534[/C][C]0.326305[/C][/ROW]
[ROW][C]12[/C][C]0.457501[/C][C]2.9649[/C][C]0.002487[/C][/ROW]
[ROW][C]13[/C][C]-0.065726[/C][C]-0.426[/C][C]0.336159[/C][/ROW]
[ROW][C]14[/C][C]-0.023851[/C][C]-0.1546[/C][C]0.43895[/C][/ROW]
[ROW][C]15[/C][C]-0.191542[/C][C]-1.2413[/C][C]0.110685[/C][/ROW]
[ROW][C]16[/C][C]0.027829[/C][C]0.1804[/C][C]0.428871[/C][/ROW]
[ROW][C]17[/C][C]-0.146201[/C][C]-0.9475[/C][C]0.174404[/C][/ROW]
[ROW][C]18[/C][C]-0.036324[/C][C]-0.2354[/C][C]0.407518[/C][/ROW]
[ROW][C]19[/C][C]0.112797[/C][C]0.731[/C][C]0.234416[/C][/ROW]
[ROW][C]20[/C][C]-0.041288[/C][C]-0.2676[/C][C]0.395168[/C][/ROW]
[ROW][C]21[/C][C]0.071555[/C][C]0.4637[/C][C]0.322619[/C][/ROW]
[ROW][C]22[/C][C]-0.199189[/C][C]-1.2909[/C][C]0.101901[/C][/ROW]
[ROW][C]23[/C][C]-0.000457[/C][C]-0.003[/C][C]0.498827[/C][/ROW]
[ROW][C]24[/C][C]-0.106468[/C][C]-0.69[/C][C]0.246996[/C][/ROW]
[ROW][C]25[/C][C]-0.03506[/C][C]-0.2272[/C][C]0.41068[/C][/ROW]
[ROW][C]26[/C][C]0.019899[/C][C]0.129[/C][C]0.449003[/C][/ROW]
[ROW][C]27[/C][C]0.059147[/C][C]0.3833[/C][C]0.35171[/C][/ROW]
[ROW][C]28[/C][C]-0.214169[/C][C]-1.388[/C][C]0.086232[/C][/ROW]
[ROW][C]29[/C][C]0.143815[/C][C]0.932[/C][C]0.178324[/C][/ROW]
[ROW][C]30[/C][C]0.07833[/C][C]0.5076[/C][C]0.307181[/C][/ROW]
[ROW][C]31[/C][C]-0.137638[/C][C]-0.892[/C][C]0.188739[/C][/ROW]
[ROW][C]32[/C][C]-0.081837[/C][C]-0.5304[/C][C]0.299326[/C][/ROW]
[ROW][C]33[/C][C]-0.136916[/C][C]-0.8873[/C][C]0.189981[/C][/ROW]
[ROW][C]34[/C][C]0.063036[/C][C]0.4085[/C][C]0.342484[/C][/ROW]
[ROW][C]35[/C][C]-0.122651[/C][C]-0.7949[/C][C]0.215579[/C][/ROW]
[ROW][C]36[/C][C]0.02956[/C][C]0.1916[/C][C]0.424501[/C][/ROW]
[/TABLE]
Source: https://freestatistics.org/blog/index.php?pk=42560&T=2

Globally Unique Identifier (entire table): ba.freestatistics.org/blog/index.php?pk=42560&T=2

As an alternative you can also use a QR Code:  

The GUIDs for individual cells are displayed in the table below:

Partial Autocorrelation Function
Time lag kPACF(k)T-STATP-value
1-0.00832-0.05390.478626
20.1257980.81530.209761
3-0.064197-0.4160.339747
4-0.033654-0.21810.414203
50.0012010.00780.496914
6-0.318049-2.06120.022755
7-0.135749-0.87980.192
80.083790.5430.294993
9-0.121638-0.78830.217474
100.0341550.22130.412947
110.0699580.45340.326305
120.4575012.96490.002487
13-0.065726-0.4260.336159
14-0.023851-0.15460.43895
15-0.191542-1.24130.110685
160.0278290.18040.428871
17-0.146201-0.94750.174404
18-0.036324-0.23540.407518
190.1127970.7310.234416
20-0.041288-0.26760.395168
210.0715550.46370.322619
22-0.199189-1.29090.101901
23-0.000457-0.0030.498827
24-0.106468-0.690.246996
25-0.03506-0.22720.41068
260.0198990.1290.449003
270.0591470.38330.35171
28-0.214169-1.3880.086232
290.1438150.9320.178324
300.078330.50760.307181
31-0.137638-0.8920.188739
32-0.081837-0.53040.299326
33-0.136916-0.88730.189981
340.0630360.40850.342484
35-0.122651-0.79490.215579
360.029560.19160.424501


Parameters (Session):
Parameters (R input):
par1 = 36 ; par2 = 1 ; par3 = 1 ; par4 = 0 ; par5 = 12 ;
R code (references can be found in the software module):
if (par1 == 'Default') {
par1 = 10*log10(length(x))
} else {
par1 <- as.numeric(par1)
}
par2 <- as.numeric(par2)
par3 <- as.numeric(par3)
par4 <- as.numeric(par4)
par5 <- as.numeric(par5)
if (par2 == 0) {
x <- log(x)
} else {
x <- (x ^ par2 - 1) / par2
}
if (par3 > 0) x <- diff(x,lag=1,difference=par3)
if (par4 > 0) x <- diff(x,lag=par5,difference=par4)
bitmap(file='pic1.png')
racf <- acf(x,par1,main='Autocorrelation',xlab='lags',ylab='ACF')
dev.off()
bitmap(file='pic2.png')
rpacf <- pacf(x,par1,main='Partial Autocorrelation',xlab='lags',ylab='PACF')
dev.off()
(myacf <- c(racf$acf))
(mypacf <- c(rpacf$acf))
lengthx <- length(x)
sqrtn <- sqrt(lengthx)
load(file='createtable')
a<-table.start()
a<-table.row.start(a)
a<-table.element(a,'Autocorrelation Function',4,TRUE)
a<-table.row.end(a)
a<-table.row.start(a)
a<-table.element(a,'Time lag k',header=TRUE)
a<-table.element(a,hyperlink('basics.htm','ACF(k)','click here for more information about the Autocorrelation Function'),header=TRUE)
a<-table.element(a,'T-STAT',header=TRUE)
a<-table.element(a,'P-value',header=TRUE)
a<-table.row.end(a)
for (i in 2:(par1+1)) {
a<-table.row.start(a)
a<-table.element(a,i-1,header=TRUE)
a<-table.element(a,round(myacf[i],6))
mytstat <- myacf[i]*sqrtn
a<-table.element(a,round(mytstat,4))
a<-table.element(a,round(1-pt(abs(mytstat),lengthx),6))
a<-table.row.end(a)
}
a<-table.end(a)
table.save(a,file='mytable.tab')
a<-table.start()
a<-table.row.start(a)
a<-table.element(a,'Partial Autocorrelation Function',4,TRUE)
a<-table.row.end(a)
a<-table.row.start(a)
a<-table.element(a,'Time lag k',header=TRUE)
a<-table.element(a,hyperlink('basics.htm','PACF(k)','click here for more information about the Partial Autocorrelation Function'),header=TRUE)
a<-table.element(a,'T-STAT',header=TRUE)
a<-table.element(a,'P-value',header=TRUE)
a<-table.row.end(a)
for (i in 1:par1) {
a<-table.row.start(a)
a<-table.element(a,i,header=TRUE)
a<-table.element(a,round(mypacf[i],6))
mytstat <- mypacf[i]*sqrtn
a<-table.element(a,round(mytstat,4))
a<-table.element(a,round(1-pt(abs(mytstat),lengthx),6))
a<-table.row.end(a)
}
a<-table.end(a)
table.save(a,file='mytable1.tab')