Free Statistics

of Irreproducible Research!

Author's title

Author*Unverified author*
R Software Modulerwasp_smp.wasp
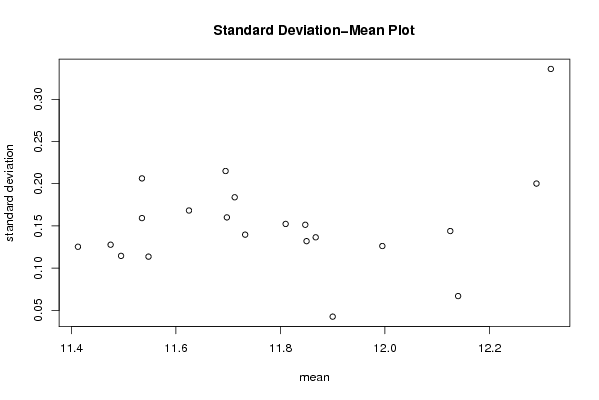
Title produced by softwareStandard Deviation-Mean Plot
Date of computationThu, 06 Aug 2009 06:17:08 -0600
Cite this page as followsStatistical Computations at FreeStatistics.org, Office for Research Development and Education, URL https://freestatistics.org/blog/index.php?v=date/2009/Aug/06/t1249561119r0ey41udbryfo8x.htm/, Retrieved Fri, 03 May 2024 17:31:06 +0000
Statistical Computations at FreeStatistics.org, Office for Research Development and Education, URL https://freestatistics.org/blog/index.php?pk=42521, Retrieved Fri, 03 May 2024 17:31:06 +0000
QR Codes:

Original text written by user:
IsPrivate?No (this computation is public)
User-defined keywords
Estimated Impact245
Family? (F = Feedback message, R = changed R code, M = changed R Module, P = changed Parameters, D = changed Data)
-     [Bootstrap Plot - Central Tendency] [Bootstrap plot ma...] [2009-08-05 15:54:55] [b61406873bd841e2047c054f7ebec102]
- RMPD  [Blocked Bootstrap Plot - Central Tendency] [Bootstrap plot ge...] [2009-08-05 18:54:30] [b61406873bd841e2047c054f7ebec102]
- RMP       [Standard Deviation-Mean Plot] [Standardeviation ...] [2009-08-06 12:17:08] [f78fa5e3827314a0edd0041d1d9dae5e] [Current]
Feedback Forum

Post a new message
Dataseries X:
11,73
11,74
11,65
11,38
11,53
11,75
11,82
11,83
11,63
11,55
11,4
11,4
11,63
11,46
11,35
11,7
11,52
11,64
11,9
11,73
11,7
11,54
11,97
11,64
11,98
11,79
11,66
11,96
11,83
12,36
12,53
12,55
12,53
12,24
12,34
12,05
12,22
12,23
11,92
12,13
12,1
12,15
12,23
12,08
12,02
11,93
12,16
11,87
11,93
11,79
11,43
11,63
11,93
11,89
11,83
11,59
12,04
11,81
11,9
11,72
11,91
11,94
11,91
11,84
12,01
11,89
11,8
11,7
11,5
11,76
11,61
11,27
11,64
11,39
11,54
11,62
11,59
11,44
11,31
11,56
11,4
11,51
11,5
11,24
11,8


Summary of computational transaction
Raw Inputview raw input (R code)
Raw Outputview raw output of R engine
Computing time1 seconds
R Server'Gwilym Jenkins' @ 72.249.127.135

\begin{tabular}{lllllllll}
\hline
Summary of computational transaction \tabularnewline
Raw Input & view raw input (R code)  \tabularnewline
Raw Output & view raw output of R engine  \tabularnewline
Computing time & 1 seconds \tabularnewline
R Server & 'Gwilym Jenkins' @ 72.249.127.135 \tabularnewline
\hline
\end{tabular}
%Source: https://freestatistics.org/blog/index.php?pk=42521&T=0

[TABLE]
[ROW][C]Summary of computational transaction[/C][/ROW]
[ROW][C]Raw Input[/C][C]view raw input (R code) [/C][/ROW]
[ROW][C]Raw Output[/C][C]view raw output of R engine [/C][/ROW]
[ROW][C]Computing time[/C][C]1 seconds[/C][/ROW]
[ROW][C]R Server[/C][C]'Gwilym Jenkins' @ 72.249.127.135[/C][/ROW]
[/TABLE]
Source: https://freestatistics.org/blog/index.php?pk=42521&T=0

Globally Unique Identifier (entire table): ba.freestatistics.org/blog/index.php?pk=42521&T=0

As an alternative you can also use a QR Code:  

The GUIDs for individual cells are displayed in the table below:

Summary of computational transaction
Raw Inputview raw input (R code)
Raw Outputview raw output of R engine
Computing time1 seconds
R Server'Gwilym Jenkins' @ 72.249.127.135


Standard Deviation-Mean Plot
SectionMeanStandard DeviationRange
111.6250.1682260384126070.359999999999999
211.73250.1396125591294230.300000000000001
311.4950.1144552314225960.230000000000000
411.5350.1592691642053370.350
511.69750.1600781059358210.380000000000001
611.71250.1839157415774960.430000000000001
711.84750.1512999228904850.32
812.31750.3359935515254220.72
912.290.2001665972800320.479999999999999
1012.1250.1438749456993820.310000000000000
1112.140.06683312551921170.150000000000000
1211.9950.1260952021291850.290000000000001
1311.6950.2150193789716020.5
1411.810.1523154621172780.34
1511.86750.1364734406395610.319999999999999
1611.90.04242640687119280.0999999999999996
1711.850.1319090595827290.310000000000000
1811.5350.2063169083392500.49
1911.54750.1135414755350070.25
2011.4750.1276714533480370.279999999999999
2111.41250.1252663828274240.270000000000000

\begin{tabular}{lllllllll}
\hline
Standard Deviation-Mean Plot \tabularnewline
Section & Mean & Standard Deviation & Range \tabularnewline
1 & 11.625 & 0.168226038412607 & 0.359999999999999 \tabularnewline
2 & 11.7325 & 0.139612559129423 & 0.300000000000001 \tabularnewline
3 & 11.495 & 0.114455231422596 & 0.230000000000000 \tabularnewline
4 & 11.535 & 0.159269164205337 & 0.350 \tabularnewline
5 & 11.6975 & 0.160078105935821 & 0.380000000000001 \tabularnewline
6 & 11.7125 & 0.183915741577496 & 0.430000000000001 \tabularnewline
7 & 11.8475 & 0.151299922890485 & 0.32 \tabularnewline
8 & 12.3175 & 0.335993551525422 & 0.72 \tabularnewline
9 & 12.29 & 0.200166597280032 & 0.479999999999999 \tabularnewline
10 & 12.125 & 0.143874945699382 & 0.310000000000000 \tabularnewline
11 & 12.14 & 0.0668331255192117 & 0.150000000000000 \tabularnewline
12 & 11.995 & 0.126095202129185 & 0.290000000000001 \tabularnewline
13 & 11.695 & 0.215019378971602 & 0.5 \tabularnewline
14 & 11.81 & 0.152315462117278 & 0.34 \tabularnewline
15 & 11.8675 & 0.136473440639561 & 0.319999999999999 \tabularnewline
16 & 11.9 & 0.0424264068711928 & 0.0999999999999996 \tabularnewline
17 & 11.85 & 0.131909059582729 & 0.310000000000000 \tabularnewline
18 & 11.535 & 0.206316908339250 & 0.49 \tabularnewline
19 & 11.5475 & 0.113541475535007 & 0.25 \tabularnewline
20 & 11.475 & 0.127671453348037 & 0.279999999999999 \tabularnewline
21 & 11.4125 & 0.125266382827424 & 0.270000000000000 \tabularnewline
\hline
\end{tabular}
%Source: https://freestatistics.org/blog/index.php?pk=42521&T=1

[TABLE]
[ROW][C]Standard Deviation-Mean Plot[/C][/ROW]
[ROW][C]Section[/C][C]Mean[/C][C]Standard Deviation[/C][C]Range[/C][/ROW]
[ROW][C]1[/C][C]11.625[/C][C]0.168226038412607[/C][C]0.359999999999999[/C][/ROW]
[ROW][C]2[/C][C]11.7325[/C][C]0.139612559129423[/C][C]0.300000000000001[/C][/ROW]
[ROW][C]3[/C][C]11.495[/C][C]0.114455231422596[/C][C]0.230000000000000[/C][/ROW]
[ROW][C]4[/C][C]11.535[/C][C]0.159269164205337[/C][C]0.350[/C][/ROW]
[ROW][C]5[/C][C]11.6975[/C][C]0.160078105935821[/C][C]0.380000000000001[/C][/ROW]
[ROW][C]6[/C][C]11.7125[/C][C]0.183915741577496[/C][C]0.430000000000001[/C][/ROW]
[ROW][C]7[/C][C]11.8475[/C][C]0.151299922890485[/C][C]0.32[/C][/ROW]
[ROW][C]8[/C][C]12.3175[/C][C]0.335993551525422[/C][C]0.72[/C][/ROW]
[ROW][C]9[/C][C]12.29[/C][C]0.200166597280032[/C][C]0.479999999999999[/C][/ROW]
[ROW][C]10[/C][C]12.125[/C][C]0.143874945699382[/C][C]0.310000000000000[/C][/ROW]
[ROW][C]11[/C][C]12.14[/C][C]0.0668331255192117[/C][C]0.150000000000000[/C][/ROW]
[ROW][C]12[/C][C]11.995[/C][C]0.126095202129185[/C][C]0.290000000000001[/C][/ROW]
[ROW][C]13[/C][C]11.695[/C][C]0.215019378971602[/C][C]0.5[/C][/ROW]
[ROW][C]14[/C][C]11.81[/C][C]0.152315462117278[/C][C]0.34[/C][/ROW]
[ROW][C]15[/C][C]11.8675[/C][C]0.136473440639561[/C][C]0.319999999999999[/C][/ROW]
[ROW][C]16[/C][C]11.9[/C][C]0.0424264068711928[/C][C]0.0999999999999996[/C][/ROW]
[ROW][C]17[/C][C]11.85[/C][C]0.131909059582729[/C][C]0.310000000000000[/C][/ROW]
[ROW][C]18[/C][C]11.535[/C][C]0.206316908339250[/C][C]0.49[/C][/ROW]
[ROW][C]19[/C][C]11.5475[/C][C]0.113541475535007[/C][C]0.25[/C][/ROW]
[ROW][C]20[/C][C]11.475[/C][C]0.127671453348037[/C][C]0.279999999999999[/C][/ROW]
[ROW][C]21[/C][C]11.4125[/C][C]0.125266382827424[/C][C]0.270000000000000[/C][/ROW]
[/TABLE]
Source: https://freestatistics.org/blog/index.php?pk=42521&T=1

Globally Unique Identifier (entire table): ba.freestatistics.org/blog/index.php?pk=42521&T=1

As an alternative you can also use a QR Code:  

The GUIDs for individual cells are displayed in the table below:

Standard Deviation-Mean Plot
SectionMeanStandard DeviationRange
111.6250.1682260384126070.359999999999999
211.73250.1396125591294230.300000000000001
311.4950.1144552314225960.230000000000000
411.5350.1592691642053370.350
511.69750.1600781059358210.380000000000001
611.71250.1839157415774960.430000000000001
711.84750.1512999228904850.32
812.31750.3359935515254220.72
912.290.2001665972800320.479999999999999
1012.1250.1438749456993820.310000000000000
1112.140.06683312551921170.150000000000000
1211.9950.1260952021291850.290000000000001
1311.6950.2150193789716020.5
1411.810.1523154621172780.34
1511.86750.1364734406395610.319999999999999
1611.90.04242640687119280.0999999999999996
1711.850.1319090595827290.310000000000000
1811.5350.2063169083392500.49
1911.54750.1135414755350070.25
2011.4750.1276714533480370.279999999999999
2111.41250.1252663828274240.270000000000000


Regression: S.E.(k) = alpha + beta * Mean(k)
alpha-0.520960684086601
beta0.0571108601190513
S.D.0.0493606758364747
T-STAT1.15701130811604
p-value0.261607610760082

\begin{tabular}{lllllllll}
\hline
Regression: S.E.(k) = alpha + beta * Mean(k) \tabularnewline
alpha & -0.520960684086601 \tabularnewline
beta & 0.0571108601190513 \tabularnewline
S.D. & 0.0493606758364747 \tabularnewline
T-STAT & 1.15701130811604 \tabularnewline
p-value & 0.261607610760082 \tabularnewline
\hline
\end{tabular}
%Source: https://freestatistics.org/blog/index.php?pk=42521&T=2

[TABLE]
[ROW][C]Regression: S.E.(k) = alpha + beta * Mean(k)[/C][/ROW]
[ROW][C]alpha[/C][C]-0.520960684086601[/C][/ROW]
[ROW][C]beta[/C][C]0.0571108601190513[/C][/ROW]
[ROW][C]S.D.[/C][C]0.0493606758364747[/C][/ROW]
[ROW][C]T-STAT[/C][C]1.15701130811604[/C][/ROW]
[ROW][C]p-value[/C][C]0.261607610760082[/C][/ROW]
[/TABLE]
Source: https://freestatistics.org/blog/index.php?pk=42521&T=2

Globally Unique Identifier (entire table): ba.freestatistics.org/blog/index.php?pk=42521&T=2

As an alternative you can also use a QR Code:  

The GUIDs for individual cells are displayed in the table below:

Regression: S.E.(k) = alpha + beta * Mean(k)
alpha-0.520960684086601
beta0.0571108601190513
S.D.0.0493606758364747
T-STAT1.15701130811604
p-value0.261607610760082


Regression: ln S.E.(k) = alpha + beta * ln Mean(k)
alpha-5.63389371941178
beta1.49090968935494
S.D.4.26853047315966
T-STAT0.349279382853119
p-value0.73072081645661
Lambda-0.490909689354938

\begin{tabular}{lllllllll}
\hline
Regression: ln S.E.(k) = alpha + beta * ln Mean(k) \tabularnewline
alpha & -5.63389371941178 \tabularnewline
beta & 1.49090968935494 \tabularnewline
S.D. & 4.26853047315966 \tabularnewline
T-STAT & 0.349279382853119 \tabularnewline
p-value & 0.73072081645661 \tabularnewline
Lambda & -0.490909689354938 \tabularnewline
\hline
\end{tabular}
%Source: https://freestatistics.org/blog/index.php?pk=42521&T=3

[TABLE]
[ROW][C]Regression: ln S.E.(k) = alpha + beta * ln Mean(k)[/C][/ROW]
[ROW][C]alpha[/C][C]-5.63389371941178[/C][/ROW]
[ROW][C]beta[/C][C]1.49090968935494[/C][/ROW]
[ROW][C]S.D.[/C][C]4.26853047315966[/C][/ROW]
[ROW][C]T-STAT[/C][C]0.349279382853119[/C][/ROW]
[ROW][C]p-value[/C][C]0.73072081645661[/C][/ROW]
[ROW][C]Lambda[/C][C]-0.490909689354938[/C][/ROW]
[/TABLE]
Source: https://freestatistics.org/blog/index.php?pk=42521&T=3

Globally Unique Identifier (entire table): ba.freestatistics.org/blog/index.php?pk=42521&T=3

As an alternative you can also use a QR Code:  

The GUIDs for individual cells are displayed in the table below:

Regression: ln S.E.(k) = alpha + beta * ln Mean(k)
alpha-5.63389371941178
beta1.49090968935494
S.D.4.26853047315966
T-STAT0.349279382853119
p-value0.73072081645661
Lambda-0.490909689354938


Parameters (Session):
par1 = 4 ;
Parameters (R input):
par1 = 4 ;
R code (references can be found in the software module):
par1 <- as.numeric(par1)
(n <- length(x))
(np <- floor(n / par1))
arr <- array(NA,dim=c(par1,np))
j <- 0
k <- 1
for (i in 1:(np*par1))
{
j = j + 1
arr[j,k] <- x[i]
if (j == par1) {
j = 0
k=k+1
}
}
arr
arr.mean <- array(NA,dim=np)
arr.sd <- array(NA,dim=np)
arr.range <- array(NA,dim=np)
for (j in 1:np)
{
arr.mean[j] <- mean(arr[,j],na.rm=TRUE)
arr.sd[j] <- sd(arr[,j],na.rm=TRUE)
arr.range[j] <- max(arr[,j],na.rm=TRUE) - min(arr[,j],na.rm=TRUE)
}
arr.mean
arr.sd
arr.range
(lm1 <- lm(arr.sd~arr.mean))
(lnlm1 <- lm(log(arr.sd)~log(arr.mean)))
(lm2 <- lm(arr.range~arr.mean))
bitmap(file='test1.png')
plot(arr.mean,arr.sd,main='Standard Deviation-Mean Plot',xlab='mean',ylab='standard deviation')
dev.off()
bitmap(file='test2.png')
plot(arr.mean,arr.range,main='Range-Mean Plot',xlab='mean',ylab='range')
dev.off()
load(file='createtable')
a<-table.start()
a<-table.row.start(a)
a<-table.element(a,'Standard Deviation-Mean Plot',4,TRUE)
a<-table.row.end(a)
a<-table.row.start(a)
a<-table.element(a,'Section',header=TRUE)
a<-table.element(a,'Mean',header=TRUE)
a<-table.element(a,'Standard Deviation',header=TRUE)
a<-table.element(a,'Range',header=TRUE)
a<-table.row.end(a)
for (j in 1:np) {
a<-table.row.start(a)
a<-table.element(a,j,header=TRUE)
a<-table.element(a,arr.mean[j])
a<-table.element(a,arr.sd[j] )
a<-table.element(a,arr.range[j] )
a<-table.row.end(a)
}
a<-table.end(a)
table.save(a,file='mytable.tab')
a<-table.start()
a<-table.row.start(a)
a<-table.element(a,'Regression: S.E.(k) = alpha + beta * Mean(k)',2,TRUE)
a<-table.row.end(a)
a<-table.row.start(a)
a<-table.element(a,'alpha',header=TRUE)
a<-table.element(a,lm1$coefficients[[1]])
a<-table.row.end(a)
a<-table.row.start(a)
a<-table.element(a,'beta',header=TRUE)
a<-table.element(a,lm1$coefficients[[2]])
a<-table.row.end(a)
a<-table.row.start(a)
a<-table.element(a,'S.D.',header=TRUE)
a<-table.element(a,summary(lm1)$coefficients[2,2])
a<-table.row.end(a)
a<-table.row.start(a)
a<-table.element(a,'T-STAT',header=TRUE)
a<-table.element(a,summary(lm1)$coefficients[2,3])
a<-table.row.end(a)
a<-table.row.start(a)
a<-table.element(a,'p-value',header=TRUE)
a<-table.element(a,summary(lm1)$coefficients[2,4])
a<-table.row.end(a)
a<-table.end(a)
table.save(a,file='mytable1.tab')
a<-table.start()
a<-table.row.start(a)
a<-table.element(a,'Regression: ln S.E.(k) = alpha + beta * ln Mean(k)',2,TRUE)
a<-table.row.end(a)
a<-table.row.start(a)
a<-table.element(a,'alpha',header=TRUE)
a<-table.element(a,lnlm1$coefficients[[1]])
a<-table.row.end(a)
a<-table.row.start(a)
a<-table.element(a,'beta',header=TRUE)
a<-table.element(a,lnlm1$coefficients[[2]])
a<-table.row.end(a)
a<-table.row.start(a)
a<-table.element(a,'S.D.',header=TRUE)
a<-table.element(a,summary(lnlm1)$coefficients[2,2])
a<-table.row.end(a)
a<-table.row.start(a)
a<-table.element(a,'T-STAT',header=TRUE)
a<-table.element(a,summary(lnlm1)$coefficients[2,3])
a<-table.row.end(a)
a<-table.row.start(a)
a<-table.element(a,'p-value',header=TRUE)
a<-table.element(a,summary(lnlm1)$coefficients[2,4])
a<-table.row.end(a)
a<-table.row.start(a)
a<-table.element(a,'Lambda',header=TRUE)
a<-table.element(a,1-lnlm1$coefficients[[2]])
a<-table.row.end(a)
a<-table.end(a)
table.save(a,file='mytable2.tab')