Free Statistics

of Irreproducible Research!

Author's title

Author*Unverified author*
R Software Modulerwasp_autocorrelation.wasp
Title produced by software(Partial) Autocorrelation Function
Date of computationMon, 03 Aug 2009 03:50:44 -0600
Cite this page as followsStatistical Computations at FreeStatistics.org, Office for Research Development and Education, URL https://freestatistics.org/blog/index.php?v=date/2009/Aug/03/t12492930806x0rpaes6dpbu35.htm/, Retrieved Sat, 27 Apr 2024 23:27:22 +0000
Statistical Computations at FreeStatistics.org, Office for Research Development and Education, URL https://freestatistics.org/blog/index.php?pk=42454, Retrieved Sat, 27 Apr 2024 23:27:22 +0000
QR Codes:

Original text written by user:
IsPrivate?No (this computation is public)
User-defined keywordsroze garnalen
Estimated Impact252
Family? (F = Feedback message, R = changed R code, M = changed R Module, P = changed Parameters, D = changed Data)
-       [(Partial) Autocorrelation Function] [Vermeulennickopga...] [2009-08-03 09:50:44] [0d1085ed835696cdd537ad5fa07600ec] [Current]
Feedback Forum

Post a new message
Dataseries X:
106.61
107.86
108.07
109.68
108.57
108.08
109.8
110.7
110.72
109.85
109.71
110
110.87
111.16
110.63
110.26
110.79
111.75
111.75
112.31
112.29
111.86
111.22
112.42
111.94
112.77
113.99
114.22
112.38
114.98
115.94
117.63
117.76
118.11
120.88
121.87
122.34
122.42
122.17
121.99
124.96
125.94
126.59
127.11
125.44
125.53
125.35
124.3
123.62
124
124.47
126.89
124.87
124.55
125.31
126.02
125.31
125.3
123.83
124.49
124.92
125.77
127.27
127.35
126.05
126.84
127.75
126.78
126.98
127.89
127.9
128.06
125.39
128.13
127.97
127.56
126.89
127.8
128.05
128.98
128.55
129.35
129.97
130.89
129.8
132.32
131.1
131.44
132.55
133.35
132.53
131.11
130.02
128.91
129.98
130.91


Summary of computational transaction
Raw Inputview raw input (R code)
Raw Outputview raw output of R engine
Computing time0 seconds
R Server'Gwilym Jenkins' @ 72.249.127.135

\begin{tabular}{lllllllll}
\hline
Summary of computational transaction \tabularnewline
Raw Input & view raw input (R code)  \tabularnewline
Raw Output & view raw output of R engine  \tabularnewline
Computing time & 0 seconds \tabularnewline
R Server & 'Gwilym Jenkins' @ 72.249.127.135 \tabularnewline
\hline
\end{tabular}
%Source: https://freestatistics.org/blog/index.php?pk=42454&T=0

[TABLE]
[ROW][C]Summary of computational transaction[/C][/ROW]
[ROW][C]Raw Input[/C][C]view raw input (R code) [/C][/ROW]
[ROW][C]Raw Output[/C][C]view raw output of R engine [/C][/ROW]
[ROW][C]Computing time[/C][C]0 seconds[/C][/ROW]
[ROW][C]R Server[/C][C]'Gwilym Jenkins' @ 72.249.127.135[/C][/ROW]
[/TABLE]
Source: https://freestatistics.org/blog/index.php?pk=42454&T=0

Globally Unique Identifier (entire table): ba.freestatistics.org/blog/index.php?pk=42454&T=0

As an alternative you can also use a QR Code:  

The GUIDs for individual cells are displayed in the table below:

Summary of computational transaction
Raw Inputview raw input (R code)
Raw Outputview raw output of R engine
Computing time0 seconds
R Server'Gwilym Jenkins' @ 72.249.127.135


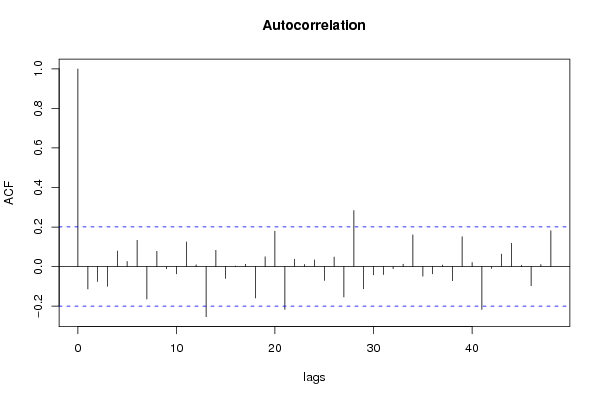
Autocorrelation Function
Time lag kACF(k)T-STATP-value
1-0.113735-1.10860.135211
2-0.075419-0.73510.232047
3-0.099965-0.97430.166182
40.0779910.76020.22452
50.0255570.24910.401913
60.1326361.29280.099611
7-0.165002-1.60820.055551
80.0771860.75230.22686
9-0.011965-0.11660.453702
10-0.037126-0.36190.359132
110.1243541.21210.114249
120.0086160.0840.466626
13-0.253801-2.47370.007573
140.0818030.79730.213628
15-0.060085-0.58560.279755
160.0024950.02430.490323
170.0112020.10920.456642
18-0.158773-1.54750.062531
190.0492060.47960.316306
200.1791.74470.042137
21-0.217538-2.12030.018293
220.0370920.36150.359255
230.0107360.10460.458442
240.0333620.32520.372881
25-0.070828-0.69030.24583
260.0481260.46910.320045
27-0.154005-1.50110.068329
280.2831352.75970.003472
29-0.112948-1.10090.136865
30-0.041958-0.4090.341746
31-0.040584-0.39560.346656
32-0.010904-0.10630.457794
330.0116740.11380.454825
340.1596551.55610.061502
35-0.049205-0.47960.316309
36-0.037018-0.36080.359522
370.0076680.07470.470288
38-0.071592-0.69780.243505
390.1508061.46990.072449
400.0199490.19440.423126
41-0.217222-2.11720.018427
42-0.009724-0.09480.462346
430.0627350.61150.271176
440.1172051.14240.128085
450.0070610.06880.472637
46-0.096999-0.94540.17342
470.0096590.09410.462596
480.181551.76950.040007

\begin{tabular}{lllllllll}
\hline
Autocorrelation Function \tabularnewline
Time lag k & ACF(k) & T-STAT & P-value \tabularnewline
1 & -0.113735 & -1.1086 & 0.135211 \tabularnewline
2 & -0.075419 & -0.7351 & 0.232047 \tabularnewline
3 & -0.099965 & -0.9743 & 0.166182 \tabularnewline
4 & 0.077991 & 0.7602 & 0.22452 \tabularnewline
5 & 0.025557 & 0.2491 & 0.401913 \tabularnewline
6 & 0.132636 & 1.2928 & 0.099611 \tabularnewline
7 & -0.165002 & -1.6082 & 0.055551 \tabularnewline
8 & 0.077186 & 0.7523 & 0.22686 \tabularnewline
9 & -0.011965 & -0.1166 & 0.453702 \tabularnewline
10 & -0.037126 & -0.3619 & 0.359132 \tabularnewline
11 & 0.124354 & 1.2121 & 0.114249 \tabularnewline
12 & 0.008616 & 0.084 & 0.466626 \tabularnewline
13 & -0.253801 & -2.4737 & 0.007573 \tabularnewline
14 & 0.081803 & 0.7973 & 0.213628 \tabularnewline
15 & -0.060085 & -0.5856 & 0.279755 \tabularnewline
16 & 0.002495 & 0.0243 & 0.490323 \tabularnewline
17 & 0.011202 & 0.1092 & 0.456642 \tabularnewline
18 & -0.158773 & -1.5475 & 0.062531 \tabularnewline
19 & 0.049206 & 0.4796 & 0.316306 \tabularnewline
20 & 0.179 & 1.7447 & 0.042137 \tabularnewline
21 & -0.217538 & -2.1203 & 0.018293 \tabularnewline
22 & 0.037092 & 0.3615 & 0.359255 \tabularnewline
23 & 0.010736 & 0.1046 & 0.458442 \tabularnewline
24 & 0.033362 & 0.3252 & 0.372881 \tabularnewline
25 & -0.070828 & -0.6903 & 0.24583 \tabularnewline
26 & 0.048126 & 0.4691 & 0.320045 \tabularnewline
27 & -0.154005 & -1.5011 & 0.068329 \tabularnewline
28 & 0.283135 & 2.7597 & 0.003472 \tabularnewline
29 & -0.112948 & -1.1009 & 0.136865 \tabularnewline
30 & -0.041958 & -0.409 & 0.341746 \tabularnewline
31 & -0.040584 & -0.3956 & 0.346656 \tabularnewline
32 & -0.010904 & -0.1063 & 0.457794 \tabularnewline
33 & 0.011674 & 0.1138 & 0.454825 \tabularnewline
34 & 0.159655 & 1.5561 & 0.061502 \tabularnewline
35 & -0.049205 & -0.4796 & 0.316309 \tabularnewline
36 & -0.037018 & -0.3608 & 0.359522 \tabularnewline
37 & 0.007668 & 0.0747 & 0.470288 \tabularnewline
38 & -0.071592 & -0.6978 & 0.243505 \tabularnewline
39 & 0.150806 & 1.4699 & 0.072449 \tabularnewline
40 & 0.019949 & 0.1944 & 0.423126 \tabularnewline
41 & -0.217222 & -2.1172 & 0.018427 \tabularnewline
42 & -0.009724 & -0.0948 & 0.462346 \tabularnewline
43 & 0.062735 & 0.6115 & 0.271176 \tabularnewline
44 & 0.117205 & 1.1424 & 0.128085 \tabularnewline
45 & 0.007061 & 0.0688 & 0.472637 \tabularnewline
46 & -0.096999 & -0.9454 & 0.17342 \tabularnewline
47 & 0.009659 & 0.0941 & 0.462596 \tabularnewline
48 & 0.18155 & 1.7695 & 0.040007 \tabularnewline
\hline
\end{tabular}
%Source: https://freestatistics.org/blog/index.php?pk=42454&T=1

[TABLE]
[ROW][C]Autocorrelation Function[/C][/ROW]
[ROW][C]Time lag k[/C][C]ACF(k)[/C][C]T-STAT[/C][C]P-value[/C][/ROW]
[ROW][C]1[/C][C]-0.113735[/C][C]-1.1086[/C][C]0.135211[/C][/ROW]
[ROW][C]2[/C][C]-0.075419[/C][C]-0.7351[/C][C]0.232047[/C][/ROW]
[ROW][C]3[/C][C]-0.099965[/C][C]-0.9743[/C][C]0.166182[/C][/ROW]
[ROW][C]4[/C][C]0.077991[/C][C]0.7602[/C][C]0.22452[/C][/ROW]
[ROW][C]5[/C][C]0.025557[/C][C]0.2491[/C][C]0.401913[/C][/ROW]
[ROW][C]6[/C][C]0.132636[/C][C]1.2928[/C][C]0.099611[/C][/ROW]
[ROW][C]7[/C][C]-0.165002[/C][C]-1.6082[/C][C]0.055551[/C][/ROW]
[ROW][C]8[/C][C]0.077186[/C][C]0.7523[/C][C]0.22686[/C][/ROW]
[ROW][C]9[/C][C]-0.011965[/C][C]-0.1166[/C][C]0.453702[/C][/ROW]
[ROW][C]10[/C][C]-0.037126[/C][C]-0.3619[/C][C]0.359132[/C][/ROW]
[ROW][C]11[/C][C]0.124354[/C][C]1.2121[/C][C]0.114249[/C][/ROW]
[ROW][C]12[/C][C]0.008616[/C][C]0.084[/C][C]0.466626[/C][/ROW]
[ROW][C]13[/C][C]-0.253801[/C][C]-2.4737[/C][C]0.007573[/C][/ROW]
[ROW][C]14[/C][C]0.081803[/C][C]0.7973[/C][C]0.213628[/C][/ROW]
[ROW][C]15[/C][C]-0.060085[/C][C]-0.5856[/C][C]0.279755[/C][/ROW]
[ROW][C]16[/C][C]0.002495[/C][C]0.0243[/C][C]0.490323[/C][/ROW]
[ROW][C]17[/C][C]0.011202[/C][C]0.1092[/C][C]0.456642[/C][/ROW]
[ROW][C]18[/C][C]-0.158773[/C][C]-1.5475[/C][C]0.062531[/C][/ROW]
[ROW][C]19[/C][C]0.049206[/C][C]0.4796[/C][C]0.316306[/C][/ROW]
[ROW][C]20[/C][C]0.179[/C][C]1.7447[/C][C]0.042137[/C][/ROW]
[ROW][C]21[/C][C]-0.217538[/C][C]-2.1203[/C][C]0.018293[/C][/ROW]
[ROW][C]22[/C][C]0.037092[/C][C]0.3615[/C][C]0.359255[/C][/ROW]
[ROW][C]23[/C][C]0.010736[/C][C]0.1046[/C][C]0.458442[/C][/ROW]
[ROW][C]24[/C][C]0.033362[/C][C]0.3252[/C][C]0.372881[/C][/ROW]
[ROW][C]25[/C][C]-0.070828[/C][C]-0.6903[/C][C]0.24583[/C][/ROW]
[ROW][C]26[/C][C]0.048126[/C][C]0.4691[/C][C]0.320045[/C][/ROW]
[ROW][C]27[/C][C]-0.154005[/C][C]-1.5011[/C][C]0.068329[/C][/ROW]
[ROW][C]28[/C][C]0.283135[/C][C]2.7597[/C][C]0.003472[/C][/ROW]
[ROW][C]29[/C][C]-0.112948[/C][C]-1.1009[/C][C]0.136865[/C][/ROW]
[ROW][C]30[/C][C]-0.041958[/C][C]-0.409[/C][C]0.341746[/C][/ROW]
[ROW][C]31[/C][C]-0.040584[/C][C]-0.3956[/C][C]0.346656[/C][/ROW]
[ROW][C]32[/C][C]-0.010904[/C][C]-0.1063[/C][C]0.457794[/C][/ROW]
[ROW][C]33[/C][C]0.011674[/C][C]0.1138[/C][C]0.454825[/C][/ROW]
[ROW][C]34[/C][C]0.159655[/C][C]1.5561[/C][C]0.061502[/C][/ROW]
[ROW][C]35[/C][C]-0.049205[/C][C]-0.4796[/C][C]0.316309[/C][/ROW]
[ROW][C]36[/C][C]-0.037018[/C][C]-0.3608[/C][C]0.359522[/C][/ROW]
[ROW][C]37[/C][C]0.007668[/C][C]0.0747[/C][C]0.470288[/C][/ROW]
[ROW][C]38[/C][C]-0.071592[/C][C]-0.6978[/C][C]0.243505[/C][/ROW]
[ROW][C]39[/C][C]0.150806[/C][C]1.4699[/C][C]0.072449[/C][/ROW]
[ROW][C]40[/C][C]0.019949[/C][C]0.1944[/C][C]0.423126[/C][/ROW]
[ROW][C]41[/C][C]-0.217222[/C][C]-2.1172[/C][C]0.018427[/C][/ROW]
[ROW][C]42[/C][C]-0.009724[/C][C]-0.0948[/C][C]0.462346[/C][/ROW]
[ROW][C]43[/C][C]0.062735[/C][C]0.6115[/C][C]0.271176[/C][/ROW]
[ROW][C]44[/C][C]0.117205[/C][C]1.1424[/C][C]0.128085[/C][/ROW]
[ROW][C]45[/C][C]0.007061[/C][C]0.0688[/C][C]0.472637[/C][/ROW]
[ROW][C]46[/C][C]-0.096999[/C][C]-0.9454[/C][C]0.17342[/C][/ROW]
[ROW][C]47[/C][C]0.009659[/C][C]0.0941[/C][C]0.462596[/C][/ROW]
[ROW][C]48[/C][C]0.18155[/C][C]1.7695[/C][C]0.040007[/C][/ROW]
[/TABLE]
Source: https://freestatistics.org/blog/index.php?pk=42454&T=1

Globally Unique Identifier (entire table): ba.freestatistics.org/blog/index.php?pk=42454&T=1

As an alternative you can also use a QR Code:  

The GUIDs for individual cells are displayed in the table below:

Autocorrelation Function
Time lag kACF(k)T-STATP-value
1-0.113735-1.10860.135211
2-0.075419-0.73510.232047
3-0.099965-0.97430.166182
40.0779910.76020.22452
50.0255570.24910.401913
60.1326361.29280.099611
7-0.165002-1.60820.055551
80.0771860.75230.22686
9-0.011965-0.11660.453702
10-0.037126-0.36190.359132
110.1243541.21210.114249
120.0086160.0840.466626
13-0.253801-2.47370.007573
140.0818030.79730.213628
15-0.060085-0.58560.279755
160.0024950.02430.490323
170.0112020.10920.456642
18-0.158773-1.54750.062531
190.0492060.47960.316306
200.1791.74470.042137
21-0.217538-2.12030.018293
220.0370920.36150.359255
230.0107360.10460.458442
240.0333620.32520.372881
25-0.070828-0.69030.24583
260.0481260.46910.320045
27-0.154005-1.50110.068329
280.2831352.75970.003472
29-0.112948-1.10090.136865
30-0.041958-0.4090.341746
31-0.040584-0.39560.346656
32-0.010904-0.10630.457794
330.0116740.11380.454825
340.1596551.55610.061502
35-0.049205-0.47960.316309
36-0.037018-0.36080.359522
370.0076680.07470.470288
38-0.071592-0.69780.243505
390.1508061.46990.072449
400.0199490.19440.423126
41-0.217222-2.11720.018427
42-0.009724-0.09480.462346
430.0627350.61150.271176
440.1172051.14240.128085
450.0070610.06880.472637
46-0.096999-0.94540.17342
470.0096590.09410.462596
480.181551.76950.040007


Partial Autocorrelation Function
Time lag kPACF(k)T-STATP-value
1-0.113735-1.10860.135211
2-0.089512-0.87250.192579
3-0.122035-1.18940.118614
40.044310.43190.333402
50.0227920.22210.412338
60.1437831.40140.082173
7-0.118219-1.15230.126054
80.073880.72010.236617
90.0003990.00390.498451
10-0.073793-0.71920.236877
110.1459791.42280.079031
120.0057750.05630.477616
13-0.226076-2.20350.014987
140.0382910.37320.35491
15-0.094466-0.92070.179759
16-0.061142-0.59590.276317
17-0.000234-0.00230.499093
18-0.155607-1.51670.066336
190.0747750.72880.233953
200.1212661.1820.120088
21-0.177549-1.73050.043391
220.0564370.55010.291779
23-0.004478-0.04360.48264
240.0737660.7190.236958
25-0.104356-1.01710.155837
260.0029880.02910.488412
27-0.070839-0.69050.245795
280.1656881.61490.054822
29-0.039489-0.38490.350588
30-0.080706-0.78660.21673
31-0.105133-1.02470.154051
32-0.007474-0.07280.47104
330.0660470.64370.260647
340.0080230.07820.468917
350.0863850.8420.200957
36-0.065993-0.64320.260817
370.0668170.65120.258229
38-0.065814-0.64150.261379
390.0347920.33910.367637
40-0.004215-0.04110.483657
41-0.093096-0.90740.18325
42-0.070806-0.69010.245896
43-0.005269-0.05140.479577
440.1206861.17630.121206
45-0.04589-0.44730.327844
460.0038860.03790.484932
470.0877410.85520.197299
480.0886510.86410.194865

\begin{tabular}{lllllllll}
\hline
Partial Autocorrelation Function \tabularnewline
Time lag k & PACF(k) & T-STAT & P-value \tabularnewline
1 & -0.113735 & -1.1086 & 0.135211 \tabularnewline
2 & -0.089512 & -0.8725 & 0.192579 \tabularnewline
3 & -0.122035 & -1.1894 & 0.118614 \tabularnewline
4 & 0.04431 & 0.4319 & 0.333402 \tabularnewline
5 & 0.022792 & 0.2221 & 0.412338 \tabularnewline
6 & 0.143783 & 1.4014 & 0.082173 \tabularnewline
7 & -0.118219 & -1.1523 & 0.126054 \tabularnewline
8 & 0.07388 & 0.7201 & 0.236617 \tabularnewline
9 & 0.000399 & 0.0039 & 0.498451 \tabularnewline
10 & -0.073793 & -0.7192 & 0.236877 \tabularnewline
11 & 0.145979 & 1.4228 & 0.079031 \tabularnewline
12 & 0.005775 & 0.0563 & 0.477616 \tabularnewline
13 & -0.226076 & -2.2035 & 0.014987 \tabularnewline
14 & 0.038291 & 0.3732 & 0.35491 \tabularnewline
15 & -0.094466 & -0.9207 & 0.179759 \tabularnewline
16 & -0.061142 & -0.5959 & 0.276317 \tabularnewline
17 & -0.000234 & -0.0023 & 0.499093 \tabularnewline
18 & -0.155607 & -1.5167 & 0.066336 \tabularnewline
19 & 0.074775 & 0.7288 & 0.233953 \tabularnewline
20 & 0.121266 & 1.182 & 0.120088 \tabularnewline
21 & -0.177549 & -1.7305 & 0.043391 \tabularnewline
22 & 0.056437 & 0.5501 & 0.291779 \tabularnewline
23 & -0.004478 & -0.0436 & 0.48264 \tabularnewline
24 & 0.073766 & 0.719 & 0.236958 \tabularnewline
25 & -0.104356 & -1.0171 & 0.155837 \tabularnewline
26 & 0.002988 & 0.0291 & 0.488412 \tabularnewline
27 & -0.070839 & -0.6905 & 0.245795 \tabularnewline
28 & 0.165688 & 1.6149 & 0.054822 \tabularnewline
29 & -0.039489 & -0.3849 & 0.350588 \tabularnewline
30 & -0.080706 & -0.7866 & 0.21673 \tabularnewline
31 & -0.105133 & -1.0247 & 0.154051 \tabularnewline
32 & -0.007474 & -0.0728 & 0.47104 \tabularnewline
33 & 0.066047 & 0.6437 & 0.260647 \tabularnewline
34 & 0.008023 & 0.0782 & 0.468917 \tabularnewline
35 & 0.086385 & 0.842 & 0.200957 \tabularnewline
36 & -0.065993 & -0.6432 & 0.260817 \tabularnewline
37 & 0.066817 & 0.6512 & 0.258229 \tabularnewline
38 & -0.065814 & -0.6415 & 0.261379 \tabularnewline
39 & 0.034792 & 0.3391 & 0.367637 \tabularnewline
40 & -0.004215 & -0.0411 & 0.483657 \tabularnewline
41 & -0.093096 & -0.9074 & 0.18325 \tabularnewline
42 & -0.070806 & -0.6901 & 0.245896 \tabularnewline
43 & -0.005269 & -0.0514 & 0.479577 \tabularnewline
44 & 0.120686 & 1.1763 & 0.121206 \tabularnewline
45 & -0.04589 & -0.4473 & 0.327844 \tabularnewline
46 & 0.003886 & 0.0379 & 0.484932 \tabularnewline
47 & 0.087741 & 0.8552 & 0.197299 \tabularnewline
48 & 0.088651 & 0.8641 & 0.194865 \tabularnewline
\hline
\end{tabular}
%Source: https://freestatistics.org/blog/index.php?pk=42454&T=2

[TABLE]
[ROW][C]Partial Autocorrelation Function[/C][/ROW]
[ROW][C]Time lag k[/C][C]PACF(k)[/C][C]T-STAT[/C][C]P-value[/C][/ROW]
[ROW][C]1[/C][C]-0.113735[/C][C]-1.1086[/C][C]0.135211[/C][/ROW]
[ROW][C]2[/C][C]-0.089512[/C][C]-0.8725[/C][C]0.192579[/C][/ROW]
[ROW][C]3[/C][C]-0.122035[/C][C]-1.1894[/C][C]0.118614[/C][/ROW]
[ROW][C]4[/C][C]0.04431[/C][C]0.4319[/C][C]0.333402[/C][/ROW]
[ROW][C]5[/C][C]0.022792[/C][C]0.2221[/C][C]0.412338[/C][/ROW]
[ROW][C]6[/C][C]0.143783[/C][C]1.4014[/C][C]0.082173[/C][/ROW]
[ROW][C]7[/C][C]-0.118219[/C][C]-1.1523[/C][C]0.126054[/C][/ROW]
[ROW][C]8[/C][C]0.07388[/C][C]0.7201[/C][C]0.236617[/C][/ROW]
[ROW][C]9[/C][C]0.000399[/C][C]0.0039[/C][C]0.498451[/C][/ROW]
[ROW][C]10[/C][C]-0.073793[/C][C]-0.7192[/C][C]0.236877[/C][/ROW]
[ROW][C]11[/C][C]0.145979[/C][C]1.4228[/C][C]0.079031[/C][/ROW]
[ROW][C]12[/C][C]0.005775[/C][C]0.0563[/C][C]0.477616[/C][/ROW]
[ROW][C]13[/C][C]-0.226076[/C][C]-2.2035[/C][C]0.014987[/C][/ROW]
[ROW][C]14[/C][C]0.038291[/C][C]0.3732[/C][C]0.35491[/C][/ROW]
[ROW][C]15[/C][C]-0.094466[/C][C]-0.9207[/C][C]0.179759[/C][/ROW]
[ROW][C]16[/C][C]-0.061142[/C][C]-0.5959[/C][C]0.276317[/C][/ROW]
[ROW][C]17[/C][C]-0.000234[/C][C]-0.0023[/C][C]0.499093[/C][/ROW]
[ROW][C]18[/C][C]-0.155607[/C][C]-1.5167[/C][C]0.066336[/C][/ROW]
[ROW][C]19[/C][C]0.074775[/C][C]0.7288[/C][C]0.233953[/C][/ROW]
[ROW][C]20[/C][C]0.121266[/C][C]1.182[/C][C]0.120088[/C][/ROW]
[ROW][C]21[/C][C]-0.177549[/C][C]-1.7305[/C][C]0.043391[/C][/ROW]
[ROW][C]22[/C][C]0.056437[/C][C]0.5501[/C][C]0.291779[/C][/ROW]
[ROW][C]23[/C][C]-0.004478[/C][C]-0.0436[/C][C]0.48264[/C][/ROW]
[ROW][C]24[/C][C]0.073766[/C][C]0.719[/C][C]0.236958[/C][/ROW]
[ROW][C]25[/C][C]-0.104356[/C][C]-1.0171[/C][C]0.155837[/C][/ROW]
[ROW][C]26[/C][C]0.002988[/C][C]0.0291[/C][C]0.488412[/C][/ROW]
[ROW][C]27[/C][C]-0.070839[/C][C]-0.6905[/C][C]0.245795[/C][/ROW]
[ROW][C]28[/C][C]0.165688[/C][C]1.6149[/C][C]0.054822[/C][/ROW]
[ROW][C]29[/C][C]-0.039489[/C][C]-0.3849[/C][C]0.350588[/C][/ROW]
[ROW][C]30[/C][C]-0.080706[/C][C]-0.7866[/C][C]0.21673[/C][/ROW]
[ROW][C]31[/C][C]-0.105133[/C][C]-1.0247[/C][C]0.154051[/C][/ROW]
[ROW][C]32[/C][C]-0.007474[/C][C]-0.0728[/C][C]0.47104[/C][/ROW]
[ROW][C]33[/C][C]0.066047[/C][C]0.6437[/C][C]0.260647[/C][/ROW]
[ROW][C]34[/C][C]0.008023[/C][C]0.0782[/C][C]0.468917[/C][/ROW]
[ROW][C]35[/C][C]0.086385[/C][C]0.842[/C][C]0.200957[/C][/ROW]
[ROW][C]36[/C][C]-0.065993[/C][C]-0.6432[/C][C]0.260817[/C][/ROW]
[ROW][C]37[/C][C]0.066817[/C][C]0.6512[/C][C]0.258229[/C][/ROW]
[ROW][C]38[/C][C]-0.065814[/C][C]-0.6415[/C][C]0.261379[/C][/ROW]
[ROW][C]39[/C][C]0.034792[/C][C]0.3391[/C][C]0.367637[/C][/ROW]
[ROW][C]40[/C][C]-0.004215[/C][C]-0.0411[/C][C]0.483657[/C][/ROW]
[ROW][C]41[/C][C]-0.093096[/C][C]-0.9074[/C][C]0.18325[/C][/ROW]
[ROW][C]42[/C][C]-0.070806[/C][C]-0.6901[/C][C]0.245896[/C][/ROW]
[ROW][C]43[/C][C]-0.005269[/C][C]-0.0514[/C][C]0.479577[/C][/ROW]
[ROW][C]44[/C][C]0.120686[/C][C]1.1763[/C][C]0.121206[/C][/ROW]
[ROW][C]45[/C][C]-0.04589[/C][C]-0.4473[/C][C]0.327844[/C][/ROW]
[ROW][C]46[/C][C]0.003886[/C][C]0.0379[/C][C]0.484932[/C][/ROW]
[ROW][C]47[/C][C]0.087741[/C][C]0.8552[/C][C]0.197299[/C][/ROW]
[ROW][C]48[/C][C]0.088651[/C][C]0.8641[/C][C]0.194865[/C][/ROW]
[/TABLE]
Source: https://freestatistics.org/blog/index.php?pk=42454&T=2

Globally Unique Identifier (entire table): ba.freestatistics.org/blog/index.php?pk=42454&T=2

As an alternative you can also use a QR Code:  

The GUIDs for individual cells are displayed in the table below:

Partial Autocorrelation Function
Time lag kPACF(k)T-STATP-value
1-0.113735-1.10860.135211
2-0.089512-0.87250.192579
3-0.122035-1.18940.118614
40.044310.43190.333402
50.0227920.22210.412338
60.1437831.40140.082173
7-0.118219-1.15230.126054
80.073880.72010.236617
90.0003990.00390.498451
10-0.073793-0.71920.236877
110.1459791.42280.079031
120.0057750.05630.477616
13-0.226076-2.20350.014987
140.0382910.37320.35491
15-0.094466-0.92070.179759
16-0.061142-0.59590.276317
17-0.000234-0.00230.499093
18-0.155607-1.51670.066336
190.0747750.72880.233953
200.1212661.1820.120088
21-0.177549-1.73050.043391
220.0564370.55010.291779
23-0.004478-0.04360.48264
240.0737660.7190.236958
25-0.104356-1.01710.155837
260.0029880.02910.488412
27-0.070839-0.69050.245795
280.1656881.61490.054822
29-0.039489-0.38490.350588
30-0.080706-0.78660.21673
31-0.105133-1.02470.154051
32-0.007474-0.07280.47104
330.0660470.64370.260647
340.0080230.07820.468917
350.0863850.8420.200957
36-0.065993-0.64320.260817
370.0668170.65120.258229
38-0.065814-0.64150.261379
390.0347920.33910.367637
40-0.004215-0.04110.483657
41-0.093096-0.90740.18325
42-0.070806-0.69010.245896
43-0.005269-0.05140.479577
440.1206861.17630.121206
45-0.04589-0.44730.327844
460.0038860.03790.484932
470.0877410.85520.197299
480.0886510.86410.194865


Parameters (Session):
par1 = 48 ; par2 = 1 ; par3 = 1 ; par4 = 0 ; par5 = 12 ;
Parameters (R input):
par1 = 48 ; par2 = 1 ; par3 = 1 ; par4 = 0 ; par5 = 12 ;
R code (references can be found in the software module):
if (par1 == 'Default') {
par1 = 10*log10(length(x))
} else {
par1 <- as.numeric(par1)
}
par2 <- as.numeric(par2)
par3 <- as.numeric(par3)
par4 <- as.numeric(par4)
par5 <- as.numeric(par5)
if (par2 == 0) {
x <- log(x)
} else {
x <- (x ^ par2 - 1) / par2
}
if (par3 > 0) x <- diff(x,lag=1,difference=par3)
if (par4 > 0) x <- diff(x,lag=par5,difference=par4)
bitmap(file='pic1.png')
racf <- acf(x,par1,main='Autocorrelation',xlab='lags',ylab='ACF')
dev.off()
bitmap(file='pic2.png')
rpacf <- pacf(x,par1,main='Partial Autocorrelation',xlab='lags',ylab='PACF')
dev.off()
(myacf <- c(racf$acf))
(mypacf <- c(rpacf$acf))
lengthx <- length(x)
sqrtn <- sqrt(lengthx)
load(file='createtable')
a<-table.start()
a<-table.row.start(a)
a<-table.element(a,'Autocorrelation Function',4,TRUE)
a<-table.row.end(a)
a<-table.row.start(a)
a<-table.element(a,'Time lag k',header=TRUE)
a<-table.element(a,hyperlink('basics.htm','ACF(k)','click here for more information about the Autocorrelation Function'),header=TRUE)
a<-table.element(a,'T-STAT',header=TRUE)
a<-table.element(a,'P-value',header=TRUE)
a<-table.row.end(a)
for (i in 2:(par1+1)) {
a<-table.row.start(a)
a<-table.element(a,i-1,header=TRUE)
a<-table.element(a,round(myacf[i],6))
mytstat <- myacf[i]*sqrtn
a<-table.element(a,round(mytstat,4))
a<-table.element(a,round(1-pt(abs(mytstat),lengthx),6))
a<-table.row.end(a)
}
a<-table.end(a)
table.save(a,file='mytable.tab')
a<-table.start()
a<-table.row.start(a)
a<-table.element(a,'Partial Autocorrelation Function',4,TRUE)
a<-table.row.end(a)
a<-table.row.start(a)
a<-table.element(a,'Time lag k',header=TRUE)
a<-table.element(a,hyperlink('basics.htm','PACF(k)','click here for more information about the Partial Autocorrelation Function'),header=TRUE)
a<-table.element(a,'T-STAT',header=TRUE)
a<-table.element(a,'P-value',header=TRUE)
a<-table.row.end(a)
for (i in 1:par1) {
a<-table.row.start(a)
a<-table.element(a,i,header=TRUE)
a<-table.element(a,round(mypacf[i],6))
mytstat <- mypacf[i]*sqrtn
a<-table.element(a,round(mytstat,4))
a<-table.element(a,round(1-pt(abs(mytstat),lengthx),6))
a<-table.row.end(a)
}
a<-table.end(a)
table.save(a,file='mytable1.tab')