Free Statistics

of Irreproducible Research!

Author's title

Author*Unverified author*
R Software Modulerwasp_autocorrelation.wasp
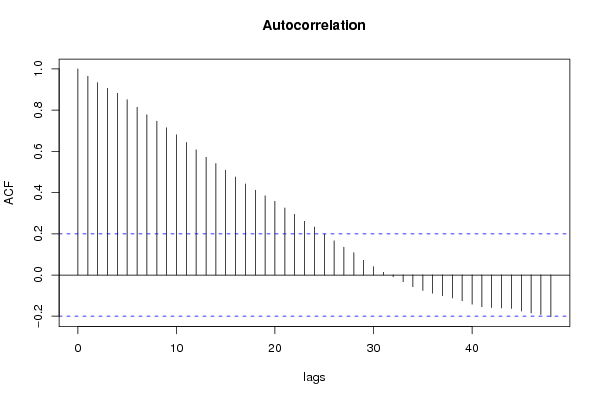
Title produced by software(Partial) Autocorrelation Function
Date of computationMon, 03 Aug 2009 03:44:38 -0600
Cite this page as followsStatistical Computations at FreeStatistics.org, Office for Research Development and Education, URL https://freestatistics.org/blog/index.php?v=date/2009/Aug/03/t1249292706m5ryrxgspuoksxi.htm/, Retrieved Sat, 27 Apr 2024 17:13:54 +0000
Statistical Computations at FreeStatistics.org, Office for Research Development and Education, URL https://freestatistics.org/blog/index.php?pk=42453, Retrieved Sat, 27 Apr 2024 17:13:54 +0000
QR Codes:

Original text written by user:
IsPrivate?No (this computation is public)
User-defined keywordsRoze garnalen
Estimated Impact229
Family? (F = Feedback message, R = changed R code, M = changed R Module, P = changed Parameters, D = changed Data)
-       [(Partial) Autocorrelation Function] [Vermeulennickopga...] [2009-08-03 09:44:38] [0d1085ed835696cdd537ad5fa07600ec] [Current]
Feedback Forum

Post a new message
Dataseries X:
106.61
107.86
108.07
109.68
108.57
108.08
109.8
110.7
110.72
109.85
109.71
110
110.87
111.16
110.63
110.26
110.79
111.75
111.75
112.31
112.29
111.86
111.22
112.42
111.94
112.77
113.99
114.22
112.38
114.98
115.94
117.63
117.76
118.11
120.88
121.87
122.34
122.42
122.17
121.99
124.96
125.94
126.59
127.11
125.44
125.53
125.35
124.3
123.62
124
124.47
126.89
124.87
124.55
125.31
126.02
125.31
125.3
123.83
124.49
124.92
125.77
127.27
127.35
126.05
126.84
127.75
126.78
126.98
127.89
127.9
128.06
125.39
128.13
127.97
127.56
126.89
127.8
128.05
128.98
128.55
129.35
129.97
130.89
129.8
132.32
131.1
131.44
132.55
133.35
132.53
131.11
130.02
128.91
129.98
130.91


Summary of computational transaction
Raw Inputview raw input (R code)
Raw Outputview raw output of R engine
Computing time1 seconds
R Server'Gwilym Jenkins' @ 72.249.127.135

\begin{tabular}{lllllllll}
\hline
Summary of computational transaction \tabularnewline
Raw Input & view raw input (R code)  \tabularnewline
Raw Output & view raw output of R engine  \tabularnewline
Computing time & 1 seconds \tabularnewline
R Server & 'Gwilym Jenkins' @ 72.249.127.135 \tabularnewline
\hline
\end{tabular}
%Source: https://freestatistics.org/blog/index.php?pk=42453&T=0

[TABLE]
[ROW][C]Summary of computational transaction[/C][/ROW]
[ROW][C]Raw Input[/C][C]view raw input (R code) [/C][/ROW]
[ROW][C]Raw Output[/C][C]view raw output of R engine [/C][/ROW]
[ROW][C]Computing time[/C][C]1 seconds[/C][/ROW]
[ROW][C]R Server[/C][C]'Gwilym Jenkins' @ 72.249.127.135[/C][/ROW]
[/TABLE]
Source: https://freestatistics.org/blog/index.php?pk=42453&T=0

Globally Unique Identifier (entire table): ba.freestatistics.org/blog/index.php?pk=42453&T=0

As an alternative you can also use a QR Code:  

The GUIDs for individual cells are displayed in the table below:

Summary of computational transaction
Raw Inputview raw input (R code)
Raw Outputview raw output of R engine
Computing time1 seconds
R Server'Gwilym Jenkins' @ 72.249.127.135


Autocorrelation Function
Time lag kACF(k)T-STATP-value
10.9640279.44550
20.9338069.14940
30.9062728.87960
40.8819778.64160
50.8507088.33520
60.8143797.97930
70.7775667.61860
80.7463077.31230
90.7144467.00010
100.680136.66390
110.6431346.30140
120.6075795.9530
130.5713425.5980
140.5410115.30080
150.5078524.97591e-06
160.4751744.65575e-06
170.4421474.33211.8e-05
180.4119124.03595.5e-05
190.3841063.76350.000144
200.3574033.50180.000352
210.3254123.18840.000966
220.2947722.88820.002394
230.2606092.55340.006121
240.2327862.28080.012385
250.1979611.93960.027681
260.1658591.62510.053712
270.1350761.32350.094412
280.1082991.06110.145652
290.0710470.69610.244019
300.0400320.39220.347877
310.0128470.12590.450046
32-0.008786-0.08610.465791
33-0.032709-0.32050.374649
34-0.056599-0.55460.290245
35-0.074663-0.73150.233115
36-0.088499-0.86710.194022
37-0.100279-0.98250.164155
38-0.111426-1.09170.138839
39-0.124759-1.22240.112278
40-0.141916-1.39050.083798
41-0.153557-1.50450.067862
42-0.158028-1.54830.062414
43-0.159855-1.56630.06029
44-0.162411-1.59130.057416
45-0.175076-1.71540.04475
46-0.184276-1.80550.037063
47-0.191849-1.87970.031589
48-0.202138-1.98050.025252

\begin{tabular}{lllllllll}
\hline
Autocorrelation Function \tabularnewline
Time lag k & ACF(k) & T-STAT & P-value \tabularnewline
1 & 0.964027 & 9.4455 & 0 \tabularnewline
2 & 0.933806 & 9.1494 & 0 \tabularnewline
3 & 0.906272 & 8.8796 & 0 \tabularnewline
4 & 0.881977 & 8.6416 & 0 \tabularnewline
5 & 0.850708 & 8.3352 & 0 \tabularnewline
6 & 0.814379 & 7.9793 & 0 \tabularnewline
7 & 0.777566 & 7.6186 & 0 \tabularnewline
8 & 0.746307 & 7.3123 & 0 \tabularnewline
9 & 0.714446 & 7.0001 & 0 \tabularnewline
10 & 0.68013 & 6.6639 & 0 \tabularnewline
11 & 0.643134 & 6.3014 & 0 \tabularnewline
12 & 0.607579 & 5.953 & 0 \tabularnewline
13 & 0.571342 & 5.598 & 0 \tabularnewline
14 & 0.541011 & 5.3008 & 0 \tabularnewline
15 & 0.507852 & 4.9759 & 1e-06 \tabularnewline
16 & 0.475174 & 4.6557 & 5e-06 \tabularnewline
17 & 0.442147 & 4.3321 & 1.8e-05 \tabularnewline
18 & 0.411912 & 4.0359 & 5.5e-05 \tabularnewline
19 & 0.384106 & 3.7635 & 0.000144 \tabularnewline
20 & 0.357403 & 3.5018 & 0.000352 \tabularnewline
21 & 0.325412 & 3.1884 & 0.000966 \tabularnewline
22 & 0.294772 & 2.8882 & 0.002394 \tabularnewline
23 & 0.260609 & 2.5534 & 0.006121 \tabularnewline
24 & 0.232786 & 2.2808 & 0.012385 \tabularnewline
25 & 0.197961 & 1.9396 & 0.027681 \tabularnewline
26 & 0.165859 & 1.6251 & 0.053712 \tabularnewline
27 & 0.135076 & 1.3235 & 0.094412 \tabularnewline
28 & 0.108299 & 1.0611 & 0.145652 \tabularnewline
29 & 0.071047 & 0.6961 & 0.244019 \tabularnewline
30 & 0.040032 & 0.3922 & 0.347877 \tabularnewline
31 & 0.012847 & 0.1259 & 0.450046 \tabularnewline
32 & -0.008786 & -0.0861 & 0.465791 \tabularnewline
33 & -0.032709 & -0.3205 & 0.374649 \tabularnewline
34 & -0.056599 & -0.5546 & 0.290245 \tabularnewline
35 & -0.074663 & -0.7315 & 0.233115 \tabularnewline
36 & -0.088499 & -0.8671 & 0.194022 \tabularnewline
37 & -0.100279 & -0.9825 & 0.164155 \tabularnewline
38 & -0.111426 & -1.0917 & 0.138839 \tabularnewline
39 & -0.124759 & -1.2224 & 0.112278 \tabularnewline
40 & -0.141916 & -1.3905 & 0.083798 \tabularnewline
41 & -0.153557 & -1.5045 & 0.067862 \tabularnewline
42 & -0.158028 & -1.5483 & 0.062414 \tabularnewline
43 & -0.159855 & -1.5663 & 0.06029 \tabularnewline
44 & -0.162411 & -1.5913 & 0.057416 \tabularnewline
45 & -0.175076 & -1.7154 & 0.04475 \tabularnewline
46 & -0.184276 & -1.8055 & 0.037063 \tabularnewline
47 & -0.191849 & -1.8797 & 0.031589 \tabularnewline
48 & -0.202138 & -1.9805 & 0.025252 \tabularnewline
\hline
\end{tabular}
%Source: https://freestatistics.org/blog/index.php?pk=42453&T=1

[TABLE]
[ROW][C]Autocorrelation Function[/C][/ROW]
[ROW][C]Time lag k[/C][C]ACF(k)[/C][C]T-STAT[/C][C]P-value[/C][/ROW]
[ROW][C]1[/C][C]0.964027[/C][C]9.4455[/C][C]0[/C][/ROW]
[ROW][C]2[/C][C]0.933806[/C][C]9.1494[/C][C]0[/C][/ROW]
[ROW][C]3[/C][C]0.906272[/C][C]8.8796[/C][C]0[/C][/ROW]
[ROW][C]4[/C][C]0.881977[/C][C]8.6416[/C][C]0[/C][/ROW]
[ROW][C]5[/C][C]0.850708[/C][C]8.3352[/C][C]0[/C][/ROW]
[ROW][C]6[/C][C]0.814379[/C][C]7.9793[/C][C]0[/C][/ROW]
[ROW][C]7[/C][C]0.777566[/C][C]7.6186[/C][C]0[/C][/ROW]
[ROW][C]8[/C][C]0.746307[/C][C]7.3123[/C][C]0[/C][/ROW]
[ROW][C]9[/C][C]0.714446[/C][C]7.0001[/C][C]0[/C][/ROW]
[ROW][C]10[/C][C]0.68013[/C][C]6.6639[/C][C]0[/C][/ROW]
[ROW][C]11[/C][C]0.643134[/C][C]6.3014[/C][C]0[/C][/ROW]
[ROW][C]12[/C][C]0.607579[/C][C]5.953[/C][C]0[/C][/ROW]
[ROW][C]13[/C][C]0.571342[/C][C]5.598[/C][C]0[/C][/ROW]
[ROW][C]14[/C][C]0.541011[/C][C]5.3008[/C][C]0[/C][/ROW]
[ROW][C]15[/C][C]0.507852[/C][C]4.9759[/C][C]1e-06[/C][/ROW]
[ROW][C]16[/C][C]0.475174[/C][C]4.6557[/C][C]5e-06[/C][/ROW]
[ROW][C]17[/C][C]0.442147[/C][C]4.3321[/C][C]1.8e-05[/C][/ROW]
[ROW][C]18[/C][C]0.411912[/C][C]4.0359[/C][C]5.5e-05[/C][/ROW]
[ROW][C]19[/C][C]0.384106[/C][C]3.7635[/C][C]0.000144[/C][/ROW]
[ROW][C]20[/C][C]0.357403[/C][C]3.5018[/C][C]0.000352[/C][/ROW]
[ROW][C]21[/C][C]0.325412[/C][C]3.1884[/C][C]0.000966[/C][/ROW]
[ROW][C]22[/C][C]0.294772[/C][C]2.8882[/C][C]0.002394[/C][/ROW]
[ROW][C]23[/C][C]0.260609[/C][C]2.5534[/C][C]0.006121[/C][/ROW]
[ROW][C]24[/C][C]0.232786[/C][C]2.2808[/C][C]0.012385[/C][/ROW]
[ROW][C]25[/C][C]0.197961[/C][C]1.9396[/C][C]0.027681[/C][/ROW]
[ROW][C]26[/C][C]0.165859[/C][C]1.6251[/C][C]0.053712[/C][/ROW]
[ROW][C]27[/C][C]0.135076[/C][C]1.3235[/C][C]0.094412[/C][/ROW]
[ROW][C]28[/C][C]0.108299[/C][C]1.0611[/C][C]0.145652[/C][/ROW]
[ROW][C]29[/C][C]0.071047[/C][C]0.6961[/C][C]0.244019[/C][/ROW]
[ROW][C]30[/C][C]0.040032[/C][C]0.3922[/C][C]0.347877[/C][/ROW]
[ROW][C]31[/C][C]0.012847[/C][C]0.1259[/C][C]0.450046[/C][/ROW]
[ROW][C]32[/C][C]-0.008786[/C][C]-0.0861[/C][C]0.465791[/C][/ROW]
[ROW][C]33[/C][C]-0.032709[/C][C]-0.3205[/C][C]0.374649[/C][/ROW]
[ROW][C]34[/C][C]-0.056599[/C][C]-0.5546[/C][C]0.290245[/C][/ROW]
[ROW][C]35[/C][C]-0.074663[/C][C]-0.7315[/C][C]0.233115[/C][/ROW]
[ROW][C]36[/C][C]-0.088499[/C][C]-0.8671[/C][C]0.194022[/C][/ROW]
[ROW][C]37[/C][C]-0.100279[/C][C]-0.9825[/C][C]0.164155[/C][/ROW]
[ROW][C]38[/C][C]-0.111426[/C][C]-1.0917[/C][C]0.138839[/C][/ROW]
[ROW][C]39[/C][C]-0.124759[/C][C]-1.2224[/C][C]0.112278[/C][/ROW]
[ROW][C]40[/C][C]-0.141916[/C][C]-1.3905[/C][C]0.083798[/C][/ROW]
[ROW][C]41[/C][C]-0.153557[/C][C]-1.5045[/C][C]0.067862[/C][/ROW]
[ROW][C]42[/C][C]-0.158028[/C][C]-1.5483[/C][C]0.062414[/C][/ROW]
[ROW][C]43[/C][C]-0.159855[/C][C]-1.5663[/C][C]0.06029[/C][/ROW]
[ROW][C]44[/C][C]-0.162411[/C][C]-1.5913[/C][C]0.057416[/C][/ROW]
[ROW][C]45[/C][C]-0.175076[/C][C]-1.7154[/C][C]0.04475[/C][/ROW]
[ROW][C]46[/C][C]-0.184276[/C][C]-1.8055[/C][C]0.037063[/C][/ROW]
[ROW][C]47[/C][C]-0.191849[/C][C]-1.8797[/C][C]0.031589[/C][/ROW]
[ROW][C]48[/C][C]-0.202138[/C][C]-1.9805[/C][C]0.025252[/C][/ROW]
[/TABLE]
Source: https://freestatistics.org/blog/index.php?pk=42453&T=1

Globally Unique Identifier (entire table): ba.freestatistics.org/blog/index.php?pk=42453&T=1

As an alternative you can also use a QR Code:  

The GUIDs for individual cells are displayed in the table below:

Autocorrelation Function
Time lag kACF(k)T-STATP-value
10.9640279.44550
20.9338069.14940
30.9062728.87960
40.8819778.64160
50.8507088.33520
60.8143797.97930
70.7775667.61860
80.7463077.31230
90.7144467.00010
100.680136.66390
110.6431346.30140
120.6075795.9530
130.5713425.5980
140.5410115.30080
150.5078524.97591e-06
160.4751744.65575e-06
170.4421474.33211.8e-05
180.4119124.03595.5e-05
190.3841063.76350.000144
200.3574033.50180.000352
210.3254123.18840.000966
220.2947722.88820.002394
230.2606092.55340.006121
240.2327862.28080.012385
250.1979611.93960.027681
260.1658591.62510.053712
270.1350761.32350.094412
280.1082991.06110.145652
290.0710470.69610.244019
300.0400320.39220.347877
310.0128470.12590.450046
32-0.008786-0.08610.465791
33-0.032709-0.32050.374649
34-0.056599-0.55460.290245
35-0.074663-0.73150.233115
36-0.088499-0.86710.194022
37-0.100279-0.98250.164155
38-0.111426-1.09170.138839
39-0.124759-1.22240.112278
40-0.141916-1.39050.083798
41-0.153557-1.50450.067862
42-0.158028-1.54830.062414
43-0.159855-1.56630.06029
44-0.162411-1.59130.057416
45-0.175076-1.71540.04475
46-0.184276-1.80550.037063
47-0.191849-1.87970.031589
48-0.202138-1.98050.025252


Partial Autocorrelation Function
Time lag kPACF(k)T-STATP-value
10.9640279.44550
20.063090.61820.26897
30.0288690.28290.388946
40.0381410.37370.354724
5-0.10272-1.00640.158365
6-0.1008-0.98760.162907
7-0.046022-0.45090.326533
80.0419250.41080.341075
9-0.013383-0.13110.447973
10-0.035679-0.34960.363711
11-0.049719-0.48710.313634
12-0.020703-0.20280.419843
13-0.045203-0.44290.329419
140.0619160.60660.272758
15-0.031302-0.30670.379868
16-0.010543-0.10330.458971
17-0.02346-0.22990.409344
18-0.001837-0.0180.492839
190.0145640.14270.443413
200.0047090.04610.481646
21-0.077684-0.76110.224218
22-0.02086-0.20440.419242
23-0.091936-0.90080.184978
240.0394550.38660.349961
25-0.10276-1.00680.158273
260.0092640.09080.463932
270.0137190.13440.446678
280.0127320.12470.450493
29-0.165396-1.62050.054197
300.0458810.44950.327027
310.0395280.38730.349697
320.0505220.4950.31086
33-0.015937-0.15610.438123
34-0.014183-0.1390.444884
350.0592190.58020.281562
36-0.000496-0.00490.498064
370.0403840.39570.34661
380.0026910.02640.489509
39-0.042221-0.41370.340017
40-0.121443-1.18990.118512
410.0387260.37940.3526
420.0669210.65570.256797
430.0811980.79560.214122
440.0017410.01710.493214
45-0.146311-1.43360.077475
46-0.050799-0.49770.309908
47-0.031466-0.30830.37926
48-0.064277-0.62980.265166

\begin{tabular}{lllllllll}
\hline
Partial Autocorrelation Function \tabularnewline
Time lag k & PACF(k) & T-STAT & P-value \tabularnewline
1 & 0.964027 & 9.4455 & 0 \tabularnewline
2 & 0.06309 & 0.6182 & 0.26897 \tabularnewline
3 & 0.028869 & 0.2829 & 0.388946 \tabularnewline
4 & 0.038141 & 0.3737 & 0.354724 \tabularnewline
5 & -0.10272 & -1.0064 & 0.158365 \tabularnewline
6 & -0.1008 & -0.9876 & 0.162907 \tabularnewline
7 & -0.046022 & -0.4509 & 0.326533 \tabularnewline
8 & 0.041925 & 0.4108 & 0.341075 \tabularnewline
9 & -0.013383 & -0.1311 & 0.447973 \tabularnewline
10 & -0.035679 & -0.3496 & 0.363711 \tabularnewline
11 & -0.049719 & -0.4871 & 0.313634 \tabularnewline
12 & -0.020703 & -0.2028 & 0.419843 \tabularnewline
13 & -0.045203 & -0.4429 & 0.329419 \tabularnewline
14 & 0.061916 & 0.6066 & 0.272758 \tabularnewline
15 & -0.031302 & -0.3067 & 0.379868 \tabularnewline
16 & -0.010543 & -0.1033 & 0.458971 \tabularnewline
17 & -0.02346 & -0.2299 & 0.409344 \tabularnewline
18 & -0.001837 & -0.018 & 0.492839 \tabularnewline
19 & 0.014564 & 0.1427 & 0.443413 \tabularnewline
20 & 0.004709 & 0.0461 & 0.481646 \tabularnewline
21 & -0.077684 & -0.7611 & 0.224218 \tabularnewline
22 & -0.02086 & -0.2044 & 0.419242 \tabularnewline
23 & -0.091936 & -0.9008 & 0.184978 \tabularnewline
24 & 0.039455 & 0.3866 & 0.349961 \tabularnewline
25 & -0.10276 & -1.0068 & 0.158273 \tabularnewline
26 & 0.009264 & 0.0908 & 0.463932 \tabularnewline
27 & 0.013719 & 0.1344 & 0.446678 \tabularnewline
28 & 0.012732 & 0.1247 & 0.450493 \tabularnewline
29 & -0.165396 & -1.6205 & 0.054197 \tabularnewline
30 & 0.045881 & 0.4495 & 0.327027 \tabularnewline
31 & 0.039528 & 0.3873 & 0.349697 \tabularnewline
32 & 0.050522 & 0.495 & 0.31086 \tabularnewline
33 & -0.015937 & -0.1561 & 0.438123 \tabularnewline
34 & -0.014183 & -0.139 & 0.444884 \tabularnewline
35 & 0.059219 & 0.5802 & 0.281562 \tabularnewline
36 & -0.000496 & -0.0049 & 0.498064 \tabularnewline
37 & 0.040384 & 0.3957 & 0.34661 \tabularnewline
38 & 0.002691 & 0.0264 & 0.489509 \tabularnewline
39 & -0.042221 & -0.4137 & 0.340017 \tabularnewline
40 & -0.121443 & -1.1899 & 0.118512 \tabularnewline
41 & 0.038726 & 0.3794 & 0.3526 \tabularnewline
42 & 0.066921 & 0.6557 & 0.256797 \tabularnewline
43 & 0.081198 & 0.7956 & 0.214122 \tabularnewline
44 & 0.001741 & 0.0171 & 0.493214 \tabularnewline
45 & -0.146311 & -1.4336 & 0.077475 \tabularnewline
46 & -0.050799 & -0.4977 & 0.309908 \tabularnewline
47 & -0.031466 & -0.3083 & 0.37926 \tabularnewline
48 & -0.064277 & -0.6298 & 0.265166 \tabularnewline
\hline
\end{tabular}
%Source: https://freestatistics.org/blog/index.php?pk=42453&T=2

[TABLE]
[ROW][C]Partial Autocorrelation Function[/C][/ROW]
[ROW][C]Time lag k[/C][C]PACF(k)[/C][C]T-STAT[/C][C]P-value[/C][/ROW]
[ROW][C]1[/C][C]0.964027[/C][C]9.4455[/C][C]0[/C][/ROW]
[ROW][C]2[/C][C]0.06309[/C][C]0.6182[/C][C]0.26897[/C][/ROW]
[ROW][C]3[/C][C]0.028869[/C][C]0.2829[/C][C]0.388946[/C][/ROW]
[ROW][C]4[/C][C]0.038141[/C][C]0.3737[/C][C]0.354724[/C][/ROW]
[ROW][C]5[/C][C]-0.10272[/C][C]-1.0064[/C][C]0.158365[/C][/ROW]
[ROW][C]6[/C][C]-0.1008[/C][C]-0.9876[/C][C]0.162907[/C][/ROW]
[ROW][C]7[/C][C]-0.046022[/C][C]-0.4509[/C][C]0.326533[/C][/ROW]
[ROW][C]8[/C][C]0.041925[/C][C]0.4108[/C][C]0.341075[/C][/ROW]
[ROW][C]9[/C][C]-0.013383[/C][C]-0.1311[/C][C]0.447973[/C][/ROW]
[ROW][C]10[/C][C]-0.035679[/C][C]-0.3496[/C][C]0.363711[/C][/ROW]
[ROW][C]11[/C][C]-0.049719[/C][C]-0.4871[/C][C]0.313634[/C][/ROW]
[ROW][C]12[/C][C]-0.020703[/C][C]-0.2028[/C][C]0.419843[/C][/ROW]
[ROW][C]13[/C][C]-0.045203[/C][C]-0.4429[/C][C]0.329419[/C][/ROW]
[ROW][C]14[/C][C]0.061916[/C][C]0.6066[/C][C]0.272758[/C][/ROW]
[ROW][C]15[/C][C]-0.031302[/C][C]-0.3067[/C][C]0.379868[/C][/ROW]
[ROW][C]16[/C][C]-0.010543[/C][C]-0.1033[/C][C]0.458971[/C][/ROW]
[ROW][C]17[/C][C]-0.02346[/C][C]-0.2299[/C][C]0.409344[/C][/ROW]
[ROW][C]18[/C][C]-0.001837[/C][C]-0.018[/C][C]0.492839[/C][/ROW]
[ROW][C]19[/C][C]0.014564[/C][C]0.1427[/C][C]0.443413[/C][/ROW]
[ROW][C]20[/C][C]0.004709[/C][C]0.0461[/C][C]0.481646[/C][/ROW]
[ROW][C]21[/C][C]-0.077684[/C][C]-0.7611[/C][C]0.224218[/C][/ROW]
[ROW][C]22[/C][C]-0.02086[/C][C]-0.2044[/C][C]0.419242[/C][/ROW]
[ROW][C]23[/C][C]-0.091936[/C][C]-0.9008[/C][C]0.184978[/C][/ROW]
[ROW][C]24[/C][C]0.039455[/C][C]0.3866[/C][C]0.349961[/C][/ROW]
[ROW][C]25[/C][C]-0.10276[/C][C]-1.0068[/C][C]0.158273[/C][/ROW]
[ROW][C]26[/C][C]0.009264[/C][C]0.0908[/C][C]0.463932[/C][/ROW]
[ROW][C]27[/C][C]0.013719[/C][C]0.1344[/C][C]0.446678[/C][/ROW]
[ROW][C]28[/C][C]0.012732[/C][C]0.1247[/C][C]0.450493[/C][/ROW]
[ROW][C]29[/C][C]-0.165396[/C][C]-1.6205[/C][C]0.054197[/C][/ROW]
[ROW][C]30[/C][C]0.045881[/C][C]0.4495[/C][C]0.327027[/C][/ROW]
[ROW][C]31[/C][C]0.039528[/C][C]0.3873[/C][C]0.349697[/C][/ROW]
[ROW][C]32[/C][C]0.050522[/C][C]0.495[/C][C]0.31086[/C][/ROW]
[ROW][C]33[/C][C]-0.015937[/C][C]-0.1561[/C][C]0.438123[/C][/ROW]
[ROW][C]34[/C][C]-0.014183[/C][C]-0.139[/C][C]0.444884[/C][/ROW]
[ROW][C]35[/C][C]0.059219[/C][C]0.5802[/C][C]0.281562[/C][/ROW]
[ROW][C]36[/C][C]-0.000496[/C][C]-0.0049[/C][C]0.498064[/C][/ROW]
[ROW][C]37[/C][C]0.040384[/C][C]0.3957[/C][C]0.34661[/C][/ROW]
[ROW][C]38[/C][C]0.002691[/C][C]0.0264[/C][C]0.489509[/C][/ROW]
[ROW][C]39[/C][C]-0.042221[/C][C]-0.4137[/C][C]0.340017[/C][/ROW]
[ROW][C]40[/C][C]-0.121443[/C][C]-1.1899[/C][C]0.118512[/C][/ROW]
[ROW][C]41[/C][C]0.038726[/C][C]0.3794[/C][C]0.3526[/C][/ROW]
[ROW][C]42[/C][C]0.066921[/C][C]0.6557[/C][C]0.256797[/C][/ROW]
[ROW][C]43[/C][C]0.081198[/C][C]0.7956[/C][C]0.214122[/C][/ROW]
[ROW][C]44[/C][C]0.001741[/C][C]0.0171[/C][C]0.493214[/C][/ROW]
[ROW][C]45[/C][C]-0.146311[/C][C]-1.4336[/C][C]0.077475[/C][/ROW]
[ROW][C]46[/C][C]-0.050799[/C][C]-0.4977[/C][C]0.309908[/C][/ROW]
[ROW][C]47[/C][C]-0.031466[/C][C]-0.3083[/C][C]0.37926[/C][/ROW]
[ROW][C]48[/C][C]-0.064277[/C][C]-0.6298[/C][C]0.265166[/C][/ROW]
[/TABLE]
Source: https://freestatistics.org/blog/index.php?pk=42453&T=2

Globally Unique Identifier (entire table): ba.freestatistics.org/blog/index.php?pk=42453&T=2

As an alternative you can also use a QR Code:  

The GUIDs for individual cells are displayed in the table below:

Partial Autocorrelation Function
Time lag kPACF(k)T-STATP-value
10.9640279.44550
20.063090.61820.26897
30.0288690.28290.388946
40.0381410.37370.354724
5-0.10272-1.00640.158365
6-0.1008-0.98760.162907
7-0.046022-0.45090.326533
80.0419250.41080.341075
9-0.013383-0.13110.447973
10-0.035679-0.34960.363711
11-0.049719-0.48710.313634
12-0.020703-0.20280.419843
13-0.045203-0.44290.329419
140.0619160.60660.272758
15-0.031302-0.30670.379868
16-0.010543-0.10330.458971
17-0.02346-0.22990.409344
18-0.001837-0.0180.492839
190.0145640.14270.443413
200.0047090.04610.481646
21-0.077684-0.76110.224218
22-0.02086-0.20440.419242
23-0.091936-0.90080.184978
240.0394550.38660.349961
25-0.10276-1.00680.158273
260.0092640.09080.463932
270.0137190.13440.446678
280.0127320.12470.450493
29-0.165396-1.62050.054197
300.0458810.44950.327027
310.0395280.38730.349697
320.0505220.4950.31086
33-0.015937-0.15610.438123
34-0.014183-0.1390.444884
350.0592190.58020.281562
36-0.000496-0.00490.498064
370.0403840.39570.34661
380.0026910.02640.489509
39-0.042221-0.41370.340017
40-0.121443-1.18990.118512
410.0387260.37940.3526
420.0669210.65570.256797
430.0811980.79560.214122
440.0017410.01710.493214
45-0.146311-1.43360.077475
46-0.050799-0.49770.309908
47-0.031466-0.30830.37926
48-0.064277-0.62980.265166


Parameters (Session):
par1 = 48 ; par2 = 1 ; par3 = 0 ; par4 = 0 ; par5 = 12 ;
Parameters (R input):
par1 = 48 ; par2 = 1 ; par3 = 0 ; par4 = 0 ; par5 = 12 ;
R code (references can be found in the software module):
if (par1 == 'Default') {
par1 = 10*log10(length(x))
} else {
par1 <- as.numeric(par1)
}
par2 <- as.numeric(par2)
par3 <- as.numeric(par3)
par4 <- as.numeric(par4)
par5 <- as.numeric(par5)
if (par2 == 0) {
x <- log(x)
} else {
x <- (x ^ par2 - 1) / par2
}
if (par3 > 0) x <- diff(x,lag=1,difference=par3)
if (par4 > 0) x <- diff(x,lag=par5,difference=par4)
bitmap(file='pic1.png')
racf <- acf(x,par1,main='Autocorrelation',xlab='lags',ylab='ACF')
dev.off()
bitmap(file='pic2.png')
rpacf <- pacf(x,par1,main='Partial Autocorrelation',xlab='lags',ylab='PACF')
dev.off()
(myacf <- c(racf$acf))
(mypacf <- c(rpacf$acf))
lengthx <- length(x)
sqrtn <- sqrt(lengthx)
load(file='createtable')
a<-table.start()
a<-table.row.start(a)
a<-table.element(a,'Autocorrelation Function',4,TRUE)
a<-table.row.end(a)
a<-table.row.start(a)
a<-table.element(a,'Time lag k',header=TRUE)
a<-table.element(a,hyperlink('basics.htm','ACF(k)','click here for more information about the Autocorrelation Function'),header=TRUE)
a<-table.element(a,'T-STAT',header=TRUE)
a<-table.element(a,'P-value',header=TRUE)
a<-table.row.end(a)
for (i in 2:(par1+1)) {
a<-table.row.start(a)
a<-table.element(a,i-1,header=TRUE)
a<-table.element(a,round(myacf[i],6))
mytstat <- myacf[i]*sqrtn
a<-table.element(a,round(mytstat,4))
a<-table.element(a,round(1-pt(abs(mytstat),lengthx),6))
a<-table.row.end(a)
}
a<-table.end(a)
table.save(a,file='mytable.tab')
a<-table.start()
a<-table.row.start(a)
a<-table.element(a,'Partial Autocorrelation Function',4,TRUE)
a<-table.row.end(a)
a<-table.row.start(a)
a<-table.element(a,'Time lag k',header=TRUE)
a<-table.element(a,hyperlink('basics.htm','PACF(k)','click here for more information about the Partial Autocorrelation Function'),header=TRUE)
a<-table.element(a,'T-STAT',header=TRUE)
a<-table.element(a,'P-value',header=TRUE)
a<-table.row.end(a)
for (i in 1:par1) {
a<-table.row.start(a)
a<-table.element(a,i,header=TRUE)
a<-table.element(a,round(mypacf[i],6))
mytstat <- mypacf[i]*sqrtn
a<-table.element(a,round(mytstat,4))
a<-table.element(a,round(1-pt(abs(mytstat),lengthx),6))
a<-table.row.end(a)
}
a<-table.end(a)
table.save(a,file='mytable1.tab')