Free Statistics
of Irreproducible Research!
Description of Statistical Computation | |||||||||||||||||||||||||||||||||||||||||
|---|---|---|---|---|---|---|---|---|---|---|---|---|---|---|---|---|---|---|---|---|---|---|---|---|---|---|---|---|---|---|---|---|---|---|---|---|---|---|---|---|---|
| Author's title | |||||||||||||||||||||||||||||||||||||||||
| Author | *The author of this computation has been verified* | ||||||||||||||||||||||||||||||||||||||||
| R Software Module | rwasp_univariatedataseries.wasp | ||||||||||||||||||||||||||||||||||||||||
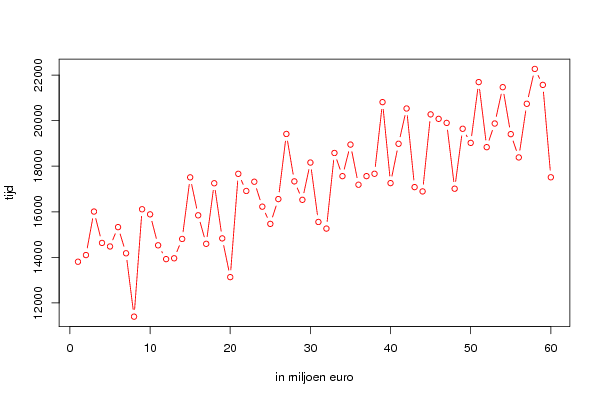
| Title produced by software | Univariate Data Series | ||||||||||||||||||||||||||||||||||||||||
| Date of computation | Thu, 27 Nov 2008 13:32:52 -0700 | ||||||||||||||||||||||||||||||||||||||||
| Cite this page as follows | Statistical Computations at FreeStatistics.org, Office for Research Development and Education, URL https://freestatistics.org/blog/index.php?v=date/2008/Nov/27/t122781801842rxvl3762copct.htm/, Retrieved Mon, 20 May 2024 08:17:20 +0000 | ||||||||||||||||||||||||||||||||||||||||
| Statistical Computations at FreeStatistics.org, Office for Research Development and Education, URL https://freestatistics.org/blog/index.php?pk=25895, Retrieved Mon, 20 May 2024 08:17:20 +0000 | |||||||||||||||||||||||||||||||||||||||||
| QR Codes: | |||||||||||||||||||||||||||||||||||||||||
|
| |||||||||||||||||||||||||||||||||||||||||
| Original text written by user: | |||||||||||||||||||||||||||||||||||||||||
| IsPrivate? | No (this computation is public) | ||||||||||||||||||||||||||||||||||||||||
| User-defined keywords | |||||||||||||||||||||||||||||||||||||||||
| Estimated Impact | 164 | ||||||||||||||||||||||||||||||||||||||||
Tree of Dependent Computations | |||||||||||||||||||||||||||||||||||||||||
| Family? (F = Feedback message, R = changed R code, M = changed R Module, P = changed Parameters, D = changed Data) | |||||||||||||||||||||||||||||||||||||||||
| - [Univariate Data Series] [totale uitvoer be...] [2008-11-27 20:32:52] [fdd69703d301fae09456f660b2f52997] [Current] - P [Univariate Data Series] [totale uitvoer be...] [2008-11-27 20:35:12] [1e1d8320a8a1170c475bf6e4ce119de6] - RMP [Central Tendency] [uitvoer totaal eu...] [2008-11-30 10:43:54] [1e1d8320a8a1170c475bf6e4ce119de6] - RMP [Standard Deviation-Mean Plot] [SDM plot total ex...] [2008-12-03 15:38:01] [1e1d8320a8a1170c475bf6e4ce119de6] - PD [Univariate Data Series] [uitvoer van belgi...] [2008-11-27 20:36:22] [1e1d8320a8a1170c475bf6e4ce119de6] - RMP [Central Tendency] [uitvoer frankrijk...] [2008-11-30 10:38:51] [1e1d8320a8a1170c475bf6e4ce119de6] - RMP [Variance Reduction Matrix] [VRM The Netherlands] [2008-12-08 00:28:03] [1e1d8320a8a1170c475bf6e4ce119de6] - RMP [Variance Reduction Matrix] [VRM France] [2008-12-08 00:32:47] [1e1d8320a8a1170c475bf6e4ce119de6] - PD [Univariate Data Series] [uitvoer van belgi...] [2008-11-27 20:37:44] [1e1d8320a8a1170c475bf6e4ce119de6] - RMP [Central Tendency] [uitvoer nederland...] [2008-11-30 10:40:40] [1e1d8320a8a1170c475bf6e4ce119de6] - RMP [Variance Reduction Matrix] [VRM The Netherlands] [2008-12-08 00:31:03] [1e1d8320a8a1170c475bf6e4ce119de6] - RMP [(Partial) Autocorrelation Function] [H2: PACF The Neth...] [2008-12-13 18:27:32] [1e1d8320a8a1170c475bf6e4ce119de6] - PD [Univariate Data Series] [uitvoer van belgi...] [2008-11-27 20:39:12] [1e1d8320a8a1170c475bf6e4ce119de6] - RMP [Central Tendency] [uitvoer polen cen...] [2008-11-30 10:42:08] [1e1d8320a8a1170c475bf6e4ce119de6] | |||||||||||||||||||||||||||||||||||||||||
| Feedback Forum | |||||||||||||||||||||||||||||||||||||||||
Post a new message | |||||||||||||||||||||||||||||||||||||||||
Dataset | |||||||||||||||||||||||||||||||||||||||||
| Dataseries X: | |||||||||||||||||||||||||||||||||||||||||
13807.9 14101.7 16010.3 14633.1 14478.5 15327.3 14179.5 11398.2 16111.5 15887.4 14529.3 13923.1 13960.2 14807.8 17511.5 15845.9 14594.2 17252.2 14832.8 13132.1 17665.9 16913 17318.8 16224.2 15469.6 16557.5 19414.8 17335 16525.2 18160.4 15553.8 15262.2 18581 17564.1 18948.6 17187.8 17564.8 17668.4 20811.7 17257.8 18984.2 20532.6 17082.3 16894.9 20274.9 20078.6 19900.9 17012.2 19642.9 19024 21691 18835.9 19873.4 21468.2 19406.8 18385.3 20739.3 22268.3 21569 17514.8 | |||||||||||||||||||||||||||||||||||||||||
Tables (Output of Computation) | |||||||||||||||||||||||||||||||||||||||||
| |||||||||||||||||||||||||||||||||||||||||
Figures (Output of Computation) | |||||||||||||||||||||||||||||||||||||||||
Input Parameters & R Code | |||||||||||||||||||||||||||||||||||||||||
| Parameters (Session): | |||||||||||||||||||||||||||||||||||||||||
| par1 = totale uitvoer belgie in eu ; par2 = http://www.nbb.be/belgostat/PublicatieSelectieLinker?LinkID=931000000|910000082&Lang=E ; | |||||||||||||||||||||||||||||||||||||||||
| Parameters (R input): | |||||||||||||||||||||||||||||||||||||||||
| par1 = totale uitvoer belgie in eu ; par2 = http://www.nbb.be/belgostat/PublicatieSelectieLinker?LinkID=931000000|910000082&Lang=E ; par3 = ; | |||||||||||||||||||||||||||||||||||||||||
| R code (references can be found in the software module): | |||||||||||||||||||||||||||||||||||||||||
bitmap(file='test1.png') | |||||||||||||||||||||||||||||||||||||||||