Free Statistics

of Irreproducible Research!

Author's title

Author*The author of this computation has been verified*
R Software Modulerwasp_multipleregression.wasp
Title produced by softwareMultiple Regression
Date of computationThu, 27 Nov 2008 13:00:49 -0700
Cite this page as followsStatistical Computations at FreeStatistics.org, Office for Research Development and Education, URL https://freestatistics.org/blog/index.php?v=date/2008/Nov/27/t1227816570ntoagqivt7ok4wv.htm/, Retrieved Mon, 20 May 2024 11:46:46 +0000
Statistical Computations at FreeStatistics.org, Office for Research Development and Education, URL https://freestatistics.org/blog/index.php?pk=25891, Retrieved Mon, 20 May 2024 11:46:46 +0000
QR Codes:

Original text written by user:
IsPrivate?No (this computation is public)
User-defined keywords
Estimated Impact155
Family? (F = Feedback message, R = changed R code, M = changed R Module, P = changed Parameters, D = changed Data)
-     [Multiple Regression] [multiple regressi...] [2008-11-23 19:39:24] [7a664918911e34206ce9d0436dd7c1c8]
F   PD    [Multiple Regression] [Investeringen met...] [2008-11-27 20:00:49] [98255691c21504803b38711776845ae0] [Current]
Feedback Forum
2008-11-30 17:49:07 [Angelique Van de Vijver] [reply
Q3 : Goed van de student om het verschil te laten zien tussen die 2 berekeningen. De eerste berekening houdt geen rekening met seizoenaliteit en trends en de tweede berekening houdt hiermee wel rekening. De 2e berekening geeft inderdaad een beter model weer want deze heeft een lagere residuele S.D. (14.5112.48). De foutenmarge is bij de 2e berekening dus kleiner.
De adjusted R-kwadraat ven de eerste berekening(0.198) ligt ook veel lager dan deze van de 2e berekening(0.41). We kunnen dus bij de 2e berekening meer van de variabiliteit verklaren.
Hieruit kunnen we dus besluiten dat de 2e berekening een beter model is.

Het intercept (107.82) is inderdaad een constante. Het geeft hier het gemiddelde indexcijfer van de hoeveelheid investeringsgoederen weer per maand.
Goede uitleg van de dummy. Deze is hier 18.76.
Aangezien de data begint bij februari is hier de referentiemaand januari. Als de parameters bij die verschillende maanden negatief zijn wil dit inderdaad zeggen dat het indexcijfer van de hoeveelheid investeringsgoederen lager was in deze maand dan in januari. Als deze positief zijn wil dat dus zeggen dat het indexcijfer van deze maand hoger was dan in januari. We zien dat sommige parameters positief zijn en andere negatief. Er zijn dus maanden waarin de hoeveelheid investeringen hoger lag dan de referentiemaand januari, en maanden waar de hoeveelheid lager lag dan in januari.
T is inderdaad de lange termijn trend. Hier is er dus een negatieve lange termijn trend. Het indexcijfer van de investeringsgoederen zal gemiddeld dalen met 0.071.
De student heeft hier een verkeerd getal (1.76)gebruikt in zijn conclusie (dit getal komt uit de vorige vraag).
We kunnen hier inderdaad amper 41% verklaren van de schommelingen. Dit is inderdaad niet zo veel.

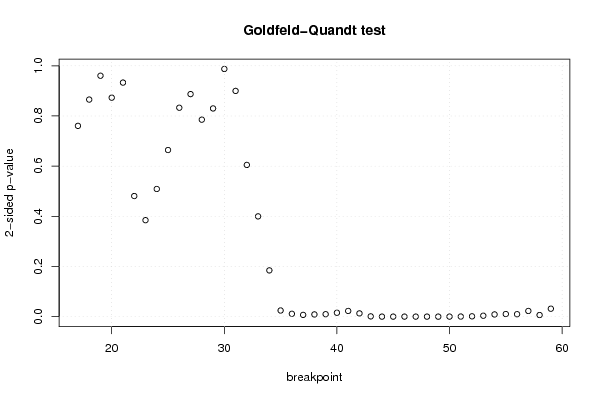
Goed van de student om hier de tweezijdige toets te gebruiken aangezien we hier geen voorkennis hebben. Aangezien de p-waarden bijna allemaal groter zijn dan 0.05 zijn de verschillen niet significant en is er een grote kans dat deze te wijten zijn aan het toeval.
Goede opmerking van de student over de standaardafwijking.
De student heeft echter niks vermeld over de T-statistiek: Hier zien we dat bijna alle absolute waarden hiervan kleiner zijn dan 2 wat er dus op wijst dat de verschillen niet significant verschillend van 0 zijn.

Op de actuals en interpolation-grafiek zie je inderdaad een ‘breuk’ op de 35e meting. Dan begint er een stijgende trend i.p.v. een dalende trend.
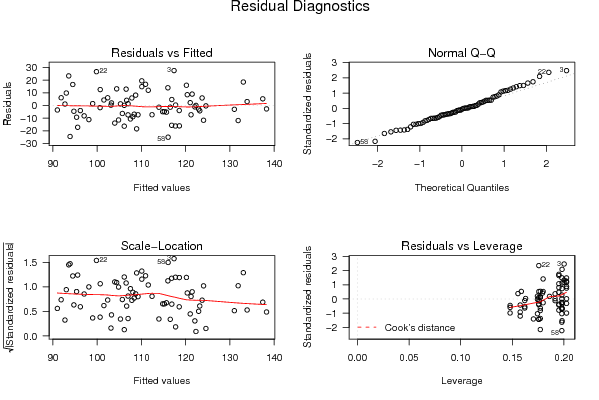
Op de residuals grafiek zien we inderdaad dat het gemiddelde van de voorspellingsfouten niet gelijk is aan 0. Hier kan je spreken van een min of meer negatieve autocorrelatie omdat schommelingen sterk op en neer gaan. Wat de student bespreekt gaat over positieve autocorrelatie.
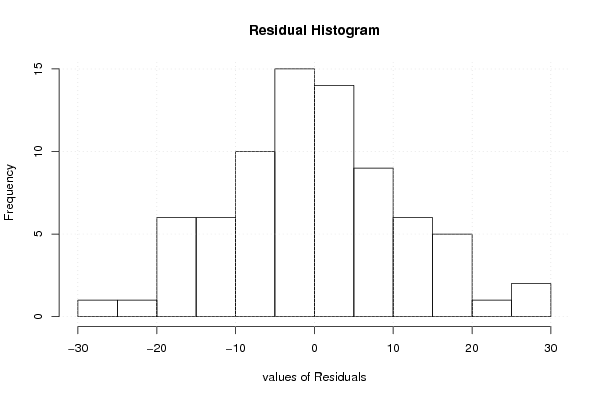
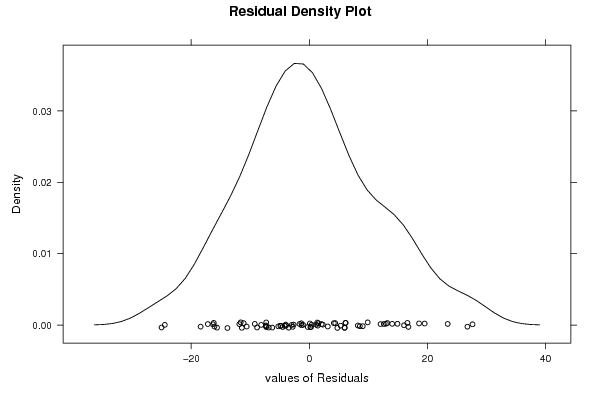
Het histogram loopt inderdaad volgens een normaalverdeling zoals de student zegt. Ook de residual density plot is min of meer normaal verdeeld maar je kan ook wel een lichte rechtsscheve verdeling zien zoals de student aangeeft.
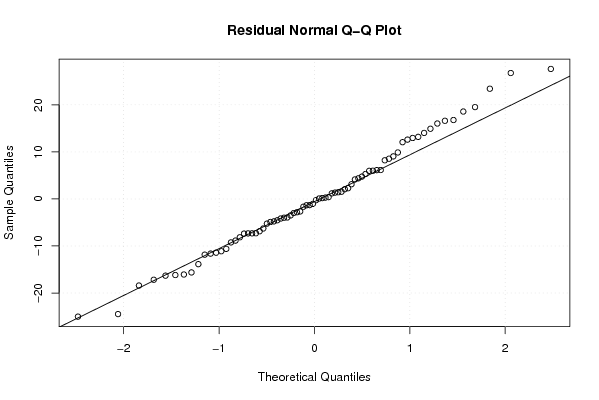
Op de residual normal QQ-plot zien we dat de puntenwolk de rechte ongeveer volgt. De voorspellingsfouten lopen dus min of meer zoals een normaalverdeling. Aan de staarten kan je inderdaad wel punten zien die licht afwijken van de rechte.
Goede verklaring van wat de residual lag plot laat zien. We zien een zeer kleine correlatie, maar de gegevens liggen wel redelijk gespreid zoals de student ook aangeeft.
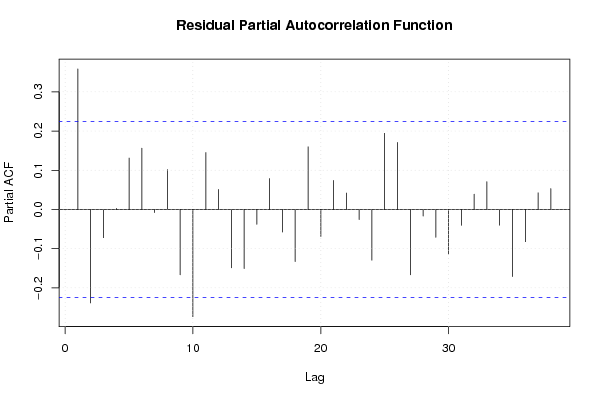
Goede uitleg van de residual autocorrelatie-functie. Als we naar deze grafiek kijken zien we inderdaad weinig uitschieters en dus weinig significante verschillen.

Post a new message
Dataseries X:
119,5	0
125	0
145	0
105,3	0
116,9	0
120,1	0
88,9	0
78,4	0
114,6	0
113,3	0
117	0
99,6	0
99,4	0
101,9	0
115,2	0
108,5	0
113,8	0
121	0
92,2	0
90,2	0
101,5	0
126,6	0
93,9	0
89,8	0
93,4	0
101,5	0
110,4	0
105,9	0
108,4	0
113,9	0
86,1	0
69,4	0
101,2	0
100,5	0
98	0
106,6	0
90,1	0
96,9	0
109,9	0
99	0
106,3	0
128,9	0
111,1	0
102,9	0
130	0
87	0
87,5	0
117,6	0
103,4	0
110,8	0
112,6	0
102,5	1
112,4	1
135,6	1
105,1	1
127,7	1
137	1
91	1
90,5	1
122,4	1
123,3	1
124,3	1
120	1
118,1	1
119	1
142,7	1
123,6	1
129,6	1
151,6	1
110,4	1
99,2	1
130,5	1
136,2	1
129,7	1
128	1
121,6	1


Summary of computational transaction
Raw Inputview raw input (R code)
Raw Outputview raw output of R engine
Computing time24 seconds
R Server'George Udny Yule' @ 72.249.76.132

\begin{tabular}{lllllllll}
\hline
Summary of computational transaction \tabularnewline
Raw Input & view raw input (R code)  \tabularnewline
Raw Output & view raw output of R engine  \tabularnewline
Computing time & 24 seconds \tabularnewline
R Server & 'George Udny Yule' @ 72.249.76.132 \tabularnewline
\hline
\end{tabular}
%Source: https://freestatistics.org/blog/index.php?pk=25891&T=0

[TABLE]
[ROW][C]Summary of computational transaction[/C][/ROW]
[ROW][C]Raw Input[/C][C]view raw input (R code) [/C][/ROW]
[ROW][C]Raw Output[/C][C]view raw output of R engine [/C][/ROW]
[ROW][C]Computing time[/C][C]24 seconds[/C][/ROW]
[ROW][C]R Server[/C][C]'George Udny Yule' @ 72.249.76.132[/C][/ROW]
[/TABLE]
Source: https://freestatistics.org/blog/index.php?pk=25891&T=0

Globally Unique Identifier (entire table): ba.freestatistics.org/blog/index.php?pk=25891&T=0

As an alternative you can also use a QR Code:  

The GUIDs for individual cells are displayed in the table below:

Summary of computational transaction
Raw Inputview raw input (R code)
Raw Outputview raw output of R engine
Computing time24 seconds
R Server'George Udny Yule' @ 72.249.76.132


Multiple Linear Regression - Estimated Regression Equation
invest[t] = + 107.824598610113 + 18.7627965492451dummyvar[t] -1.21790621113053M1[t] + 2.39627309346937M2[t] + 9.75330954092637M3[t] -4.31291066150878M4[t] + 1.21741153446764M5[t] + 15.5220670295437M6[t] -10.2732774753803M7[t] -11.6686219803042M8[t] + 11.3527001814385M9[t] -6.42597765681877M10[t] -13.4713221617427M11[t] -0.0713221617427219t + e[t]

\begin{tabular}{lllllllll}
\hline
Multiple Linear Regression - Estimated Regression Equation \tabularnewline
invest[t] =  +  107.824598610113 +  18.7627965492451dummyvar[t] -1.21790621113053M1[t] +  2.39627309346937M2[t] +  9.75330954092637M3[t] -4.31291066150878M4[t] +  1.21741153446764M5[t] +  15.5220670295437M6[t] -10.2732774753803M7[t] -11.6686219803042M8[t] +  11.3527001814385M9[t] -6.42597765681877M10[t] -13.4713221617427M11[t] -0.0713221617427219t  + e[t] \tabularnewline
\hline
\end{tabular}
%Source: https://freestatistics.org/blog/index.php?pk=25891&T=1

[TABLE]
[ROW][C]Multiple Linear Regression - Estimated Regression Equation[/C][/ROW]
[ROW][C]invest[t] =  +  107.824598610113 +  18.7627965492451dummyvar[t] -1.21790621113053M1[t] +  2.39627309346937M2[t] +  9.75330954092637M3[t] -4.31291066150878M4[t] +  1.21741153446764M5[t] +  15.5220670295437M6[t] -10.2732774753803M7[t] -11.6686219803042M8[t] +  11.3527001814385M9[t] -6.42597765681877M10[t] -13.4713221617427M11[t] -0.0713221617427219t  + e[t][/C][/ROW]
[/TABLE]
Source: https://freestatistics.org/blog/index.php?pk=25891&T=1

Globally Unique Identifier (entire table): ba.freestatistics.org/blog/index.php?pk=25891&T=1

As an alternative you can also use a QR Code:  

The GUIDs for individual cells are displayed in the table below:

Multiple Linear Regression - Estimated Regression Equation
invest[t] = + 107.824598610113 + 18.7627965492451dummyvar[t] -1.21790621113053M1[t] + 2.39627309346937M2[t] + 9.75330954092637M3[t] -4.31291066150878M4[t] + 1.21741153446764M5[t] + 15.5220670295437M6[t] -10.2732774753803M7[t] -11.6686219803042M8[t] + 11.3527001814385M9[t] -6.42597765681877M10[t] -13.4713221617427M11[t] -0.0713221617427219t + e[t]


Multiple Linear Regression - Ordinary Least Squares
VariableParameterS.D.T-STATH0: parameter = 02-tail p-value1-tail p-value
(Intercept)107.8245986101136.1745417.462800
dummyvar18.76279654924515.3131563.53140.0007860.000393
M1-1.217906211130536.955825-0.17510.8615780.430789
M22.396273093469376.9508230.34470.7314520.365726
M39.753309540926376.9476831.40380.1653610.082681
M4-4.312910661508786.980498-0.61790.5389360.269468
M51.217411534467647.2509540.16790.8672110.433605
M615.52206702954377.2393222.14410.0359510.017975
M7-10.27327747538037.229465-1.4210.1603190.080159
M8-11.66862198030427.22139-1.61580.1112060.055603
M911.35270018143857.2151041.57350.1207010.060351
M10-6.425977656818777.21061-0.89120.3762760.188138
M11-13.47132216174277.207912-1.8690.0663530.033177
t-0.07132216174272190.113866-0.62640.5333740.266687

\begin{tabular}{lllllllll}
\hline
Multiple Linear Regression - Ordinary Least Squares \tabularnewline
Variable & Parameter & S.D. & T-STATH0: parameter = 0 & 2-tail p-value & 1-tail p-value \tabularnewline
(Intercept) & 107.824598610113 & 6.17454 & 17.4628 & 0 & 0 \tabularnewline
dummyvar & 18.7627965492451 & 5.313156 & 3.5314 & 0.000786 & 0.000393 \tabularnewline
M1 & -1.21790621113053 & 6.955825 & -0.1751 & 0.861578 & 0.430789 \tabularnewline
M2 & 2.39627309346937 & 6.950823 & 0.3447 & 0.731452 & 0.365726 \tabularnewline
M3 & 9.75330954092637 & 6.947683 & 1.4038 & 0.165361 & 0.082681 \tabularnewline
M4 & -4.31291066150878 & 6.980498 & -0.6179 & 0.538936 & 0.269468 \tabularnewline
M5 & 1.21741153446764 & 7.250954 & 0.1679 & 0.867211 & 0.433605 \tabularnewline
M6 & 15.5220670295437 & 7.239322 & 2.1441 & 0.035951 & 0.017975 \tabularnewline
M7 & -10.2732774753803 & 7.229465 & -1.421 & 0.160319 & 0.080159 \tabularnewline
M8 & -11.6686219803042 & 7.22139 & -1.6158 & 0.111206 & 0.055603 \tabularnewline
M9 & 11.3527001814385 & 7.215104 & 1.5735 & 0.120701 & 0.060351 \tabularnewline
M10 & -6.42597765681877 & 7.21061 & -0.8912 & 0.376276 & 0.188138 \tabularnewline
M11 & -13.4713221617427 & 7.207912 & -1.869 & 0.066353 & 0.033177 \tabularnewline
t & -0.0713221617427219 & 0.113866 & -0.6264 & 0.533374 & 0.266687 \tabularnewline
\hline
\end{tabular}
%Source: https://freestatistics.org/blog/index.php?pk=25891&T=2

[TABLE]
[ROW][C]Multiple Linear Regression - Ordinary Least Squares[/C][/ROW]
[ROW][C]Variable[/C][C]Parameter[/C][C]S.D.[/C][C]T-STATH0: parameter = 0[/C][C]2-tail p-value[/C][C]1-tail p-value[/C][/ROW]
[ROW][C](Intercept)[/C][C]107.824598610113[/C][C]6.17454[/C][C]17.4628[/C][C]0[/C][C]0[/C][/ROW]
[ROW][C]dummyvar[/C][C]18.7627965492451[/C][C]5.313156[/C][C]3.5314[/C][C]0.000786[/C][C]0.000393[/C][/ROW]
[ROW][C]M1[/C][C]-1.21790621113053[/C][C]6.955825[/C][C]-0.1751[/C][C]0.861578[/C][C]0.430789[/C][/ROW]
[ROW][C]M2[/C][C]2.39627309346937[/C][C]6.950823[/C][C]0.3447[/C][C]0.731452[/C][C]0.365726[/C][/ROW]
[ROW][C]M3[/C][C]9.75330954092637[/C][C]6.947683[/C][C]1.4038[/C][C]0.165361[/C][C]0.082681[/C][/ROW]
[ROW][C]M4[/C][C]-4.31291066150878[/C][C]6.980498[/C][C]-0.6179[/C][C]0.538936[/C][C]0.269468[/C][/ROW]
[ROW][C]M5[/C][C]1.21741153446764[/C][C]7.250954[/C][C]0.1679[/C][C]0.867211[/C][C]0.433605[/C][/ROW]
[ROW][C]M6[/C][C]15.5220670295437[/C][C]7.239322[/C][C]2.1441[/C][C]0.035951[/C][C]0.017975[/C][/ROW]
[ROW][C]M7[/C][C]-10.2732774753803[/C][C]7.229465[/C][C]-1.421[/C][C]0.160319[/C][C]0.080159[/C][/ROW]
[ROW][C]M8[/C][C]-11.6686219803042[/C][C]7.22139[/C][C]-1.6158[/C][C]0.111206[/C][C]0.055603[/C][/ROW]
[ROW][C]M9[/C][C]11.3527001814385[/C][C]7.215104[/C][C]1.5735[/C][C]0.120701[/C][C]0.060351[/C][/ROW]
[ROW][C]M10[/C][C]-6.42597765681877[/C][C]7.21061[/C][C]-0.8912[/C][C]0.376276[/C][C]0.188138[/C][/ROW]
[ROW][C]M11[/C][C]-13.4713221617427[/C][C]7.207912[/C][C]-1.869[/C][C]0.066353[/C][C]0.033177[/C][/ROW]
[ROW][C]t[/C][C]-0.0713221617427219[/C][C]0.113866[/C][C]-0.6264[/C][C]0.533374[/C][C]0.266687[/C][/ROW]
[/TABLE]
Source: https://freestatistics.org/blog/index.php?pk=25891&T=2

Globally Unique Identifier (entire table): ba.freestatistics.org/blog/index.php?pk=25891&T=2

As an alternative you can also use a QR Code:  

The GUIDs for individual cells are displayed in the table below:

Multiple Linear Regression - Ordinary Least Squares
VariableParameterS.D.T-STATH0: parameter = 02-tail p-value1-tail p-value
(Intercept)107.8245986101136.1745417.462800
dummyvar18.76279654924515.3131563.53140.0007860.000393
M1-1.217906211130536.955825-0.17510.8615780.430789
M22.396273093469376.9508230.34470.7314520.365726
M39.753309540926376.9476831.40380.1653610.082681
M4-4.312910661508786.980498-0.61790.5389360.269468
M51.217411534467647.2509540.16790.8672110.433605
M615.52206702954377.2393222.14410.0359510.017975
M7-10.27327747538037.229465-1.4210.1603190.080159
M8-11.66862198030427.22139-1.61580.1112060.055603
M911.35270018143857.2151041.57350.1207010.060351
M10-6.425977656818777.21061-0.89120.3762760.188138
M11-13.47132216174277.207912-1.8690.0663530.033177
t-0.07132216174272190.113866-0.62640.5333740.266687


Multiple Linear Regression - Regression Statistics
Multiple R0.713721327038836
R-squared0.509398132670077
Adjusted R-squared0.406529999197674
F-TEST (value)4.95195271339044
F-TEST (DF numerator)13
F-TEST (DF denominator)62
p-value7.17369109004551e-06
Multiple Linear Regression - Residual Statistics
Residual Standard Deviation12.4829117508561
Sum Squared Residuals9661.03131833897

\begin{tabular}{lllllllll}
\hline
Multiple Linear Regression - Regression Statistics \tabularnewline
Multiple R & 0.713721327038836 \tabularnewline
R-squared & 0.509398132670077 \tabularnewline
Adjusted R-squared & 0.406529999197674 \tabularnewline
F-TEST (value) & 4.95195271339044 \tabularnewline
F-TEST (DF numerator) & 13 \tabularnewline
F-TEST (DF denominator) & 62 \tabularnewline
p-value & 7.17369109004551e-06 \tabularnewline
Multiple Linear Regression - Residual Statistics \tabularnewline
Residual Standard Deviation & 12.4829117508561 \tabularnewline
Sum Squared Residuals & 9661.03131833897 \tabularnewline
\hline
\end{tabular}
%Source: https://freestatistics.org/blog/index.php?pk=25891&T=3

[TABLE]
[ROW][C]Multiple Linear Regression - Regression Statistics[/C][/ROW]
[ROW][C]Multiple R[/C][C]0.713721327038836[/C][/ROW]
[ROW][C]R-squared[/C][C]0.509398132670077[/C][/ROW]
[ROW][C]Adjusted R-squared[/C][C]0.406529999197674[/C][/ROW]
[ROW][C]F-TEST (value)[/C][C]4.95195271339044[/C][/ROW]
[ROW][C]F-TEST (DF numerator)[/C][C]13[/C][/ROW]
[ROW][C]F-TEST (DF denominator)[/C][C]62[/C][/ROW]
[ROW][C]p-value[/C][C]7.17369109004551e-06[/C][/ROW]
[ROW][C]Multiple Linear Regression - Residual Statistics[/C][/ROW]
[ROW][C]Residual Standard Deviation[/C][C]12.4829117508561[/C][/ROW]
[ROW][C]Sum Squared Residuals[/C][C]9661.03131833897[/C][/ROW]
[/TABLE]
Source: https://freestatistics.org/blog/index.php?pk=25891&T=3

Globally Unique Identifier (entire table): ba.freestatistics.org/blog/index.php?pk=25891&T=3

As an alternative you can also use a QR Code:  

The GUIDs for individual cells are displayed in the table below:

Multiple Linear Regression - Regression Statistics
Multiple R0.713721327038836
R-squared0.509398132670077
Adjusted R-squared0.406529999197674
F-TEST (value)4.95195271339044
F-TEST (DF numerator)13
F-TEST (DF denominator)62
p-value7.17369109004551e-06
Multiple Linear Regression - Residual Statistics
Residual Standard Deviation12.4829117508561
Sum Squared Residuals9661.03131833897


Multiple Linear Regression - Actuals, Interpolation, and Residuals
Time or IndexActualsInterpolationForecastResidualsPrediction Error
1119.5106.53537023724012.9646297627604
2125110.07822738009714.9217726199035
3145117.36394166581127.6360583341892
4105.3103.2263993016332.07360069836706
5116.9108.6853993358678.21460066413341
6120.1122.9187326692-2.81873266919994
788.997.0520660025333-8.1520660025333
878.495.5853993358666-17.1853993358666
9114.6118.535399335867-3.93539933586661
10113.3100.68539933586712.6146006641334
1111793.568732669223.4312673308000
1299.6106.9687326692-7.36873266919994
1399.4105.679504296327-6.27950429632668
14101.9109.222361439184-7.32236143918386
15115.2116.508075724898-1.30807572489815
16108.5102.3705333607206.12946663927973
17113.8107.8295333949545.97046660504604
18121122.062866728287-1.06286672828728
1992.296.1962000616206-3.99620006162062
2090.294.729533394954-4.52953339495395
21101.5117.679533394954-16.1795333949539
22126.699.82953339495426.7704666050460
2393.992.71286672828731.18713327171272
2489.8106.112866728287-16.3128667282873
2593.4104.823638355414-11.423638355414
26101.5108.366495498271-6.8664954982712
27110.4115.652209783985-5.25220978398549
28105.9101.5146674198084.3853325801924
29108.4106.9736674540411.42633254595871
30113.9121.207000787375-7.30700078737462
3186.195.340334120708-9.24033412070796
3269.493.8736674540413-24.4736674540413
33101.2116.823667454041-15.6236674540413
34100.598.97366745404131.52633254595872
359891.85700078737466.14299921262538
36106.6105.2570007873751.34299921262538
3790.1103.967772414501-13.8677724145014
3896.9107.510629557359-10.6106295573585
39109.9114.796343843073-4.89634384307282
4099100.658801478895-1.65880147889494
41106.3106.1178015131290.182198486871365
42128.9120.3511348464628.54886515353805
43111.194.484468179795316.6155318202047
44102.993.01780151312869.88219848687138
45130115.96780151312914.0321984868714
468798.1178015131286-11.1178015131286
4787.591.001134846462-3.50113484646196
48117.6104.40113484646213.1988651535380
49103.4103.1119064735890.288093526411324
50110.8106.6547636164464.14523638355412
51112.6113.940477902160-1.34047790216017
52102.5118.565732087227-16.0657320872274
53112.4124.024732121461-11.6247321214611
54135.6138.258065454794-2.65806545479442
55105.1112.391398788128-7.29139878812776
56127.7110.92473212146116.7752678785389
57137133.8747321214613.12526787853891
5891116.024732121461-25.0247321214611
5990.5108.908065454794-18.4080654547944
60122.4122.3080654547940.091934545205594
61123.3121.0188370819212.28116291807885
62124.3124.561694224778-0.261694224778342
63120131.847408510493-11.8474085104926
64118.1117.7098661463150.390133853685246
65119123.168866180548-4.16886618054843
66142.7137.4021995138825.29780048611823
67123.6111.53553284721512.0644671527849
68129.6110.06886618054819.5311338194516
69151.6133.01886618054818.5811338194516
70110.4115.168866180548-4.76886618054842
7199.2108.052199513882-8.85219951388176
72130.5121.4521995138829.04780048611825
73136.2120.16297114100816.0370288589915
74129.7123.7058282838665.99417171613431
75128130.99154256958-2.99154256957996
76121.6116.8540002054024.74599979459791

\begin{tabular}{lllllllll}
\hline
Multiple Linear Regression - Actuals, Interpolation, and Residuals \tabularnewline
Time or Index & Actuals & InterpolationForecast & ResidualsPrediction Error \tabularnewline
1 & 119.5 & 106.535370237240 & 12.9646297627604 \tabularnewline
2 & 125 & 110.078227380097 & 14.9217726199035 \tabularnewline
3 & 145 & 117.363941665811 & 27.6360583341892 \tabularnewline
4 & 105.3 & 103.226399301633 & 2.07360069836706 \tabularnewline
5 & 116.9 & 108.685399335867 & 8.21460066413341 \tabularnewline
6 & 120.1 & 122.9187326692 & -2.81873266919994 \tabularnewline
7 & 88.9 & 97.0520660025333 & -8.1520660025333 \tabularnewline
8 & 78.4 & 95.5853993358666 & -17.1853993358666 \tabularnewline
9 & 114.6 & 118.535399335867 & -3.93539933586661 \tabularnewline
10 & 113.3 & 100.685399335867 & 12.6146006641334 \tabularnewline
11 & 117 & 93.5687326692 & 23.4312673308000 \tabularnewline
12 & 99.6 & 106.9687326692 & -7.36873266919994 \tabularnewline
13 & 99.4 & 105.679504296327 & -6.27950429632668 \tabularnewline
14 & 101.9 & 109.222361439184 & -7.32236143918386 \tabularnewline
15 & 115.2 & 116.508075724898 & -1.30807572489815 \tabularnewline
16 & 108.5 & 102.370533360720 & 6.12946663927973 \tabularnewline
17 & 113.8 & 107.829533394954 & 5.97046660504604 \tabularnewline
18 & 121 & 122.062866728287 & -1.06286672828728 \tabularnewline
19 & 92.2 & 96.1962000616206 & -3.99620006162062 \tabularnewline
20 & 90.2 & 94.729533394954 & -4.52953339495395 \tabularnewline
21 & 101.5 & 117.679533394954 & -16.1795333949539 \tabularnewline
22 & 126.6 & 99.829533394954 & 26.7704666050460 \tabularnewline
23 & 93.9 & 92.7128667282873 & 1.18713327171272 \tabularnewline
24 & 89.8 & 106.112866728287 & -16.3128667282873 \tabularnewline
25 & 93.4 & 104.823638355414 & -11.423638355414 \tabularnewline
26 & 101.5 & 108.366495498271 & -6.8664954982712 \tabularnewline
27 & 110.4 & 115.652209783985 & -5.25220978398549 \tabularnewline
28 & 105.9 & 101.514667419808 & 4.3853325801924 \tabularnewline
29 & 108.4 & 106.973667454041 & 1.42633254595871 \tabularnewline
30 & 113.9 & 121.207000787375 & -7.30700078737462 \tabularnewline
31 & 86.1 & 95.340334120708 & -9.24033412070796 \tabularnewline
32 & 69.4 & 93.8736674540413 & -24.4736674540413 \tabularnewline
33 & 101.2 & 116.823667454041 & -15.6236674540413 \tabularnewline
34 & 100.5 & 98.9736674540413 & 1.52633254595872 \tabularnewline
35 & 98 & 91.8570007873746 & 6.14299921262538 \tabularnewline
36 & 106.6 & 105.257000787375 & 1.34299921262538 \tabularnewline
37 & 90.1 & 103.967772414501 & -13.8677724145014 \tabularnewline
38 & 96.9 & 107.510629557359 & -10.6106295573585 \tabularnewline
39 & 109.9 & 114.796343843073 & -4.89634384307282 \tabularnewline
40 & 99 & 100.658801478895 & -1.65880147889494 \tabularnewline
41 & 106.3 & 106.117801513129 & 0.182198486871365 \tabularnewline
42 & 128.9 & 120.351134846462 & 8.54886515353805 \tabularnewline
43 & 111.1 & 94.4844681797953 & 16.6155318202047 \tabularnewline
44 & 102.9 & 93.0178015131286 & 9.88219848687138 \tabularnewline
45 & 130 & 115.967801513129 & 14.0321984868714 \tabularnewline
46 & 87 & 98.1178015131286 & -11.1178015131286 \tabularnewline
47 & 87.5 & 91.001134846462 & -3.50113484646196 \tabularnewline
48 & 117.6 & 104.401134846462 & 13.1988651535380 \tabularnewline
49 & 103.4 & 103.111906473589 & 0.288093526411324 \tabularnewline
50 & 110.8 & 106.654763616446 & 4.14523638355412 \tabularnewline
51 & 112.6 & 113.940477902160 & -1.34047790216017 \tabularnewline
52 & 102.5 & 118.565732087227 & -16.0657320872274 \tabularnewline
53 & 112.4 & 124.024732121461 & -11.6247321214611 \tabularnewline
54 & 135.6 & 138.258065454794 & -2.65806545479442 \tabularnewline
55 & 105.1 & 112.391398788128 & -7.29139878812776 \tabularnewline
56 & 127.7 & 110.924732121461 & 16.7752678785389 \tabularnewline
57 & 137 & 133.874732121461 & 3.12526787853891 \tabularnewline
58 & 91 & 116.024732121461 & -25.0247321214611 \tabularnewline
59 & 90.5 & 108.908065454794 & -18.4080654547944 \tabularnewline
60 & 122.4 & 122.308065454794 & 0.091934545205594 \tabularnewline
61 & 123.3 & 121.018837081921 & 2.28116291807885 \tabularnewline
62 & 124.3 & 124.561694224778 & -0.261694224778342 \tabularnewline
63 & 120 & 131.847408510493 & -11.8474085104926 \tabularnewline
64 & 118.1 & 117.709866146315 & 0.390133853685246 \tabularnewline
65 & 119 & 123.168866180548 & -4.16886618054843 \tabularnewline
66 & 142.7 & 137.402199513882 & 5.29780048611823 \tabularnewline
67 & 123.6 & 111.535532847215 & 12.0644671527849 \tabularnewline
68 & 129.6 & 110.068866180548 & 19.5311338194516 \tabularnewline
69 & 151.6 & 133.018866180548 & 18.5811338194516 \tabularnewline
70 & 110.4 & 115.168866180548 & -4.76886618054842 \tabularnewline
71 & 99.2 & 108.052199513882 & -8.85219951388176 \tabularnewline
72 & 130.5 & 121.452199513882 & 9.04780048611825 \tabularnewline
73 & 136.2 & 120.162971141008 & 16.0370288589915 \tabularnewline
74 & 129.7 & 123.705828283866 & 5.99417171613431 \tabularnewline
75 & 128 & 130.99154256958 & -2.99154256957996 \tabularnewline
76 & 121.6 & 116.854000205402 & 4.74599979459791 \tabularnewline
\hline
\end{tabular}
%Source: https://freestatistics.org/blog/index.php?pk=25891&T=4

[TABLE]
[ROW][C]Multiple Linear Regression - Actuals, Interpolation, and Residuals[/C][/ROW]
[ROW][C]Time or Index[/C][C]Actuals[/C][C]InterpolationForecast[/C][C]ResidualsPrediction Error[/C][/ROW]
[ROW][C]1[/C][C]119.5[/C][C]106.535370237240[/C][C]12.9646297627604[/C][/ROW]
[ROW][C]2[/C][C]125[/C][C]110.078227380097[/C][C]14.9217726199035[/C][/ROW]
[ROW][C]3[/C][C]145[/C][C]117.363941665811[/C][C]27.6360583341892[/C][/ROW]
[ROW][C]4[/C][C]105.3[/C][C]103.226399301633[/C][C]2.07360069836706[/C][/ROW]
[ROW][C]5[/C][C]116.9[/C][C]108.685399335867[/C][C]8.21460066413341[/C][/ROW]
[ROW][C]6[/C][C]120.1[/C][C]122.9187326692[/C][C]-2.81873266919994[/C][/ROW]
[ROW][C]7[/C][C]88.9[/C][C]97.0520660025333[/C][C]-8.1520660025333[/C][/ROW]
[ROW][C]8[/C][C]78.4[/C][C]95.5853993358666[/C][C]-17.1853993358666[/C][/ROW]
[ROW][C]9[/C][C]114.6[/C][C]118.535399335867[/C][C]-3.93539933586661[/C][/ROW]
[ROW][C]10[/C][C]113.3[/C][C]100.685399335867[/C][C]12.6146006641334[/C][/ROW]
[ROW][C]11[/C][C]117[/C][C]93.5687326692[/C][C]23.4312673308000[/C][/ROW]
[ROW][C]12[/C][C]99.6[/C][C]106.9687326692[/C][C]-7.36873266919994[/C][/ROW]
[ROW][C]13[/C][C]99.4[/C][C]105.679504296327[/C][C]-6.27950429632668[/C][/ROW]
[ROW][C]14[/C][C]101.9[/C][C]109.222361439184[/C][C]-7.32236143918386[/C][/ROW]
[ROW][C]15[/C][C]115.2[/C][C]116.508075724898[/C][C]-1.30807572489815[/C][/ROW]
[ROW][C]16[/C][C]108.5[/C][C]102.370533360720[/C][C]6.12946663927973[/C][/ROW]
[ROW][C]17[/C][C]113.8[/C][C]107.829533394954[/C][C]5.97046660504604[/C][/ROW]
[ROW][C]18[/C][C]121[/C][C]122.062866728287[/C][C]-1.06286672828728[/C][/ROW]
[ROW][C]19[/C][C]92.2[/C][C]96.1962000616206[/C][C]-3.99620006162062[/C][/ROW]
[ROW][C]20[/C][C]90.2[/C][C]94.729533394954[/C][C]-4.52953339495395[/C][/ROW]
[ROW][C]21[/C][C]101.5[/C][C]117.679533394954[/C][C]-16.1795333949539[/C][/ROW]
[ROW][C]22[/C][C]126.6[/C][C]99.829533394954[/C][C]26.7704666050460[/C][/ROW]
[ROW][C]23[/C][C]93.9[/C][C]92.7128667282873[/C][C]1.18713327171272[/C][/ROW]
[ROW][C]24[/C][C]89.8[/C][C]106.112866728287[/C][C]-16.3128667282873[/C][/ROW]
[ROW][C]25[/C][C]93.4[/C][C]104.823638355414[/C][C]-11.423638355414[/C][/ROW]
[ROW][C]26[/C][C]101.5[/C][C]108.366495498271[/C][C]-6.8664954982712[/C][/ROW]
[ROW][C]27[/C][C]110.4[/C][C]115.652209783985[/C][C]-5.25220978398549[/C][/ROW]
[ROW][C]28[/C][C]105.9[/C][C]101.514667419808[/C][C]4.3853325801924[/C][/ROW]
[ROW][C]29[/C][C]108.4[/C][C]106.973667454041[/C][C]1.42633254595871[/C][/ROW]
[ROW][C]30[/C][C]113.9[/C][C]121.207000787375[/C][C]-7.30700078737462[/C][/ROW]
[ROW][C]31[/C][C]86.1[/C][C]95.340334120708[/C][C]-9.24033412070796[/C][/ROW]
[ROW][C]32[/C][C]69.4[/C][C]93.8736674540413[/C][C]-24.4736674540413[/C][/ROW]
[ROW][C]33[/C][C]101.2[/C][C]116.823667454041[/C][C]-15.6236674540413[/C][/ROW]
[ROW][C]34[/C][C]100.5[/C][C]98.9736674540413[/C][C]1.52633254595872[/C][/ROW]
[ROW][C]35[/C][C]98[/C][C]91.8570007873746[/C][C]6.14299921262538[/C][/ROW]
[ROW][C]36[/C][C]106.6[/C][C]105.257000787375[/C][C]1.34299921262538[/C][/ROW]
[ROW][C]37[/C][C]90.1[/C][C]103.967772414501[/C][C]-13.8677724145014[/C][/ROW]
[ROW][C]38[/C][C]96.9[/C][C]107.510629557359[/C][C]-10.6106295573585[/C][/ROW]
[ROW][C]39[/C][C]109.9[/C][C]114.796343843073[/C][C]-4.89634384307282[/C][/ROW]
[ROW][C]40[/C][C]99[/C][C]100.658801478895[/C][C]-1.65880147889494[/C][/ROW]
[ROW][C]41[/C][C]106.3[/C][C]106.117801513129[/C][C]0.182198486871365[/C][/ROW]
[ROW][C]42[/C][C]128.9[/C][C]120.351134846462[/C][C]8.54886515353805[/C][/ROW]
[ROW][C]43[/C][C]111.1[/C][C]94.4844681797953[/C][C]16.6155318202047[/C][/ROW]
[ROW][C]44[/C][C]102.9[/C][C]93.0178015131286[/C][C]9.88219848687138[/C][/ROW]
[ROW][C]45[/C][C]130[/C][C]115.967801513129[/C][C]14.0321984868714[/C][/ROW]
[ROW][C]46[/C][C]87[/C][C]98.1178015131286[/C][C]-11.1178015131286[/C][/ROW]
[ROW][C]47[/C][C]87.5[/C][C]91.001134846462[/C][C]-3.50113484646196[/C][/ROW]
[ROW][C]48[/C][C]117.6[/C][C]104.401134846462[/C][C]13.1988651535380[/C][/ROW]
[ROW][C]49[/C][C]103.4[/C][C]103.111906473589[/C][C]0.288093526411324[/C][/ROW]
[ROW][C]50[/C][C]110.8[/C][C]106.654763616446[/C][C]4.14523638355412[/C][/ROW]
[ROW][C]51[/C][C]112.6[/C][C]113.940477902160[/C][C]-1.34047790216017[/C][/ROW]
[ROW][C]52[/C][C]102.5[/C][C]118.565732087227[/C][C]-16.0657320872274[/C][/ROW]
[ROW][C]53[/C][C]112.4[/C][C]124.024732121461[/C][C]-11.6247321214611[/C][/ROW]
[ROW][C]54[/C][C]135.6[/C][C]138.258065454794[/C][C]-2.65806545479442[/C][/ROW]
[ROW][C]55[/C][C]105.1[/C][C]112.391398788128[/C][C]-7.29139878812776[/C][/ROW]
[ROW][C]56[/C][C]127.7[/C][C]110.924732121461[/C][C]16.7752678785389[/C][/ROW]
[ROW][C]57[/C][C]137[/C][C]133.874732121461[/C][C]3.12526787853891[/C][/ROW]
[ROW][C]58[/C][C]91[/C][C]116.024732121461[/C][C]-25.0247321214611[/C][/ROW]
[ROW][C]59[/C][C]90.5[/C][C]108.908065454794[/C][C]-18.4080654547944[/C][/ROW]
[ROW][C]60[/C][C]122.4[/C][C]122.308065454794[/C][C]0.091934545205594[/C][/ROW]
[ROW][C]61[/C][C]123.3[/C][C]121.018837081921[/C][C]2.28116291807885[/C][/ROW]
[ROW][C]62[/C][C]124.3[/C][C]124.561694224778[/C][C]-0.261694224778342[/C][/ROW]
[ROW][C]63[/C][C]120[/C][C]131.847408510493[/C][C]-11.8474085104926[/C][/ROW]
[ROW][C]64[/C][C]118.1[/C][C]117.709866146315[/C][C]0.390133853685246[/C][/ROW]
[ROW][C]65[/C][C]119[/C][C]123.168866180548[/C][C]-4.16886618054843[/C][/ROW]
[ROW][C]66[/C][C]142.7[/C][C]137.402199513882[/C][C]5.29780048611823[/C][/ROW]
[ROW][C]67[/C][C]123.6[/C][C]111.535532847215[/C][C]12.0644671527849[/C][/ROW]
[ROW][C]68[/C][C]129.6[/C][C]110.068866180548[/C][C]19.5311338194516[/C][/ROW]
[ROW][C]69[/C][C]151.6[/C][C]133.018866180548[/C][C]18.5811338194516[/C][/ROW]
[ROW][C]70[/C][C]110.4[/C][C]115.168866180548[/C][C]-4.76886618054842[/C][/ROW]
[ROW][C]71[/C][C]99.2[/C][C]108.052199513882[/C][C]-8.85219951388176[/C][/ROW]
[ROW][C]72[/C][C]130.5[/C][C]121.452199513882[/C][C]9.04780048611825[/C][/ROW]
[ROW][C]73[/C][C]136.2[/C][C]120.162971141008[/C][C]16.0370288589915[/C][/ROW]
[ROW][C]74[/C][C]129.7[/C][C]123.705828283866[/C][C]5.99417171613431[/C][/ROW]
[ROW][C]75[/C][C]128[/C][C]130.99154256958[/C][C]-2.99154256957996[/C][/ROW]
[ROW][C]76[/C][C]121.6[/C][C]116.854000205402[/C][C]4.74599979459791[/C][/ROW]
[/TABLE]
Source: https://freestatistics.org/blog/index.php?pk=25891&T=4

Globally Unique Identifier (entire table): ba.freestatistics.org/blog/index.php?pk=25891&T=4

As an alternative you can also use a QR Code:  

The GUIDs for individual cells are displayed in the table below:

Multiple Linear Regression - Actuals, Interpolation, and Residuals
Time or IndexActualsInterpolationForecastResidualsPrediction Error
1119.5106.53537023724012.9646297627604
2125110.07822738009714.9217726199035
3145117.36394166581127.6360583341892
4105.3103.2263993016332.07360069836706
5116.9108.6853993358678.21460066413341
6120.1122.9187326692-2.81873266919994
788.997.0520660025333-8.1520660025333
878.495.5853993358666-17.1853993358666
9114.6118.535399335867-3.93539933586661
10113.3100.68539933586712.6146006641334
1111793.568732669223.4312673308000
1299.6106.9687326692-7.36873266919994
1399.4105.679504296327-6.27950429632668
14101.9109.222361439184-7.32236143918386
15115.2116.508075724898-1.30807572489815
16108.5102.3705333607206.12946663927973
17113.8107.8295333949545.97046660504604
18121122.062866728287-1.06286672828728
1992.296.1962000616206-3.99620006162062
2090.294.729533394954-4.52953339495395
21101.5117.679533394954-16.1795333949539
22126.699.82953339495426.7704666050460
2393.992.71286672828731.18713327171272
2489.8106.112866728287-16.3128667282873
2593.4104.823638355414-11.423638355414
26101.5108.366495498271-6.8664954982712
27110.4115.652209783985-5.25220978398549
28105.9101.5146674198084.3853325801924
29108.4106.9736674540411.42633254595871
30113.9121.207000787375-7.30700078737462
3186.195.340334120708-9.24033412070796
3269.493.8736674540413-24.4736674540413
33101.2116.823667454041-15.6236674540413
34100.598.97366745404131.52633254595872
359891.85700078737466.14299921262538
36106.6105.2570007873751.34299921262538
3790.1103.967772414501-13.8677724145014
3896.9107.510629557359-10.6106295573585
39109.9114.796343843073-4.89634384307282
4099100.658801478895-1.65880147889494
41106.3106.1178015131290.182198486871365
42128.9120.3511348464628.54886515353805
43111.194.484468179795316.6155318202047
44102.993.01780151312869.88219848687138
45130115.96780151312914.0321984868714
468798.1178015131286-11.1178015131286
4787.591.001134846462-3.50113484646196
48117.6104.40113484646213.1988651535380
49103.4103.1119064735890.288093526411324
50110.8106.6547636164464.14523638355412
51112.6113.940477902160-1.34047790216017
52102.5118.565732087227-16.0657320872274
53112.4124.024732121461-11.6247321214611
54135.6138.258065454794-2.65806545479442
55105.1112.391398788128-7.29139878812776
56127.7110.92473212146116.7752678785389
57137133.8747321214613.12526787853891
5891116.024732121461-25.0247321214611
5990.5108.908065454794-18.4080654547944
60122.4122.3080654547940.091934545205594
61123.3121.0188370819212.28116291807885
62124.3124.561694224778-0.261694224778342
63120131.847408510493-11.8474085104926
64118.1117.7098661463150.390133853685246
65119123.168866180548-4.16886618054843
66142.7137.4021995138825.29780048611823
67123.6111.53553284721512.0644671527849
68129.6110.06886618054819.5311338194516
69151.6133.01886618054818.5811338194516
70110.4115.168866180548-4.76886618054842
7199.2108.052199513882-8.85219951388176
72130.5121.4521995138829.04780048611825
73136.2120.16297114100816.0370288589915
74129.7123.7058282838665.99417171613431
75128130.99154256958-2.99154256957996
76121.6116.8540002054024.74599979459791


Goldfeld-Quandt test for Heteroskedasticity
p-valuesAlternative Hypothesis
breakpoint indexgreater2-sidedless
170.6197935412668660.7604129174662670.380206458733134
180.5673343944724750.865331211055050.432665605527525
190.5197923043733450.960415391253310.480207695626655
200.5635515751523350.8728968496953290.436448424847665
210.4664976820257210.9329953640514410.533502317974279
220.7596002014640180.4807995970719640.240399798535982
230.8077076066085290.3845847867829420.192292393391471
240.7454947291796870.5090105416406260.254505270820313
250.6678735136066210.6642529727867580.332126486393379
260.5835998375976380.8328003248047250.416400162402362
270.5564302393441380.8871395213117230.443569760655862
280.6073910703628240.7852178592743510.392608929637176
290.5850005461722140.8299989076555720.414999453827786
300.5063049659781470.9873900680437050.493695034021853
310.4499231329381320.8998462658762630.550076867061868
320.697582393054750.6048352138905010.302417606945251
330.8001040311872070.3997919376255860.199895968812793
340.9077483040798770.1845033918402470.0922516959201233
350.9876667148583770.02466657028324590.0123332851416230
360.9942860501514720.01142789969705530.00571394984852764
370.9964712900868950.007057419826210490.00352870991310524
380.9955191615272220.008961676945556590.00448083847277829
390.995092913596780.009814172806438340.00490708640321917
400.992227960762750.01554407847450030.00777203923725013
410.9886113498668150.02277730026636920.0113886501331846
420.9934516641230050.01309667175398950.00654833587699477
430.9994096852845750.001180629430849650.000590314715424824
440.99993126648610.0001374670277996466.8733513899823e-05
450.999942650502650.0001146989946986825.73494973493412e-05
460.9999072341522270.0001855316955453049.2765847772652e-05
470.9998895047197840.0002209905604328120.000110495280216406
480.9999270406002430.0001459187995140587.29593997570288e-05
490.9999667960509266.64078981476907e-053.32039490738453e-05
500.9999182312903670.0001635374192657828.17687096328908e-05
510.9997367609048450.0005264781903107940.000263239095155397
520.99928333209680.001433335806397770.000716667903198886
530.9981161453920650.003767709215870430.00188385460793521
540.9955146900661120.008970619867776260.00448530993388813
550.9947709534892740.01045809302145220.00522904651072609
560.9951050597151680.009789880569662970.00489494028483149
570.9886010195056210.02279796098875760.0113989804943788
580.9967723674887110.006455265022577320.00322763251128866
590.9841195115678510.0317609768642970.0158804884321485

\begin{tabular}{lllllllll}
\hline
Goldfeld-Quandt test for Heteroskedasticity \tabularnewline
p-values & Alternative Hypothesis \tabularnewline
breakpoint index & greater & 2-sided & less \tabularnewline
17 & 0.619793541266866 & 0.760412917466267 & 0.380206458733134 \tabularnewline
18 & 0.567334394472475 & 0.86533121105505 & 0.432665605527525 \tabularnewline
19 & 0.519792304373345 & 0.96041539125331 & 0.480207695626655 \tabularnewline
20 & 0.563551575152335 & 0.872896849695329 & 0.436448424847665 \tabularnewline
21 & 0.466497682025721 & 0.932995364051441 & 0.533502317974279 \tabularnewline
22 & 0.759600201464018 & 0.480799597071964 & 0.240399798535982 \tabularnewline
23 & 0.807707606608529 & 0.384584786782942 & 0.192292393391471 \tabularnewline
24 & 0.745494729179687 & 0.509010541640626 & 0.254505270820313 \tabularnewline
25 & 0.667873513606621 & 0.664252972786758 & 0.332126486393379 \tabularnewline
26 & 0.583599837597638 & 0.832800324804725 & 0.416400162402362 \tabularnewline
27 & 0.556430239344138 & 0.887139521311723 & 0.443569760655862 \tabularnewline
28 & 0.607391070362824 & 0.785217859274351 & 0.392608929637176 \tabularnewline
29 & 0.585000546172214 & 0.829998907655572 & 0.414999453827786 \tabularnewline
30 & 0.506304965978147 & 0.987390068043705 & 0.493695034021853 \tabularnewline
31 & 0.449923132938132 & 0.899846265876263 & 0.550076867061868 \tabularnewline
32 & 0.69758239305475 & 0.604835213890501 & 0.302417606945251 \tabularnewline
33 & 0.800104031187207 & 0.399791937625586 & 0.199895968812793 \tabularnewline
34 & 0.907748304079877 & 0.184503391840247 & 0.0922516959201233 \tabularnewline
35 & 0.987666714858377 & 0.0246665702832459 & 0.0123332851416230 \tabularnewline
36 & 0.994286050151472 & 0.0114278996970553 & 0.00571394984852764 \tabularnewline
37 & 0.996471290086895 & 0.00705741982621049 & 0.00352870991310524 \tabularnewline
38 & 0.995519161527222 & 0.00896167694555659 & 0.00448083847277829 \tabularnewline
39 & 0.99509291359678 & 0.00981417280643834 & 0.00490708640321917 \tabularnewline
40 & 0.99222796076275 & 0.0155440784745003 & 0.00777203923725013 \tabularnewline
41 & 0.988611349866815 & 0.0227773002663692 & 0.0113886501331846 \tabularnewline
42 & 0.993451664123005 & 0.0130966717539895 & 0.00654833587699477 \tabularnewline
43 & 0.999409685284575 & 0.00118062943084965 & 0.000590314715424824 \tabularnewline
44 & 0.9999312664861 & 0.000137467027799646 & 6.8733513899823e-05 \tabularnewline
45 & 0.99994265050265 & 0.000114698994698682 & 5.73494973493412e-05 \tabularnewline
46 & 0.999907234152227 & 0.000185531695545304 & 9.2765847772652e-05 \tabularnewline
47 & 0.999889504719784 & 0.000220990560432812 & 0.000110495280216406 \tabularnewline
48 & 0.999927040600243 & 0.000145918799514058 & 7.29593997570288e-05 \tabularnewline
49 & 0.999966796050926 & 6.64078981476907e-05 & 3.32039490738453e-05 \tabularnewline
50 & 0.999918231290367 & 0.000163537419265782 & 8.17687096328908e-05 \tabularnewline
51 & 0.999736760904845 & 0.000526478190310794 & 0.000263239095155397 \tabularnewline
52 & 0.9992833320968 & 0.00143333580639777 & 0.000716667903198886 \tabularnewline
53 & 0.998116145392065 & 0.00376770921587043 & 0.00188385460793521 \tabularnewline
54 & 0.995514690066112 & 0.00897061986777626 & 0.00448530993388813 \tabularnewline
55 & 0.994770953489274 & 0.0104580930214522 & 0.00522904651072609 \tabularnewline
56 & 0.995105059715168 & 0.00978988056966297 & 0.00489494028483149 \tabularnewline
57 & 0.988601019505621 & 0.0227979609887576 & 0.0113989804943788 \tabularnewline
58 & 0.996772367488711 & 0.00645526502257732 & 0.00322763251128866 \tabularnewline
59 & 0.984119511567851 & 0.031760976864297 & 0.0158804884321485 \tabularnewline
\hline
\end{tabular}
%Source: https://freestatistics.org/blog/index.php?pk=25891&T=5

[TABLE]
[ROW][C]Goldfeld-Quandt test for Heteroskedasticity[/C][/ROW]
[ROW][C]p-values[/C][C]Alternative Hypothesis[/C][/ROW]
[ROW][C]breakpoint index[/C][C]greater[/C][C]2-sided[/C][C]less[/C][/ROW]
[ROW][C]17[/C][C]0.619793541266866[/C][C]0.760412917466267[/C][C]0.380206458733134[/C][/ROW]
[ROW][C]18[/C][C]0.567334394472475[/C][C]0.86533121105505[/C][C]0.432665605527525[/C][/ROW]
[ROW][C]19[/C][C]0.519792304373345[/C][C]0.96041539125331[/C][C]0.480207695626655[/C][/ROW]
[ROW][C]20[/C][C]0.563551575152335[/C][C]0.872896849695329[/C][C]0.436448424847665[/C][/ROW]
[ROW][C]21[/C][C]0.466497682025721[/C][C]0.932995364051441[/C][C]0.533502317974279[/C][/ROW]
[ROW][C]22[/C][C]0.759600201464018[/C][C]0.480799597071964[/C][C]0.240399798535982[/C][/ROW]
[ROW][C]23[/C][C]0.807707606608529[/C][C]0.384584786782942[/C][C]0.192292393391471[/C][/ROW]
[ROW][C]24[/C][C]0.745494729179687[/C][C]0.509010541640626[/C][C]0.254505270820313[/C][/ROW]
[ROW][C]25[/C][C]0.667873513606621[/C][C]0.664252972786758[/C][C]0.332126486393379[/C][/ROW]
[ROW][C]26[/C][C]0.583599837597638[/C][C]0.832800324804725[/C][C]0.416400162402362[/C][/ROW]
[ROW][C]27[/C][C]0.556430239344138[/C][C]0.887139521311723[/C][C]0.443569760655862[/C][/ROW]
[ROW][C]28[/C][C]0.607391070362824[/C][C]0.785217859274351[/C][C]0.392608929637176[/C][/ROW]
[ROW][C]29[/C][C]0.585000546172214[/C][C]0.829998907655572[/C][C]0.414999453827786[/C][/ROW]
[ROW][C]30[/C][C]0.506304965978147[/C][C]0.987390068043705[/C][C]0.493695034021853[/C][/ROW]
[ROW][C]31[/C][C]0.449923132938132[/C][C]0.899846265876263[/C][C]0.550076867061868[/C][/ROW]
[ROW][C]32[/C][C]0.69758239305475[/C][C]0.604835213890501[/C][C]0.302417606945251[/C][/ROW]
[ROW][C]33[/C][C]0.800104031187207[/C][C]0.399791937625586[/C][C]0.199895968812793[/C][/ROW]
[ROW][C]34[/C][C]0.907748304079877[/C][C]0.184503391840247[/C][C]0.0922516959201233[/C][/ROW]
[ROW][C]35[/C][C]0.987666714858377[/C][C]0.0246665702832459[/C][C]0.0123332851416230[/C][/ROW]
[ROW][C]36[/C][C]0.994286050151472[/C][C]0.0114278996970553[/C][C]0.00571394984852764[/C][/ROW]
[ROW][C]37[/C][C]0.996471290086895[/C][C]0.00705741982621049[/C][C]0.00352870991310524[/C][/ROW]
[ROW][C]38[/C][C]0.995519161527222[/C][C]0.00896167694555659[/C][C]0.00448083847277829[/C][/ROW]
[ROW][C]39[/C][C]0.99509291359678[/C][C]0.00981417280643834[/C][C]0.00490708640321917[/C][/ROW]
[ROW][C]40[/C][C]0.99222796076275[/C][C]0.0155440784745003[/C][C]0.00777203923725013[/C][/ROW]
[ROW][C]41[/C][C]0.988611349866815[/C][C]0.0227773002663692[/C][C]0.0113886501331846[/C][/ROW]
[ROW][C]42[/C][C]0.993451664123005[/C][C]0.0130966717539895[/C][C]0.00654833587699477[/C][/ROW]
[ROW][C]43[/C][C]0.999409685284575[/C][C]0.00118062943084965[/C][C]0.000590314715424824[/C][/ROW]
[ROW][C]44[/C][C]0.9999312664861[/C][C]0.000137467027799646[/C][C]6.8733513899823e-05[/C][/ROW]
[ROW][C]45[/C][C]0.99994265050265[/C][C]0.000114698994698682[/C][C]5.73494973493412e-05[/C][/ROW]
[ROW][C]46[/C][C]0.999907234152227[/C][C]0.000185531695545304[/C][C]9.2765847772652e-05[/C][/ROW]
[ROW][C]47[/C][C]0.999889504719784[/C][C]0.000220990560432812[/C][C]0.000110495280216406[/C][/ROW]
[ROW][C]48[/C][C]0.999927040600243[/C][C]0.000145918799514058[/C][C]7.29593997570288e-05[/C][/ROW]
[ROW][C]49[/C][C]0.999966796050926[/C][C]6.64078981476907e-05[/C][C]3.32039490738453e-05[/C][/ROW]
[ROW][C]50[/C][C]0.999918231290367[/C][C]0.000163537419265782[/C][C]8.17687096328908e-05[/C][/ROW]
[ROW][C]51[/C][C]0.999736760904845[/C][C]0.000526478190310794[/C][C]0.000263239095155397[/C][/ROW]
[ROW][C]52[/C][C]0.9992833320968[/C][C]0.00143333580639777[/C][C]0.000716667903198886[/C][/ROW]
[ROW][C]53[/C][C]0.998116145392065[/C][C]0.00376770921587043[/C][C]0.00188385460793521[/C][/ROW]
[ROW][C]54[/C][C]0.995514690066112[/C][C]0.00897061986777626[/C][C]0.00448530993388813[/C][/ROW]
[ROW][C]55[/C][C]0.994770953489274[/C][C]0.0104580930214522[/C][C]0.00522904651072609[/C][/ROW]
[ROW][C]56[/C][C]0.995105059715168[/C][C]0.00978988056966297[/C][C]0.00489494028483149[/C][/ROW]
[ROW][C]57[/C][C]0.988601019505621[/C][C]0.0227979609887576[/C][C]0.0113989804943788[/C][/ROW]
[ROW][C]58[/C][C]0.996772367488711[/C][C]0.00645526502257732[/C][C]0.00322763251128866[/C][/ROW]
[ROW][C]59[/C][C]0.984119511567851[/C][C]0.031760976864297[/C][C]0.0158804884321485[/C][/ROW]
[/TABLE]
Source: https://freestatistics.org/blog/index.php?pk=25891&T=5

Globally Unique Identifier (entire table): ba.freestatistics.org/blog/index.php?pk=25891&T=5

As an alternative you can also use a QR Code:  

The GUIDs for individual cells are displayed in the table below:

Goldfeld-Quandt test for Heteroskedasticity
p-valuesAlternative Hypothesis
breakpoint indexgreater2-sidedless
170.6197935412668660.7604129174662670.380206458733134
180.5673343944724750.865331211055050.432665605527525
190.5197923043733450.960415391253310.480207695626655
200.5635515751523350.8728968496953290.436448424847665
210.4664976820257210.9329953640514410.533502317974279
220.7596002014640180.4807995970719640.240399798535982
230.8077076066085290.3845847867829420.192292393391471
240.7454947291796870.5090105416406260.254505270820313
250.6678735136066210.6642529727867580.332126486393379
260.5835998375976380.8328003248047250.416400162402362
270.5564302393441380.8871395213117230.443569760655862
280.6073910703628240.7852178592743510.392608929637176
290.5850005461722140.8299989076555720.414999453827786
300.5063049659781470.9873900680437050.493695034021853
310.4499231329381320.8998462658762630.550076867061868
320.697582393054750.6048352138905010.302417606945251
330.8001040311872070.3997919376255860.199895968812793
340.9077483040798770.1845033918402470.0922516959201233
350.9876667148583770.02466657028324590.0123332851416230
360.9942860501514720.01142789969705530.00571394984852764
370.9964712900868950.007057419826210490.00352870991310524
380.9955191615272220.008961676945556590.00448083847277829
390.995092913596780.009814172806438340.00490708640321917
400.992227960762750.01554407847450030.00777203923725013
410.9886113498668150.02277730026636920.0113886501331846
420.9934516641230050.01309667175398950.00654833587699477
430.9994096852845750.001180629430849650.000590314715424824
440.99993126648610.0001374670277996466.8733513899823e-05
450.999942650502650.0001146989946986825.73494973493412e-05
460.9999072341522270.0001855316955453049.2765847772652e-05
470.9998895047197840.0002209905604328120.000110495280216406
480.9999270406002430.0001459187995140587.29593997570288e-05
490.9999667960509266.64078981476907e-053.32039490738453e-05
500.9999182312903670.0001635374192657828.17687096328908e-05
510.9997367609048450.0005264781903107940.000263239095155397
520.99928333209680.001433335806397770.000716667903198886
530.9981161453920650.003767709215870430.00188385460793521
540.9955146900661120.008970619867776260.00448530993388813
550.9947709534892740.01045809302145220.00522904651072609
560.9951050597151680.009789880569662970.00489494028483149
570.9886010195056210.02279796098875760.0113989804943788
580.9967723674887110.006455265022577320.00322763251128866
590.9841195115678510.0317609768642970.0158804884321485


Meta Analysis of Goldfeld-Quandt test for Heteroskedasticity
Description# significant tests% significant testsOK/NOK
1% type I error level170.395348837209302NOK
5% type I error level250.581395348837209NOK
10% type I error level250.581395348837209NOK

\begin{tabular}{lllllllll}
\hline
Meta Analysis of Goldfeld-Quandt test for Heteroskedasticity \tabularnewline
Description & # significant tests & % significant tests & OK/NOK \tabularnewline
1% type I error level & 17 & 0.395348837209302 & NOK \tabularnewline
5% type I error level & 25 & 0.581395348837209 & NOK \tabularnewline
10% type I error level & 25 & 0.581395348837209 & NOK \tabularnewline
\hline
\end{tabular}
%Source: https://freestatistics.org/blog/index.php?pk=25891&T=6

[TABLE]
[ROW][C]Meta Analysis of Goldfeld-Quandt test for Heteroskedasticity[/C][/ROW]
[ROW][C]Description[/C][C]# significant tests[/C][C]% significant tests[/C][C]OK/NOK[/C][/ROW]
[ROW][C]1% type I error level[/C][C]17[/C][C]0.395348837209302[/C][C]NOK[/C][/ROW]
[ROW][C]5% type I error level[/C][C]25[/C][C]0.581395348837209[/C][C]NOK[/C][/ROW]
[ROW][C]10% type I error level[/C][C]25[/C][C]0.581395348837209[/C][C]NOK[/C][/ROW]
[/TABLE]
Source: https://freestatistics.org/blog/index.php?pk=25891&T=6

Globally Unique Identifier (entire table): ba.freestatistics.org/blog/index.php?pk=25891&T=6

As an alternative you can also use a QR Code:  

The GUIDs for individual cells are displayed in the table below:

Meta Analysis of Goldfeld-Quandt test for Heteroskedasticity
Description# significant tests% significant testsOK/NOK
1% type I error level170.395348837209302NOK
5% type I error level250.581395348837209NOK
10% type I error level250.581395348837209NOK


Parameters (Session):
par1 = 1 ; par2 = Include Monthly Dummies ; par3 = Linear Trend ;
Parameters (R input):
par1 = 1 ; par2 = Include Monthly Dummies ; par3 = Linear Trend ;
R code (references can be found in the software module):
library(lattice)
library(lmtest)
n25 <- 25 #minimum number of obs. for Goldfeld-Quandt test
par1 <- as.numeric(par1)
x <- t(y)
k <- length(x[1,])
n <- length(x[,1])
x1 <- cbind(x[,par1], x[,1:k!=par1])
mycolnames <- c(colnames(x)[par1], colnames(x)[1:k!=par1])
colnames(x1) <- mycolnames #colnames(x)[par1]
x <- x1
if (par3 == 'First Differences'){
x2 <- array(0, dim=c(n-1,k), dimnames=list(1:(n-1), paste('(1-B)',colnames(x),sep='')))
for (i in 1:n-1) {
for (j in 1:k) {
x2[i,j] <- x[i+1,j] - x[i,j]
}
}
x <- x2
}
if (par2 == 'Include Monthly Dummies'){
x2 <- array(0, dim=c(n,11), dimnames=list(1:n, paste('M', seq(1:11), sep ='')))
for (i in 1:11){
x2[seq(i,n,12),i] <- 1
}
x <- cbind(x, x2)
}
if (par2 == 'Include Quarterly Dummies'){
x2 <- array(0, dim=c(n,3), dimnames=list(1:n, paste('Q', seq(1:3), sep ='')))
for (i in 1:3){
x2[seq(i,n,4),i] <- 1
}
x <- cbind(x, x2)
}
k <- length(x[1,])
if (par3 == 'Linear Trend'){
x <- cbind(x, c(1:n))
colnames(x)[k+1] <- 't'
}
x
k <- length(x[1,])
df <- as.data.frame(x)
(mylm <- lm(df))
(mysum <- summary(mylm))
if (n > n25) {
kp3 <- k + 3
nmkm3 <- n - k - 3
gqarr <- array(NA, dim=c(nmkm3-kp3+1,3))
numgqtests <- 0
numsignificant1 <- 0
numsignificant5 <- 0
numsignificant10 <- 0
for (mypoint in kp3:nmkm3) {
j <- 0
numgqtests <- numgqtests + 1
for (myalt in c('greater', 'two.sided', 'less')) {
j <- j + 1
gqarr[mypoint-kp3+1,j] <- gqtest(mylm, point=mypoint, alternative=myalt)$p.value
}
if (gqarr[mypoint-kp3+1,2] < 0.01) numsignificant1 <- numsignificant1 + 1
if (gqarr[mypoint-kp3+1,2] < 0.05) numsignificant5 <- numsignificant5 + 1
if (gqarr[mypoint-kp3+1,2] < 0.10) numsignificant10 <- numsignificant10 + 1
}
gqarr
}
bitmap(file='test0.png')
plot(x[,1], type='l', main='Actuals and Interpolation', ylab='value of Actuals and Interpolation (dots)', xlab='time or index')
points(x[,1]-mysum$resid)
grid()
dev.off()
bitmap(file='test1.png')
plot(mysum$resid, type='b', pch=19, main='Residuals', ylab='value of Residuals', xlab='time or index')
grid()
dev.off()
bitmap(file='test2.png')
hist(mysum$resid, main='Residual Histogram', xlab='values of Residuals')
grid()
dev.off()
bitmap(file='test3.png')
densityplot(~mysum$resid,col='black',main='Residual Density Plot', xlab='values of Residuals')
dev.off()
bitmap(file='test4.png')
qqnorm(mysum$resid, main='Residual Normal Q-Q Plot')
qqline(mysum$resid)
grid()
dev.off()
(myerror <- as.ts(mysum$resid))
bitmap(file='test5.png')
dum <- cbind(lag(myerror,k=1),myerror)
dum
dum1 <- dum[2:length(myerror),]
dum1
z <- as.data.frame(dum1)
z
plot(z,main=paste('Residual Lag plot, lowess, and regression line'), ylab='values of Residuals', xlab='lagged values of Residuals')
lines(lowess(z))
abline(lm(z))
grid()
dev.off()
bitmap(file='test6.png')
acf(mysum$resid, lag.max=length(mysum$resid)/2, main='Residual Autocorrelation Function')
grid()
dev.off()
bitmap(file='test7.png')
pacf(mysum$resid, lag.max=length(mysum$resid)/2, main='Residual Partial Autocorrelation Function')
grid()
dev.off()
bitmap(file='test8.png')
opar <- par(mfrow = c(2,2), oma = c(0, 0, 1.1, 0))
plot(mylm, las = 1, sub='Residual Diagnostics')
par(opar)
dev.off()
if (n > n25) {
bitmap(file='test9.png')
plot(kp3:nmkm3,gqarr[,2], main='Goldfeld-Quandt test',ylab='2-sided p-value',xlab='breakpoint')
grid()
dev.off()
}
load(file='createtable')
a<-table.start()
a<-table.row.start(a)
a<-table.element(a, 'Multiple Linear Regression - Estimated Regression Equation', 1, TRUE)
a<-table.row.end(a)
myeq <- colnames(x)[1]
myeq <- paste(myeq, '[t] = ', sep='')
for (i in 1:k){
if (mysum$coefficients[i,1] > 0) myeq <- paste(myeq, '+', '')
myeq <- paste(myeq, mysum$coefficients[i,1], sep=' ')
if (rownames(mysum$coefficients)[i] != '(Intercept)') {
myeq <- paste(myeq, rownames(mysum$coefficients)[i], sep='')
if (rownames(mysum$coefficients)[i] != 't') myeq <- paste(myeq, '[t]', sep='')
}
}
myeq <- paste(myeq, ' + e[t]')
a<-table.row.start(a)
a<-table.element(a, myeq)
a<-table.row.end(a)
a<-table.end(a)
table.save(a,file='mytable1.tab')
a<-table.start()
a<-table.row.start(a)
a<-table.element(a,hyperlink('ols1.htm','Multiple Linear Regression - Ordinary Least Squares',''), 6, TRUE)
a<-table.row.end(a)
a<-table.row.start(a)
a<-table.element(a,'Variable',header=TRUE)
a<-table.element(a,'Parameter',header=TRUE)
a<-table.element(a,'S.D.',header=TRUE)
a<-table.element(a,'T-STAT
H0: parameter = 0',header=TRUE)
a<-table.element(a,'2-tail p-value',header=TRUE)
a<-table.element(a,'1-tail p-value',header=TRUE)
a<-table.row.end(a)
for (i in 1:k){
a<-table.row.start(a)
a<-table.element(a,rownames(mysum$coefficients)[i],header=TRUE)
a<-table.element(a,mysum$coefficients[i,1])
a<-table.element(a, round(mysum$coefficients[i,2],6))
a<-table.element(a, round(mysum$coefficients[i,3],4))
a<-table.element(a, round(mysum$coefficients[i,4],6))
a<-table.element(a, round(mysum$coefficients[i,4]/2,6))
a<-table.row.end(a)
}
a<-table.end(a)
table.save(a,file='mytable2.tab')
a<-table.start()
a<-table.row.start(a)
a<-table.element(a, 'Multiple Linear Regression - Regression Statistics', 2, TRUE)
a<-table.row.end(a)
a<-table.row.start(a)
a<-table.element(a, 'Multiple R',1,TRUE)
a<-table.element(a, sqrt(mysum$r.squared))
a<-table.row.end(a)
a<-table.row.start(a)
a<-table.element(a, 'R-squared',1,TRUE)
a<-table.element(a, mysum$r.squared)
a<-table.row.end(a)
a<-table.row.start(a)
a<-table.element(a, 'Adjusted R-squared',1,TRUE)
a<-table.element(a, mysum$adj.r.squared)
a<-table.row.end(a)
a<-table.row.start(a)
a<-table.element(a, 'F-TEST (value)',1,TRUE)
a<-table.element(a, mysum$fstatistic[1])
a<-table.row.end(a)
a<-table.row.start(a)
a<-table.element(a, 'F-TEST (DF numerator)',1,TRUE)
a<-table.element(a, mysum$fstatistic[2])
a<-table.row.end(a)
a<-table.row.start(a)
a<-table.element(a, 'F-TEST (DF denominator)',1,TRUE)
a<-table.element(a, mysum$fstatistic[3])
a<-table.row.end(a)
a<-table.row.start(a)
a<-table.element(a, 'p-value',1,TRUE)
a<-table.element(a, 1-pf(mysum$fstatistic[1],mysum$fstatistic[2],mysum$fstatistic[3]))
a<-table.row.end(a)
a<-table.row.start(a)
a<-table.element(a, 'Multiple Linear Regression - Residual Statistics', 2, TRUE)
a<-table.row.end(a)
a<-table.row.start(a)
a<-table.element(a, 'Residual Standard Deviation',1,TRUE)
a<-table.element(a, mysum$sigma)
a<-table.row.end(a)
a<-table.row.start(a)
a<-table.element(a, 'Sum Squared Residuals',1,TRUE)
a<-table.element(a, sum(myerror*myerror))
a<-table.row.end(a)
a<-table.end(a)
table.save(a,file='mytable3.tab')
a<-table.start()
a<-table.row.start(a)
a<-table.element(a, 'Multiple Linear Regression - Actuals, Interpolation, and Residuals', 4, TRUE)
a<-table.row.end(a)
a<-table.row.start(a)
a<-table.element(a, 'Time or Index', 1, TRUE)
a<-table.element(a, 'Actuals', 1, TRUE)
a<-table.element(a, 'Interpolation
Forecast', 1, TRUE)
a<-table.element(a, 'Residuals
Prediction Error', 1, TRUE)
a<-table.row.end(a)
for (i in 1:n) {
a<-table.row.start(a)
a<-table.element(a,i, 1, TRUE)
a<-table.element(a,x[i])
a<-table.element(a,x[i]-mysum$resid[i])
a<-table.element(a,mysum$resid[i])
a<-table.row.end(a)
}
a<-table.end(a)
table.save(a,file='mytable4.tab')
if (n > n25) {
a<-table.start()
a<-table.row.start(a)
a<-table.element(a,'Goldfeld-Quandt test for Heteroskedasticity',4,TRUE)
a<-table.row.end(a)
a<-table.row.start(a)
a<-table.element(a,'p-values',header=TRUE)
a<-table.element(a,'Alternative Hypothesis',3,header=TRUE)
a<-table.row.end(a)
a<-table.row.start(a)
a<-table.element(a,'breakpoint index',header=TRUE)
a<-table.element(a,'greater',header=TRUE)
a<-table.element(a,'2-sided',header=TRUE)
a<-table.element(a,'less',header=TRUE)
a<-table.row.end(a)
for (mypoint in kp3:nmkm3) {
a<-table.row.start(a)
a<-table.element(a,mypoint,header=TRUE)
a<-table.element(a,gqarr[mypoint-kp3+1,1])
a<-table.element(a,gqarr[mypoint-kp3+1,2])
a<-table.element(a,gqarr[mypoint-kp3+1,3])
a<-table.row.end(a)
}
a<-table.end(a)
table.save(a,file='mytable5.tab')
a<-table.start()
a<-table.row.start(a)
a<-table.element(a,'Meta Analysis of Goldfeld-Quandt test for Heteroskedasticity',4,TRUE)
a<-table.row.end(a)
a<-table.row.start(a)
a<-table.element(a,'Description',header=TRUE)
a<-table.element(a,'# significant tests',header=TRUE)
a<-table.element(a,'% significant tests',header=TRUE)
a<-table.element(a,'OK/NOK',header=TRUE)
a<-table.row.end(a)
a<-table.row.start(a)
a<-table.element(a,'1% type I error level',header=TRUE)
a<-table.element(a,numsignificant1)
a<-table.element(a,numsignificant1/numgqtests)
if (numsignificant1/numgqtests < 0.01) dum <- 'OK' else dum <- 'NOK'
a<-table.element(a,dum)
a<-table.row.end(a)
a<-table.row.start(a)
a<-table.element(a,'5% type I error level',header=TRUE)
a<-table.element(a,numsignificant5)
a<-table.element(a,numsignificant5/numgqtests)
if (numsignificant5/numgqtests < 0.05) dum <- 'OK' else dum <- 'NOK'
a<-table.element(a,dum)
a<-table.row.end(a)
a<-table.row.start(a)
a<-table.element(a,'10% type I error level',header=TRUE)
a<-table.element(a,numsignificant10)
a<-table.element(a,numsignificant10/numgqtests)
if (numsignificant10/numgqtests < 0.1) dum <- 'OK' else dum <- 'NOK'
a<-table.element(a,dum)
a<-table.row.end(a)
a<-table.end(a)
table.save(a,file='mytable6.tab')
}