Free Statistics

of Irreproducible Research!

Author's title

Author*Unverified author*
R Software Modulerwasp_multipleregression.wasp
Title produced by softwareMultiple Regression
Date of computationThu, 27 Nov 2008 08:17:50 -0700
Cite this page as followsStatistical Computations at FreeStatistics.org, Office for Research Development and Education, URL https://freestatistics.org/blog/index.php?v=date/2008/Nov/27/t1227799629f5vkssa0976kmq0.htm/, Retrieved Mon, 20 May 2024 12:28:30 +0000
Statistical Computations at FreeStatistics.org, Office for Research Development and Education, URL https://freestatistics.org/blog/index.php?pk=25836, Retrieved Mon, 20 May 2024 12:28:30 +0000
QR Codes:

Original text written by user:
IsPrivate?No (this computation is public)
User-defined keywords
Estimated Impact140
Family? (F = Feedback message, R = changed R code, M = changed R Module, P = changed Parameters, D = changed Data)
F       [Multiple Regression] [q3] [2008-11-27 15:17:50] [d41d8cd98f00b204e9800998ecf8427e] [Current]
Feedback Forum
2008-11-30 14:48:18 [6066575aa30c0611e452e930b1dff53d] [reply
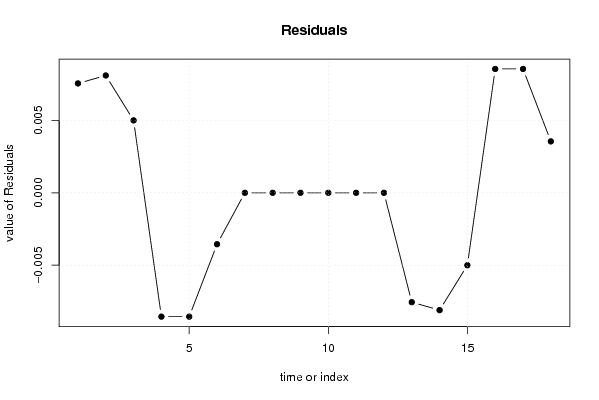
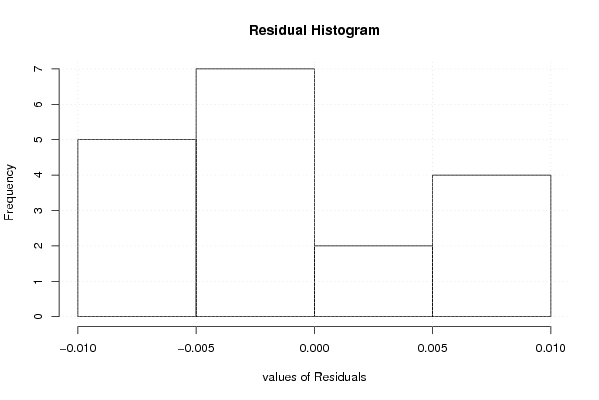
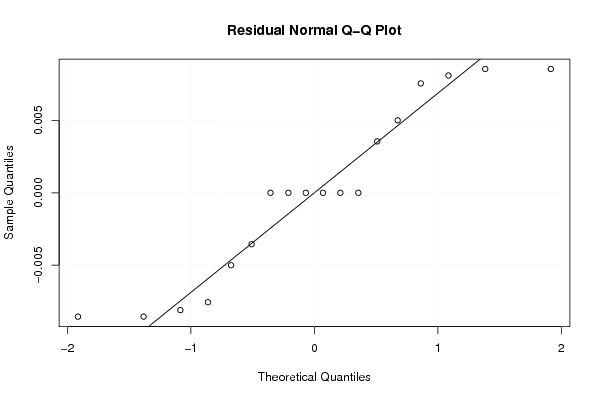
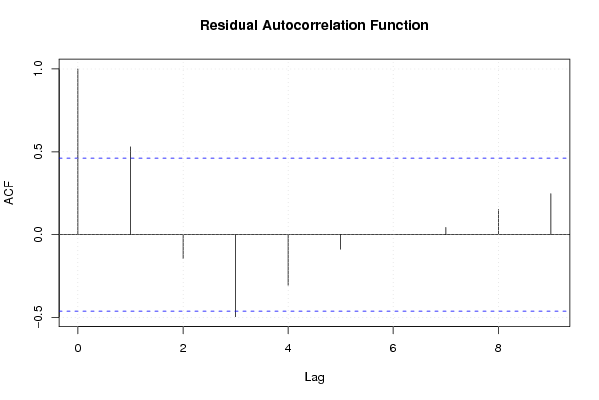
Deze vraag is zeer moeilijk om te verbeteren omdat er niet vermeld is wat de dummy variabele is en omdat er niet vermeld is welke cijfers men gebruikt heeft. Verder heeft men enkel de tabellen en grafieken gegeven zonder uitleg. Dit is dus zeer moeilijk om te verbeteren, het enige wat ik hier verder nog over kan zeggen is dat de p-waarden zowel éénzijdig als tweezijdig enorm groot zijn. Dit wijst erop dat er geen significant verschil is en dat we het effect van de gebeurtenis aan het toeval kunnen toeschrijven.Verder kan ik ook nog afleiden uit de tabel van multiple linear regression-regression statistics dat we slechts 3% van de schommelingen die ontstaan door de gebeurtenis kunnen verklaren.
2008-11-30 20:49:40 [Gilliam Schoorel] [reply
De bewerkingen zijn gebeurt, maar er is nergens uitleg gegeven bij de grafieken. Er is ook niets gezegd over welke tijdreeks je juist hebt gebruikt of een motivatie waarom je deze gebruikt zou hebben. Ik zie in de tabel wel dat het blijkbaar een tijdreeks is over de US dollar. Welke gebeurtenis heb je dan juist onderzocht? Je zou hier bijvoorbeeld onderzocht kunnen hebben welke invloed de invoering van de euro heeft gehad op de dollar koers...
Nochthans kan je toch makkelijk conclusies geven nadat je al wat ervaring hebt opgedaan bij de eerste 2 vragen.

Post a new message
Dataseries X:
1,2935	1
1,2811	0
1,2773	0
1,2602	0
1,2542	0
1,2634	1
1,2653	1
1,266	1
1,2675	1
1,2525	0
1,253	1
1,2747	1
1,2891	1
1,2756	0
1,277	1
1,287	1
1,282	0
1,2822	0


Summary of computational transaction
Raw Inputview raw input (R code)
Raw Outputview raw output of R engine
Computing time6 seconds
R Server'Herman Ole Andreas Wold' @ 193.190.124.10:1001

\begin{tabular}{lllllllll}
\hline
Summary of computational transaction \tabularnewline
Raw Input & view raw input (R code)  \tabularnewline
Raw Output & view raw output of R engine  \tabularnewline
Computing time & 6 seconds \tabularnewline
R Server & 'Herman Ole Andreas Wold' @ 193.190.124.10:1001 \tabularnewline
\hline
\end{tabular}
%Source: https://freestatistics.org/blog/index.php?pk=25836&T=0

[TABLE]
[ROW][C]Summary of computational transaction[/C][/ROW]
[ROW][C]Raw Input[/C][C]view raw input (R code) [/C][/ROW]
[ROW][C]Raw Output[/C][C]view raw output of R engine [/C][/ROW]
[ROW][C]Computing time[/C][C]6 seconds[/C][/ROW]
[ROW][C]R Server[/C][C]'Herman Ole Andreas Wold' @ 193.190.124.10:1001[/C][/ROW]
[/TABLE]
Source: https://freestatistics.org/blog/index.php?pk=25836&T=0

Globally Unique Identifier (entire table): ba.freestatistics.org/blog/index.php?pk=25836&T=0

As an alternative you can also use a QR Code:  

The GUIDs for individual cells are displayed in the table below:

Summary of computational transaction
Raw Inputview raw input (R code)
Raw Outputview raw output of R engine
Computing time6 seconds
R Server'Herman Ole Andreas Wold' @ 193.190.124.10:1001


Multiple Linear Regression - Estimated Regression Equation
dollar[t] = + 1.265 -0.00100000000000002`s/d`[t] + 0.0210583333333336M1[t] + 0.00621666666666666M2[t] + 0.00462500000000003M3[t] + 0.000183333333333318M4[t] -0.0067083333333333M5[t] -0.00239999999999991M6[t] -0.00494166666666656M7[t] -0.00513333333333329M8[t] -0.0045249999999999M9[t] -0.0214166666666667M10[t] -0.0208083333333334M11[t] + 0.000891666666666657t + e[t]

\begin{tabular}{lllllllll}
\hline
Multiple Linear Regression - Estimated Regression Equation \tabularnewline
dollar[t] =  +  1.265 -0.00100000000000002`s/d`[t] +  0.0210583333333336M1[t] +  0.00621666666666666M2[t] +  0.00462500000000003M3[t] +  0.000183333333333318M4[t] -0.0067083333333333M5[t] -0.00239999999999991M6[t] -0.00494166666666656M7[t] -0.00513333333333329M8[t] -0.0045249999999999M9[t] -0.0214166666666667M10[t] -0.0208083333333334M11[t] +  0.000891666666666657t  + e[t] \tabularnewline
\hline
\end{tabular}
%Source: https://freestatistics.org/blog/index.php?pk=25836&T=1

[TABLE]
[ROW][C]Multiple Linear Regression - Estimated Regression Equation[/C][/ROW]
[ROW][C]dollar[t] =  +  1.265 -0.00100000000000002`s/d`[t] +  0.0210583333333336M1[t] +  0.00621666666666666M2[t] +  0.00462500000000003M3[t] +  0.000183333333333318M4[t] -0.0067083333333333M5[t] -0.00239999999999991M6[t] -0.00494166666666656M7[t] -0.00513333333333329M8[t] -0.0045249999999999M9[t] -0.0214166666666667M10[t] -0.0208083333333334M11[t] +  0.000891666666666657t  + e[t][/C][/ROW]
[/TABLE]
Source: https://freestatistics.org/blog/index.php?pk=25836&T=1

Globally Unique Identifier (entire table): ba.freestatistics.org/blog/index.php?pk=25836&T=1

As an alternative you can also use a QR Code:  

The GUIDs for individual cells are displayed in the table below:

Multiple Linear Regression - Estimated Regression Equation
dollar[t] = + 1.265 -0.00100000000000002`s/d`[t] + 0.0210583333333336M1[t] + 0.00621666666666666M2[t] + 0.00462500000000003M3[t] + 0.000183333333333318M4[t] -0.0067083333333333M5[t] -0.00239999999999991M6[t] -0.00494166666666656M7[t] -0.00513333333333329M8[t] -0.0045249999999999M9[t] -0.0214166666666667M10[t] -0.0208083333333334M11[t] + 0.000891666666666657t + e[t]


Multiple Linear Regression - Ordinary Least Squares
VariableParameterS.D.T-STATH0: parameter = 02-tail p-value1-tail p-value
(Intercept)1.2650.01671575.681600
`s/d`-0.001000000000000020.010399-0.09620.9280190.46401
M10.02105833333333360.0154661.36160.2449780.122489
M20.006216666666666660.018220.34120.7501180.375059
M30.004625000000000030.0159910.28920.7867860.393393
M40.0001833333333333180.015980.01150.9913960.495698
M5-0.00670833333333330.018312-0.36630.7326710.366335
M6-0.002399999999999910.016027-0.14980.8882080.444104
M7-0.004941666666666560.017771-0.27810.7947370.397368
M8-0.005133333333333290.017676-0.29040.7859310.392965
M9-0.00452499999999990.017601-0.25710.8097950.404898
M10-0.02141666666666670.02025-1.05760.3498730.174936
M11-0.02080833333333340.017516-1.1880.3005550.150278
t0.0008916666666666570.0006131.45510.219340.10967

\begin{tabular}{lllllllll}
\hline
Multiple Linear Regression - Ordinary Least Squares \tabularnewline
Variable & Parameter & S.D. & T-STATH0: parameter = 0 & 2-tail p-value & 1-tail p-value \tabularnewline
(Intercept) & 1.265 & 0.016715 & 75.6816 & 0 & 0 \tabularnewline
`s/d` & -0.00100000000000002 & 0.010399 & -0.0962 & 0.928019 & 0.46401 \tabularnewline
M1 & 0.0210583333333336 & 0.015466 & 1.3616 & 0.244978 & 0.122489 \tabularnewline
M2 & 0.00621666666666666 & 0.01822 & 0.3412 & 0.750118 & 0.375059 \tabularnewline
M3 & 0.00462500000000003 & 0.015991 & 0.2892 & 0.786786 & 0.393393 \tabularnewline
M4 & 0.000183333333333318 & 0.01598 & 0.0115 & 0.991396 & 0.495698 \tabularnewline
M5 & -0.0067083333333333 & 0.018312 & -0.3663 & 0.732671 & 0.366335 \tabularnewline
M6 & -0.00239999999999991 & 0.016027 & -0.1498 & 0.888208 & 0.444104 \tabularnewline
M7 & -0.00494166666666656 & 0.017771 & -0.2781 & 0.794737 & 0.397368 \tabularnewline
M8 & -0.00513333333333329 & 0.017676 & -0.2904 & 0.785931 & 0.392965 \tabularnewline
M9 & -0.0045249999999999 & 0.017601 & -0.2571 & 0.809795 & 0.404898 \tabularnewline
M10 & -0.0214166666666667 & 0.02025 & -1.0576 & 0.349873 & 0.174936 \tabularnewline
M11 & -0.0208083333333334 & 0.017516 & -1.188 & 0.300555 & 0.150278 \tabularnewline
t & 0.000891666666666657 & 0.000613 & 1.4551 & 0.21934 & 0.10967 \tabularnewline
\hline
\end{tabular}
%Source: https://freestatistics.org/blog/index.php?pk=25836&T=2

[TABLE]
[ROW][C]Multiple Linear Regression - Ordinary Least Squares[/C][/ROW]
[ROW][C]Variable[/C][C]Parameter[/C][C]S.D.[/C][C]T-STATH0: parameter = 0[/C][C]2-tail p-value[/C][C]1-tail p-value[/C][/ROW]
[ROW][C](Intercept)[/C][C]1.265[/C][C]0.016715[/C][C]75.6816[/C][C]0[/C][C]0[/C][/ROW]
[ROW][C]`s/d`[/C][C]-0.00100000000000002[/C][C]0.010399[/C][C]-0.0962[/C][C]0.928019[/C][C]0.46401[/C][/ROW]
[ROW][C]M1[/C][C]0.0210583333333336[/C][C]0.015466[/C][C]1.3616[/C][C]0.244978[/C][C]0.122489[/C][/ROW]
[ROW][C]M2[/C][C]0.00621666666666666[/C][C]0.01822[/C][C]0.3412[/C][C]0.750118[/C][C]0.375059[/C][/ROW]
[ROW][C]M3[/C][C]0.00462500000000003[/C][C]0.015991[/C][C]0.2892[/C][C]0.786786[/C][C]0.393393[/C][/ROW]
[ROW][C]M4[/C][C]0.000183333333333318[/C][C]0.01598[/C][C]0.0115[/C][C]0.991396[/C][C]0.495698[/C][/ROW]
[ROW][C]M5[/C][C]-0.0067083333333333[/C][C]0.018312[/C][C]-0.3663[/C][C]0.732671[/C][C]0.366335[/C][/ROW]
[ROW][C]M6[/C][C]-0.00239999999999991[/C][C]0.016027[/C][C]-0.1498[/C][C]0.888208[/C][C]0.444104[/C][/ROW]
[ROW][C]M7[/C][C]-0.00494166666666656[/C][C]0.017771[/C][C]-0.2781[/C][C]0.794737[/C][C]0.397368[/C][/ROW]
[ROW][C]M8[/C][C]-0.00513333333333329[/C][C]0.017676[/C][C]-0.2904[/C][C]0.785931[/C][C]0.392965[/C][/ROW]
[ROW][C]M9[/C][C]-0.0045249999999999[/C][C]0.017601[/C][C]-0.2571[/C][C]0.809795[/C][C]0.404898[/C][/ROW]
[ROW][C]M10[/C][C]-0.0214166666666667[/C][C]0.02025[/C][C]-1.0576[/C][C]0.349873[/C][C]0.174936[/C][/ROW]
[ROW][C]M11[/C][C]-0.0208083333333334[/C][C]0.017516[/C][C]-1.188[/C][C]0.300555[/C][C]0.150278[/C][/ROW]
[ROW][C]t[/C][C]0.000891666666666657[/C][C]0.000613[/C][C]1.4551[/C][C]0.21934[/C][C]0.10967[/C][/ROW]
[/TABLE]
Source: https://freestatistics.org/blog/index.php?pk=25836&T=2

Globally Unique Identifier (entire table): ba.freestatistics.org/blog/index.php?pk=25836&T=2

As an alternative you can also use a QR Code:  

The GUIDs for individual cells are displayed in the table below:

Multiple Linear Regression - Ordinary Least Squares
VariableParameterS.D.T-STATH0: parameter = 02-tail p-value1-tail p-value
(Intercept)1.2650.01671575.681600
`s/d`-0.001000000000000020.010399-0.09620.9280190.46401
M10.02105833333333360.0154661.36160.2449780.122489
M20.006216666666666660.018220.34120.7501180.375059
M30.004625000000000030.0159910.28920.7867860.393393
M40.0001833333333333180.015980.01150.9913960.495698
M5-0.00670833333333330.018312-0.36630.7326710.366335
M6-0.002399999999999910.016027-0.14980.8882080.444104
M7-0.004941666666666560.017771-0.27810.7947370.397368
M8-0.005133333333333290.017676-0.29040.7859310.392965
M9-0.00452499999999990.017601-0.25710.8097950.404898
M10-0.02141666666666670.02025-1.05760.3498730.174936
M11-0.02080833333333340.017516-1.1880.3005550.150278
t0.0008916666666666570.0006131.45510.219340.10967


Multiple Linear Regression - Regression Statistics
Multiple R0.879718503504739
R-squared0.773904645408617
Adjusted R-squared0.0390947429866229
F-TEST (value)1.05320388696146
F-TEST (DF numerator)13
F-TEST (DF denominator)4
p-value0.533234716322439
Multiple Linear Regression - Residual Statistics
Residual Standard Deviation0.0123778027129213
Sum Squared Residuals0.000612840000000008

\begin{tabular}{lllllllll}
\hline
Multiple Linear Regression - Regression Statistics \tabularnewline
Multiple R & 0.879718503504739 \tabularnewline
R-squared & 0.773904645408617 \tabularnewline
Adjusted R-squared & 0.0390947429866229 \tabularnewline
F-TEST (value) & 1.05320388696146 \tabularnewline
F-TEST (DF numerator) & 13 \tabularnewline
F-TEST (DF denominator) & 4 \tabularnewline
p-value & 0.533234716322439 \tabularnewline
Multiple Linear Regression - Residual Statistics \tabularnewline
Residual Standard Deviation & 0.0123778027129213 \tabularnewline
Sum Squared Residuals & 0.000612840000000008 \tabularnewline
\hline
\end{tabular}
%Source: https://freestatistics.org/blog/index.php?pk=25836&T=3

[TABLE]
[ROW][C]Multiple Linear Regression - Regression Statistics[/C][/ROW]
[ROW][C]Multiple R[/C][C]0.879718503504739[/C][/ROW]
[ROW][C]R-squared[/C][C]0.773904645408617[/C][/ROW]
[ROW][C]Adjusted R-squared[/C][C]0.0390947429866229[/C][/ROW]
[ROW][C]F-TEST (value)[/C][C]1.05320388696146[/C][/ROW]
[ROW][C]F-TEST (DF numerator)[/C][C]13[/C][/ROW]
[ROW][C]F-TEST (DF denominator)[/C][C]4[/C][/ROW]
[ROW][C]p-value[/C][C]0.533234716322439[/C][/ROW]
[ROW][C]Multiple Linear Regression - Residual Statistics[/C][/ROW]
[ROW][C]Residual Standard Deviation[/C][C]0.0123778027129213[/C][/ROW]
[ROW][C]Sum Squared Residuals[/C][C]0.000612840000000008[/C][/ROW]
[/TABLE]
Source: https://freestatistics.org/blog/index.php?pk=25836&T=3

Globally Unique Identifier (entire table): ba.freestatistics.org/blog/index.php?pk=25836&T=3

As an alternative you can also use a QR Code:  

The GUIDs for individual cells are displayed in the table below:

Multiple Linear Regression - Regression Statistics
Multiple R0.879718503504739
R-squared0.773904645408617
Adjusted R-squared0.0390947429866229
F-TEST (value)1.05320388696146
F-TEST (DF numerator)13
F-TEST (DF denominator)4
p-value0.533234716322439
Multiple Linear Regression - Residual Statistics
Residual Standard Deviation0.0123778027129213
Sum Squared Residuals0.000612840000000008


Multiple Linear Regression - Actuals, Interpolation, and Residuals
Time or IndexActualsInterpolationForecastResidualsPrediction Error
11.29351.285950.00755000000000024
21.28111.2730.00809999999999986
31.27731.27230.00500000000000002
41.26021.26875-0.00855000000000003
51.25421.26275-0.00855000000000009
61.26341.26695-0.00355000000000001
71.26531.2653-8.51903386701013e-19
81.2661.2664.49139220281593e-19
91.26751.2675-4.18222517706811e-19
101.25251.25252.32298785784492e-19
111.2531.2531.75018182726420e-18
121.27471.27473.91858617223521e-18
131.28911.29665-0.00755000000000024
141.27561.2837-0.00809999999999986
151.2771.282-0.00500000000000002
161.2871.278450.00855000000000003
171.2821.273450.00855000000000008
181.28221.278650.00355000000000001

\begin{tabular}{lllllllll}
\hline
Multiple Linear Regression - Actuals, Interpolation, and Residuals \tabularnewline
Time or Index & Actuals & InterpolationForecast & ResidualsPrediction Error \tabularnewline
1 & 1.2935 & 1.28595 & 0.00755000000000024 \tabularnewline
2 & 1.2811 & 1.273 & 0.00809999999999986 \tabularnewline
3 & 1.2773 & 1.2723 & 0.00500000000000002 \tabularnewline
4 & 1.2602 & 1.26875 & -0.00855000000000003 \tabularnewline
5 & 1.2542 & 1.26275 & -0.00855000000000009 \tabularnewline
6 & 1.2634 & 1.26695 & -0.00355000000000001 \tabularnewline
7 & 1.2653 & 1.2653 & -8.51903386701013e-19 \tabularnewline
8 & 1.266 & 1.266 & 4.49139220281593e-19 \tabularnewline
9 & 1.2675 & 1.2675 & -4.18222517706811e-19 \tabularnewline
10 & 1.2525 & 1.2525 & 2.32298785784492e-19 \tabularnewline
11 & 1.253 & 1.253 & 1.75018182726420e-18 \tabularnewline
12 & 1.2747 & 1.2747 & 3.91858617223521e-18 \tabularnewline
13 & 1.2891 & 1.29665 & -0.00755000000000024 \tabularnewline
14 & 1.2756 & 1.2837 & -0.00809999999999986 \tabularnewline
15 & 1.277 & 1.282 & -0.00500000000000002 \tabularnewline
16 & 1.287 & 1.27845 & 0.00855000000000003 \tabularnewline
17 & 1.282 & 1.27345 & 0.00855000000000008 \tabularnewline
18 & 1.2822 & 1.27865 & 0.00355000000000001 \tabularnewline
\hline
\end{tabular}
%Source: https://freestatistics.org/blog/index.php?pk=25836&T=4

[TABLE]
[ROW][C]Multiple Linear Regression - Actuals, Interpolation, and Residuals[/C][/ROW]
[ROW][C]Time or Index[/C][C]Actuals[/C][C]InterpolationForecast[/C][C]ResidualsPrediction Error[/C][/ROW]
[ROW][C]1[/C][C]1.2935[/C][C]1.28595[/C][C]0.00755000000000024[/C][/ROW]
[ROW][C]2[/C][C]1.2811[/C][C]1.273[/C][C]0.00809999999999986[/C][/ROW]
[ROW][C]3[/C][C]1.2773[/C][C]1.2723[/C][C]0.00500000000000002[/C][/ROW]
[ROW][C]4[/C][C]1.2602[/C][C]1.26875[/C][C]-0.00855000000000003[/C][/ROW]
[ROW][C]5[/C][C]1.2542[/C][C]1.26275[/C][C]-0.00855000000000009[/C][/ROW]
[ROW][C]6[/C][C]1.2634[/C][C]1.26695[/C][C]-0.00355000000000001[/C][/ROW]
[ROW][C]7[/C][C]1.2653[/C][C]1.2653[/C][C]-8.51903386701013e-19[/C][/ROW]
[ROW][C]8[/C][C]1.266[/C][C]1.266[/C][C]4.49139220281593e-19[/C][/ROW]
[ROW][C]9[/C][C]1.2675[/C][C]1.2675[/C][C]-4.18222517706811e-19[/C][/ROW]
[ROW][C]10[/C][C]1.2525[/C][C]1.2525[/C][C]2.32298785784492e-19[/C][/ROW]
[ROW][C]11[/C][C]1.253[/C][C]1.253[/C][C]1.75018182726420e-18[/C][/ROW]
[ROW][C]12[/C][C]1.2747[/C][C]1.2747[/C][C]3.91858617223521e-18[/C][/ROW]
[ROW][C]13[/C][C]1.2891[/C][C]1.29665[/C][C]-0.00755000000000024[/C][/ROW]
[ROW][C]14[/C][C]1.2756[/C][C]1.2837[/C][C]-0.00809999999999986[/C][/ROW]
[ROW][C]15[/C][C]1.277[/C][C]1.282[/C][C]-0.00500000000000002[/C][/ROW]
[ROW][C]16[/C][C]1.287[/C][C]1.27845[/C][C]0.00855000000000003[/C][/ROW]
[ROW][C]17[/C][C]1.282[/C][C]1.27345[/C][C]0.00855000000000008[/C][/ROW]
[ROW][C]18[/C][C]1.2822[/C][C]1.27865[/C][C]0.00355000000000001[/C][/ROW]
[/TABLE]
Source: https://freestatistics.org/blog/index.php?pk=25836&T=4

Globally Unique Identifier (entire table): ba.freestatistics.org/blog/index.php?pk=25836&T=4

As an alternative you can also use a QR Code:  

The GUIDs for individual cells are displayed in the table below:

Multiple Linear Regression - Actuals, Interpolation, and Residuals
Time or IndexActualsInterpolationForecastResidualsPrediction Error
11.29351.285950.00755000000000024
21.28111.2730.00809999999999986
31.27731.27230.00500000000000002
41.26021.26875-0.00855000000000003
51.25421.26275-0.00855000000000009
61.26341.26695-0.00355000000000001
71.26531.2653-8.51903386701013e-19
81.2661.2664.49139220281593e-19
91.26751.2675-4.18222517706811e-19
101.25251.25252.32298785784492e-19
111.2531.2531.75018182726420e-18
121.27471.27473.91858617223521e-18
131.28911.29665-0.00755000000000024
141.27561.2837-0.00809999999999986
151.2771.282-0.00500000000000002
161.2871.278450.00855000000000003
171.2821.273450.00855000000000008
181.28221.278650.00355000000000001


Parameters (Session):
par1 = 1 ; par2 = Include Monthly Dummies ; par3 = Linear Trend ;
Parameters (R input):
par1 = 1 ; par2 = Include Monthly Dummies ; par3 = Linear Trend ;
R code (references can be found in the software module):
library(lattice)
library(lmtest)
n25 <- 25 #minimum number of obs. for Goldfeld-Quandt test
par1 <- as.numeric(par1)
x <- t(y)
k <- length(x[1,])
n <- length(x[,1])
x1 <- cbind(x[,par1], x[,1:k!=par1])
mycolnames <- c(colnames(x)[par1], colnames(x)[1:k!=par1])
colnames(x1) <- mycolnames #colnames(x)[par1]
x <- x1
if (par3 == 'First Differences'){
x2 <- array(0, dim=c(n-1,k), dimnames=list(1:(n-1), paste('(1-B)',colnames(x),sep='')))
for (i in 1:n-1) {
for (j in 1:k) {
x2[i,j] <- x[i+1,j] - x[i,j]
}
}
x <- x2
}
if (par2 == 'Include Monthly Dummies'){
x2 <- array(0, dim=c(n,11), dimnames=list(1:n, paste('M', seq(1:11), sep ='')))
for (i in 1:11){
x2[seq(i,n,12),i] <- 1
}
x <- cbind(x, x2)
}
if (par2 == 'Include Quarterly Dummies'){
x2 <- array(0, dim=c(n,3), dimnames=list(1:n, paste('Q', seq(1:3), sep ='')))
for (i in 1:3){
x2[seq(i,n,4),i] <- 1
}
x <- cbind(x, x2)
}
k <- length(x[1,])
if (par3 == 'Linear Trend'){
x <- cbind(x, c(1:n))
colnames(x)[k+1] <- 't'
}
x
k <- length(x[1,])
df <- as.data.frame(x)
(mylm <- lm(df))
(mysum <- summary(mylm))
if (n > n25) {
kp3 <- k + 3
nmkm3 <- n - k - 3
gqarr <- array(NA, dim=c(nmkm3-kp3+1,3))
numgqtests <- 0
numsignificant1 <- 0
numsignificant5 <- 0
numsignificant10 <- 0
for (mypoint in kp3:nmkm3) {
j <- 0
numgqtests <- numgqtests + 1
for (myalt in c('greater', 'two.sided', 'less')) {
j <- j + 1
gqarr[mypoint-kp3+1,j] <- gqtest(mylm, point=mypoint, alternative=myalt)$p.value
}
if (gqarr[mypoint-kp3+1,2] < 0.01) numsignificant1 <- numsignificant1 + 1
if (gqarr[mypoint-kp3+1,2] < 0.05) numsignificant5 <- numsignificant5 + 1
if (gqarr[mypoint-kp3+1,2] < 0.10) numsignificant10 <- numsignificant10 + 1
}
gqarr
}
bitmap(file='test0.png')
plot(x[,1], type='l', main='Actuals and Interpolation', ylab='value of Actuals and Interpolation (dots)', xlab='time or index')
points(x[,1]-mysum$resid)
grid()
dev.off()
bitmap(file='test1.png')
plot(mysum$resid, type='b', pch=19, main='Residuals', ylab='value of Residuals', xlab='time or index')
grid()
dev.off()
bitmap(file='test2.png')
hist(mysum$resid, main='Residual Histogram', xlab='values of Residuals')
grid()
dev.off()
bitmap(file='test3.png')
densityplot(~mysum$resid,col='black',main='Residual Density Plot', xlab='values of Residuals')
dev.off()
bitmap(file='test4.png')
qqnorm(mysum$resid, main='Residual Normal Q-Q Plot')
qqline(mysum$resid)
grid()
dev.off()
(myerror <- as.ts(mysum$resid))
bitmap(file='test5.png')
dum <- cbind(lag(myerror,k=1),myerror)
dum
dum1 <- dum[2:length(myerror),]
dum1
z <- as.data.frame(dum1)
z
plot(z,main=paste('Residual Lag plot, lowess, and regression line'), ylab='values of Residuals', xlab='lagged values of Residuals')
lines(lowess(z))
abline(lm(z))
grid()
dev.off()
bitmap(file='test6.png')
acf(mysum$resid, lag.max=length(mysum$resid)/2, main='Residual Autocorrelation Function')
grid()
dev.off()
bitmap(file='test7.png')
pacf(mysum$resid, lag.max=length(mysum$resid)/2, main='Residual Partial Autocorrelation Function')
grid()
dev.off()
bitmap(file='test8.png')
opar <- par(mfrow = c(2,2), oma = c(0, 0, 1.1, 0))
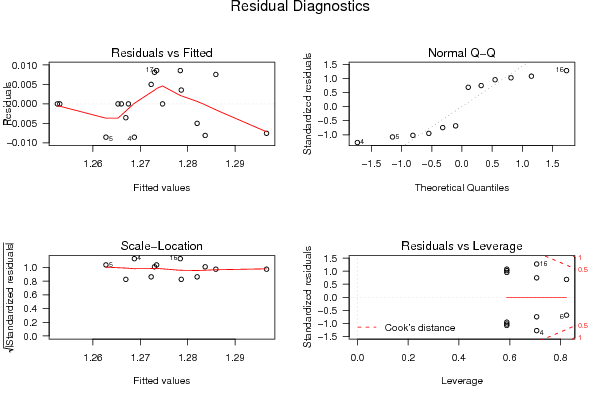
plot(mylm, las = 1, sub='Residual Diagnostics')
par(opar)
dev.off()
if (n > n25) {
bitmap(file='test9.png')
plot(kp3:nmkm3,gqarr[,2], main='Goldfeld-Quandt test',ylab='2-sided p-value',xlab='breakpoint')
grid()
dev.off()
}
load(file='createtable')
a<-table.start()
a<-table.row.start(a)
a<-table.element(a, 'Multiple Linear Regression - Estimated Regression Equation', 1, TRUE)
a<-table.row.end(a)
myeq <- colnames(x)[1]
myeq <- paste(myeq, '[t] = ', sep='')
for (i in 1:k){
if (mysum$coefficients[i,1] > 0) myeq <- paste(myeq, '+', '')
myeq <- paste(myeq, mysum$coefficients[i,1], sep=' ')
if (rownames(mysum$coefficients)[i] != '(Intercept)') {
myeq <- paste(myeq, rownames(mysum$coefficients)[i], sep='')
if (rownames(mysum$coefficients)[i] != 't') myeq <- paste(myeq, '[t]', sep='')
}
}
myeq <- paste(myeq, ' + e[t]')
a<-table.row.start(a)
a<-table.element(a, myeq)
a<-table.row.end(a)
a<-table.end(a)
table.save(a,file='mytable1.tab')
a<-table.start()
a<-table.row.start(a)
a<-table.element(a,hyperlink('ols1.htm','Multiple Linear Regression - Ordinary Least Squares',''), 6, TRUE)
a<-table.row.end(a)
a<-table.row.start(a)
a<-table.element(a,'Variable',header=TRUE)
a<-table.element(a,'Parameter',header=TRUE)
a<-table.element(a,'S.D.',header=TRUE)
a<-table.element(a,'T-STAT
H0: parameter = 0',header=TRUE)
a<-table.element(a,'2-tail p-value',header=TRUE)
a<-table.element(a,'1-tail p-value',header=TRUE)
a<-table.row.end(a)
for (i in 1:k){
a<-table.row.start(a)
a<-table.element(a,rownames(mysum$coefficients)[i],header=TRUE)
a<-table.element(a,mysum$coefficients[i,1])
a<-table.element(a, round(mysum$coefficients[i,2],6))
a<-table.element(a, round(mysum$coefficients[i,3],4))
a<-table.element(a, round(mysum$coefficients[i,4],6))
a<-table.element(a, round(mysum$coefficients[i,4]/2,6))
a<-table.row.end(a)
}
a<-table.end(a)
table.save(a,file='mytable2.tab')
a<-table.start()
a<-table.row.start(a)
a<-table.element(a, 'Multiple Linear Regression - Regression Statistics', 2, TRUE)
a<-table.row.end(a)
a<-table.row.start(a)
a<-table.element(a, 'Multiple R',1,TRUE)
a<-table.element(a, sqrt(mysum$r.squared))
a<-table.row.end(a)
a<-table.row.start(a)
a<-table.element(a, 'R-squared',1,TRUE)
a<-table.element(a, mysum$r.squared)
a<-table.row.end(a)
a<-table.row.start(a)
a<-table.element(a, 'Adjusted R-squared',1,TRUE)
a<-table.element(a, mysum$adj.r.squared)
a<-table.row.end(a)
a<-table.row.start(a)
a<-table.element(a, 'F-TEST (value)',1,TRUE)
a<-table.element(a, mysum$fstatistic[1])
a<-table.row.end(a)
a<-table.row.start(a)
a<-table.element(a, 'F-TEST (DF numerator)',1,TRUE)
a<-table.element(a, mysum$fstatistic[2])
a<-table.row.end(a)
a<-table.row.start(a)
a<-table.element(a, 'F-TEST (DF denominator)',1,TRUE)
a<-table.element(a, mysum$fstatistic[3])
a<-table.row.end(a)
a<-table.row.start(a)
a<-table.element(a, 'p-value',1,TRUE)
a<-table.element(a, 1-pf(mysum$fstatistic[1],mysum$fstatistic[2],mysum$fstatistic[3]))
a<-table.row.end(a)
a<-table.row.start(a)
a<-table.element(a, 'Multiple Linear Regression - Residual Statistics', 2, TRUE)
a<-table.row.end(a)
a<-table.row.start(a)
a<-table.element(a, 'Residual Standard Deviation',1,TRUE)
a<-table.element(a, mysum$sigma)
a<-table.row.end(a)
a<-table.row.start(a)
a<-table.element(a, 'Sum Squared Residuals',1,TRUE)
a<-table.element(a, sum(myerror*myerror))
a<-table.row.end(a)
a<-table.end(a)
table.save(a,file='mytable3.tab')
a<-table.start()
a<-table.row.start(a)
a<-table.element(a, 'Multiple Linear Regression - Actuals, Interpolation, and Residuals', 4, TRUE)
a<-table.row.end(a)
a<-table.row.start(a)
a<-table.element(a, 'Time or Index', 1, TRUE)
a<-table.element(a, 'Actuals', 1, TRUE)
a<-table.element(a, 'Interpolation
Forecast', 1, TRUE)
a<-table.element(a, 'Residuals
Prediction Error', 1, TRUE)
a<-table.row.end(a)
for (i in 1:n) {
a<-table.row.start(a)
a<-table.element(a,i, 1, TRUE)
a<-table.element(a,x[i])
a<-table.element(a,x[i]-mysum$resid[i])
a<-table.element(a,mysum$resid[i])
a<-table.row.end(a)
}
a<-table.end(a)
table.save(a,file='mytable4.tab')
if (n > n25) {
a<-table.start()
a<-table.row.start(a)
a<-table.element(a,'Goldfeld-Quandt test for Heteroskedasticity',4,TRUE)
a<-table.row.end(a)
a<-table.row.start(a)
a<-table.element(a,'p-values',header=TRUE)
a<-table.element(a,'Alternative Hypothesis',3,header=TRUE)
a<-table.row.end(a)
a<-table.row.start(a)
a<-table.element(a,'breakpoint index',header=TRUE)
a<-table.element(a,'greater',header=TRUE)
a<-table.element(a,'2-sided',header=TRUE)
a<-table.element(a,'less',header=TRUE)
a<-table.row.end(a)
for (mypoint in kp3:nmkm3) {
a<-table.row.start(a)
a<-table.element(a,mypoint,header=TRUE)
a<-table.element(a,gqarr[mypoint-kp3+1,1])
a<-table.element(a,gqarr[mypoint-kp3+1,2])
a<-table.element(a,gqarr[mypoint-kp3+1,3])
a<-table.row.end(a)
}
a<-table.end(a)
table.save(a,file='mytable5.tab')
a<-table.start()
a<-table.row.start(a)
a<-table.element(a,'Meta Analysis of Goldfeld-Quandt test for Heteroskedasticity',4,TRUE)
a<-table.row.end(a)
a<-table.row.start(a)
a<-table.element(a,'Description',header=TRUE)
a<-table.element(a,'# significant tests',header=TRUE)
a<-table.element(a,'% significant tests',header=TRUE)
a<-table.element(a,'OK/NOK',header=TRUE)
a<-table.row.end(a)
a<-table.row.start(a)
a<-table.element(a,'1% type I error level',header=TRUE)
a<-table.element(a,numsignificant1)
a<-table.element(a,numsignificant1/numgqtests)
if (numsignificant1/numgqtests < 0.01) dum <- 'OK' else dum <- 'NOK'
a<-table.element(a,dum)
a<-table.row.end(a)
a<-table.row.start(a)
a<-table.element(a,'5% type I error level',header=TRUE)
a<-table.element(a,numsignificant5)
a<-table.element(a,numsignificant5/numgqtests)
if (numsignificant5/numgqtests < 0.05) dum <- 'OK' else dum <- 'NOK'
a<-table.element(a,dum)
a<-table.row.end(a)
a<-table.row.start(a)
a<-table.element(a,'10% type I error level',header=TRUE)
a<-table.element(a,numsignificant10)
a<-table.element(a,numsignificant10/numgqtests)
if (numsignificant10/numgqtests < 0.1) dum <- 'OK' else dum <- 'NOK'
a<-table.element(a,dum)
a<-table.row.end(a)
a<-table.end(a)
table.save(a,file='mytable6.tab')
}