Free Statistics

of Irreproducible Research!

Author's title

Author*Unverified author*
R Software Modulerwasp_multipleregression.wasp
Title produced by softwareMultiple Regression
Date of computationThu, 27 Nov 2008 04:52:04 -0700
Cite this page as followsStatistical Computations at FreeStatistics.org, Office for Research Development and Education, URL https://freestatistics.org/blog/index.php?v=date/2008/Nov/27/t1227787980ttg5wik9ao79jlk.htm/, Retrieved Mon, 20 May 2024 10:10:55 +0000
Statistical Computations at FreeStatistics.org, Office for Research Development and Education, URL https://freestatistics.org/blog/index.php?pk=25768, Retrieved Mon, 20 May 2024 10:10:55 +0000
QR Codes:

Original text written by user:
IsPrivate?No (this computation is public)
User-defined keywords
Estimated Impact165
Family? (F = Feedback message, R = changed R code, M = changed R Module, P = changed Parameters, D = changed Data)
-       [Multiple Regression] [q3] [2008-11-27 11:52:04] [d41d8cd98f00b204e9800998ecf8427e] [Current]
Feedback Forum

Post a new message
Dataseries X:
1,2935	123,1
1,2811	123,08
1,2773	122,52
1,2602	119,3
1,2542	119,87
1,2634	122,07
1,2653	121,92
1,266	121,93
1,2675	122,17
1,2525	120,34
1,253	121,81
1,2747	124,77
1,2891	127,89
1,2756	124,29
1,277	124,86
1,287	127,4
1,282	127,35
1,2822	126,38


Summary of computational transaction
Raw Inputview raw input (R code)
Raw Outputview raw output of R engine
Computing time3 seconds
R Server'Gwilym Jenkins' @ 72.249.127.135

\begin{tabular}{lllllllll}
\hline
Summary of computational transaction \tabularnewline
Raw Input & view raw input (R code)  \tabularnewline
Raw Output & view raw output of R engine  \tabularnewline
Computing time & 3 seconds \tabularnewline
R Server & 'Gwilym Jenkins' @ 72.249.127.135 \tabularnewline
\hline
\end{tabular}
%Source: https://freestatistics.org/blog/index.php?pk=25768&T=0

[TABLE]
[ROW][C]Summary of computational transaction[/C][/ROW]
[ROW][C]Raw Input[/C][C]view raw input (R code) [/C][/ROW]
[ROW][C]Raw Output[/C][C]view raw output of R engine [/C][/ROW]
[ROW][C]Computing time[/C][C]3 seconds[/C][/ROW]
[ROW][C]R Server[/C][C]'Gwilym Jenkins' @ 72.249.127.135[/C][/ROW]
[/TABLE]
Source: https://freestatistics.org/blog/index.php?pk=25768&T=0

Globally Unique Identifier (entire table): ba.freestatistics.org/blog/index.php?pk=25768&T=0

As an alternative you can also use a QR Code:  

The GUIDs for individual cells are displayed in the table below:

Summary of computational transaction
Raw Inputview raw input (R code)
Raw Outputview raw output of R engine
Computing time3 seconds
R Server'Gwilym Jenkins' @ 72.249.127.135


Multiple Linear Regression - Estimated Regression Equation
dollar[t] = + 0.682329207142466 + 0.00484602056822722yen[t] + 0.00797530448796259M1[t] + 0.00481886783646787M2[t] + 0.00461690385364145M3[t] + 0.0037368169668533M4[t] -0.00200088226087104M5[t] + 0.000741081209683945M6[t] -0.000700171980625635M7[t] + 0.000973633933706657M8[t] + 0.00233285511734688M9[t] -0.00277666112278277M10[t] -0.00837804523806218M11[t] -0.00102226612001467t + e[t]

\begin{tabular}{lllllllll}
\hline
Multiple Linear Regression - Estimated Regression Equation \tabularnewline
dollar[t] =  +  0.682329207142466 +  0.00484602056822722yen[t] +  0.00797530448796259M1[t] +  0.00481886783646787M2[t] +  0.00461690385364145M3[t] +  0.0037368169668533M4[t] -0.00200088226087104M5[t] +  0.000741081209683945M6[t] -0.000700171980625635M7[t] +  0.000973633933706657M8[t] +  0.00233285511734688M9[t] -0.00277666112278277M10[t] -0.00837804523806218M11[t] -0.00102226612001467t  + e[t] \tabularnewline
\hline
\end{tabular}
%Source: https://freestatistics.org/blog/index.php?pk=25768&T=1

[TABLE]
[ROW][C]Multiple Linear Regression - Estimated Regression Equation[/C][/ROW]
[ROW][C]dollar[t] =  +  0.682329207142466 +  0.00484602056822722yen[t] +  0.00797530448796259M1[t] +  0.00481886783646787M2[t] +  0.00461690385364145M3[t] +  0.0037368169668533M4[t] -0.00200088226087104M5[t] +  0.000741081209683945M6[t] -0.000700171980625635M7[t] +  0.000973633933706657M8[t] +  0.00233285511734688M9[t] -0.00277666112278277M10[t] -0.00837804523806218M11[t] -0.00102226612001467t  + e[t][/C][/ROW]
[/TABLE]
Source: https://freestatistics.org/blog/index.php?pk=25768&T=1

Globally Unique Identifier (entire table): ba.freestatistics.org/blog/index.php?pk=25768&T=1

As an alternative you can also use a QR Code:  

The GUIDs for individual cells are displayed in the table below:

Multiple Linear Regression - Estimated Regression Equation
dollar[t] = + 0.682329207142466 + 0.00484602056822722yen[t] + 0.00797530448796259M1[t] + 0.00481886783646787M2[t] + 0.00461690385364145M3[t] + 0.0037368169668533M4[t] -0.00200088226087104M5[t] + 0.000741081209683945M6[t] -0.000700171980625635M7[t] + 0.000973633933706657M8[t] + 0.00233285511734688M9[t] -0.00277666112278277M10[t] -0.00837804523806218M11[t] -0.00102226612001467t + e[t]


Multiple Linear Regression - Ordinary Least Squares
VariableParameterS.D.T-STATH0: parameter = 02-tail p-value1-tail p-value
(Intercept)0.6823292071424660.1856033.67630.0212730.010637
yen0.004846020568227220.0015453.13750.034930.017465
M10.007975304487962590.0092910.85840.4390760.219538
M20.004818867836467870.0082920.58120.5923080.296154
M30.004616903853641450.0082160.56190.6041460.302073
M40.00373681696685330.0082420.45340.6737740.336887
M5-0.002000882260871040.00825-0.24250.8202980.410149
M60.0007410812096839450.0082010.09040.9323450.466172
M7-0.0007001719806256350.009654-0.07250.9456630.472831
M80.0009736339337066570.0097080.10030.9249360.462468
M90.002332855117346880.0097210.240.8221430.411071
M10-0.002776661122782770.010994-0.25260.8130480.406524
M11-0.008378045238062180.010226-0.81930.4586310.229315
t-0.001022266120014670.000685-1.4920.2099710.104985

\begin{tabular}{lllllllll}
\hline
Multiple Linear Regression - Ordinary Least Squares \tabularnewline
Variable & Parameter & S.D. & T-STATH0: parameter = 0 & 2-tail p-value & 1-tail p-value \tabularnewline
(Intercept) & 0.682329207142466 & 0.185603 & 3.6763 & 0.021273 & 0.010637 \tabularnewline
yen & 0.00484602056822722 & 0.001545 & 3.1375 & 0.03493 & 0.017465 \tabularnewline
M1 & 0.00797530448796259 & 0.009291 & 0.8584 & 0.439076 & 0.219538 \tabularnewline
M2 & 0.00481886783646787 & 0.008292 & 0.5812 & 0.592308 & 0.296154 \tabularnewline
M3 & 0.00461690385364145 & 0.008216 & 0.5619 & 0.604146 & 0.302073 \tabularnewline
M4 & 0.0037368169668533 & 0.008242 & 0.4534 & 0.673774 & 0.336887 \tabularnewline
M5 & -0.00200088226087104 & 0.00825 & -0.2425 & 0.820298 & 0.410149 \tabularnewline
M6 & 0.000741081209683945 & 0.008201 & 0.0904 & 0.932345 & 0.466172 \tabularnewline
M7 & -0.000700171980625635 & 0.009654 & -0.0725 & 0.945663 & 0.472831 \tabularnewline
M8 & 0.000973633933706657 & 0.009708 & 0.1003 & 0.924936 & 0.462468 \tabularnewline
M9 & 0.00233285511734688 & 0.009721 & 0.24 & 0.822143 & 0.411071 \tabularnewline
M10 & -0.00277666112278277 & 0.010994 & -0.2526 & 0.813048 & 0.406524 \tabularnewline
M11 & -0.00837804523806218 & 0.010226 & -0.8193 & 0.458631 & 0.229315 \tabularnewline
t & -0.00102226612001467 & 0.000685 & -1.492 & 0.209971 & 0.104985 \tabularnewline
\hline
\end{tabular}
%Source: https://freestatistics.org/blog/index.php?pk=25768&T=2

[TABLE]
[ROW][C]Multiple Linear Regression - Ordinary Least Squares[/C][/ROW]
[ROW][C]Variable[/C][C]Parameter[/C][C]S.D.[/C][C]T-STATH0: parameter = 0[/C][C]2-tail p-value[/C][C]1-tail p-value[/C][/ROW]
[ROW][C](Intercept)[/C][C]0.682329207142466[/C][C]0.185603[/C][C]3.6763[/C][C]0.021273[/C][C]0.010637[/C][/ROW]
[ROW][C]yen[/C][C]0.00484602056822722[/C][C]0.001545[/C][C]3.1375[/C][C]0.03493[/C][C]0.017465[/C][/ROW]
[ROW][C]M1[/C][C]0.00797530448796259[/C][C]0.009291[/C][C]0.8584[/C][C]0.439076[/C][C]0.219538[/C][/ROW]
[ROW][C]M2[/C][C]0.00481886783646787[/C][C]0.008292[/C][C]0.5812[/C][C]0.592308[/C][C]0.296154[/C][/ROW]
[ROW][C]M3[/C][C]0.00461690385364145[/C][C]0.008216[/C][C]0.5619[/C][C]0.604146[/C][C]0.302073[/C][/ROW]
[ROW][C]M4[/C][C]0.0037368169668533[/C][C]0.008242[/C][C]0.4534[/C][C]0.673774[/C][C]0.336887[/C][/ROW]
[ROW][C]M5[/C][C]-0.00200088226087104[/C][C]0.00825[/C][C]-0.2425[/C][C]0.820298[/C][C]0.410149[/C][/ROW]
[ROW][C]M6[/C][C]0.000741081209683945[/C][C]0.008201[/C][C]0.0904[/C][C]0.932345[/C][C]0.466172[/C][/ROW]
[ROW][C]M7[/C][C]-0.000700171980625635[/C][C]0.009654[/C][C]-0.0725[/C][C]0.945663[/C][C]0.472831[/C][/ROW]
[ROW][C]M8[/C][C]0.000973633933706657[/C][C]0.009708[/C][C]0.1003[/C][C]0.924936[/C][C]0.462468[/C][/ROW]
[ROW][C]M9[/C][C]0.00233285511734688[/C][C]0.009721[/C][C]0.24[/C][C]0.822143[/C][C]0.411071[/C][/ROW]
[ROW][C]M10[/C][C]-0.00277666112278277[/C][C]0.010994[/C][C]-0.2526[/C][C]0.813048[/C][C]0.406524[/C][/ROW]
[ROW][C]M11[/C][C]-0.00837804523806218[/C][C]0.010226[/C][C]-0.8193[/C][C]0.458631[/C][C]0.229315[/C][/ROW]
[ROW][C]t[/C][C]-0.00102226612001467[/C][C]0.000685[/C][C]-1.492[/C][C]0.209971[/C][C]0.104985[/C][/ROW]
[/TABLE]
Source: https://freestatistics.org/blog/index.php?pk=25768&T=2

Globally Unique Identifier (entire table): ba.freestatistics.org/blog/index.php?pk=25768&T=2

As an alternative you can also use a QR Code:  

The GUIDs for individual cells are displayed in the table below:

Multiple Linear Regression - Ordinary Least Squares
VariableParameterS.D.T-STATH0: parameter = 02-tail p-value1-tail p-value
(Intercept)0.6823292071424660.1856033.67630.0212730.010637
yen0.004846020568227220.0015453.13750.034930.017465
M10.007975304487962590.0092910.85840.4390760.219538
M20.004818867836467870.0082920.58120.5923080.296154
M30.004616903853641450.0082160.56190.6041460.302073
M40.00373681696685330.0082420.45340.6737740.336887
M5-0.002000882260871040.00825-0.24250.8202980.410149
M60.0007410812096839450.0082010.09040.9323450.466172
M7-0.0007001719806256350.009654-0.07250.9456630.472831
M80.0009736339337066570.0097080.10030.9249360.462468
M90.002332855117346880.0097210.240.8221430.411071
M10-0.002776661122782770.010994-0.25260.8130480.406524
M11-0.008378045238062180.010226-0.81930.4586310.229315
t-0.001022266120014670.000685-1.4920.2099710.104985


Multiple Linear Regression - Regression Statistics
Multiple R0.966707358725284
R-squared0.934523117413615
Adjusted R-squared0.721723249007862
F-TEST (value)4.39155871859717
F-TEST (DF numerator)13
F-TEST (DF denominator)4
p-value0.0820206215292726
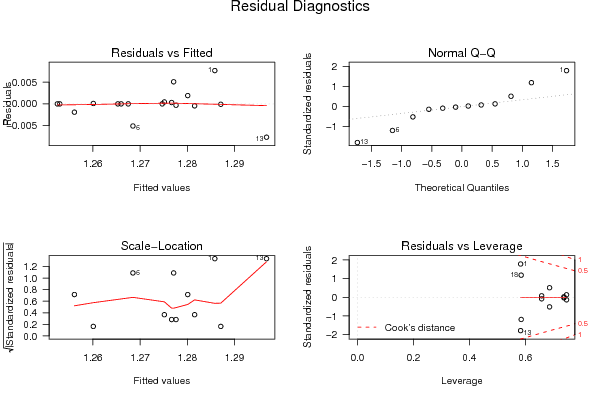
Multiple Linear Regression - Residual Statistics
Residual Standard Deviation0.00666103527654522
Sum Squared Residuals0.000177477563821520

\begin{tabular}{lllllllll}
\hline
Multiple Linear Regression - Regression Statistics \tabularnewline
Multiple R & 0.966707358725284 \tabularnewline
R-squared & 0.934523117413615 \tabularnewline
Adjusted R-squared & 0.721723249007862 \tabularnewline
F-TEST (value) & 4.39155871859717 \tabularnewline
F-TEST (DF numerator) & 13 \tabularnewline
F-TEST (DF denominator) & 4 \tabularnewline
p-value & 0.0820206215292726 \tabularnewline
Multiple Linear Regression - Residual Statistics \tabularnewline
Residual Standard Deviation & 0.00666103527654522 \tabularnewline
Sum Squared Residuals & 0.000177477563821520 \tabularnewline
\hline
\end{tabular}
%Source: https://freestatistics.org/blog/index.php?pk=25768&T=3

[TABLE]
[ROW][C]Multiple Linear Regression - Regression Statistics[/C][/ROW]
[ROW][C]Multiple R[/C][C]0.966707358725284[/C][/ROW]
[ROW][C]R-squared[/C][C]0.934523117413615[/C][/ROW]
[ROW][C]Adjusted R-squared[/C][C]0.721723249007862[/C][/ROW]
[ROW][C]F-TEST (value)[/C][C]4.39155871859717[/C][/ROW]
[ROW][C]F-TEST (DF numerator)[/C][C]13[/C][/ROW]
[ROW][C]F-TEST (DF denominator)[/C][C]4[/C][/ROW]
[ROW][C]p-value[/C][C]0.0820206215292726[/C][/ROW]
[ROW][C]Multiple Linear Regression - Residual Statistics[/C][/ROW]
[ROW][C]Residual Standard Deviation[/C][C]0.00666103527654522[/C][/ROW]
[ROW][C]Sum Squared Residuals[/C][C]0.000177477563821520[/C][/ROW]
[/TABLE]
Source: https://freestatistics.org/blog/index.php?pk=25768&T=3

Globally Unique Identifier (entire table): ba.freestatistics.org/blog/index.php?pk=25768&T=3

As an alternative you can also use a QR Code:  

The GUIDs for individual cells are displayed in the table below:

Multiple Linear Regression - Regression Statistics
Multiple R0.966707358725284
R-squared0.934523117413615
Adjusted R-squared0.721723249007862
F-TEST (value)4.39155871859717
F-TEST (DF numerator)13
F-TEST (DF denominator)4
p-value0.0820206215292726
Multiple Linear Regression - Residual Statistics
Residual Standard Deviation0.00666103527654522
Sum Squared Residuals0.000177477563821520


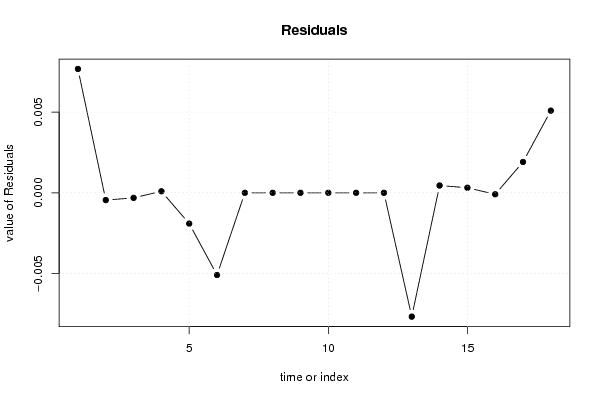
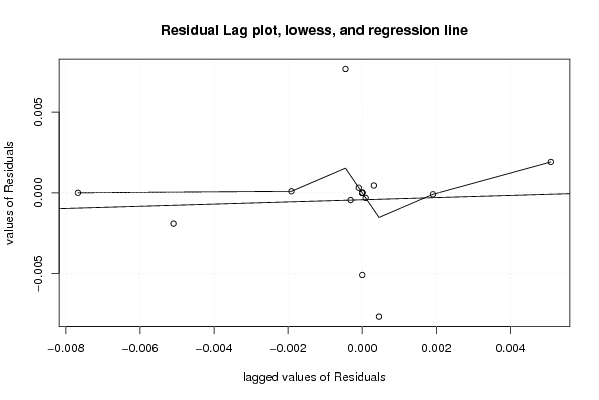
Multiple Linear Regression - Actuals, Interpolation, and Residuals
Time or IndexActualsInterpolationForecastResidualsPrediction Error
11.29351.285827377459180.0076726225408169
21.28111.28155175427631-0.000451754276310604
31.27731.27761375265526-0.000313752655262051
41.26021.260107213418779.27865812322944e-05
51.25421.25610947979492-0.00190947979491824
61.26341.26849042239556-0.0050904223955583
71.26531.2653-6.50521303491303e-19
81.2661.2662.16840434497101e-19
91.26751.2675-4.33680868994202e-19
101.25251.25252.16840434497101e-19
111.2531.253-1.51788304147971e-18
121.27471.27474.33680868994202e-18
131.28911.29677262254082-0.0076726225408169
141.27561.275148245723690.000451754276310605
151.2771.276686247344740.00031375265526205
161.2871.28709278658123-9.27865812322952e-05
171.2821.280090520205080.00190947979491824
181.28221.277109577604440.0050904223955583

\begin{tabular}{lllllllll}
\hline
Multiple Linear Regression - Actuals, Interpolation, and Residuals \tabularnewline
Time or Index & Actuals & InterpolationForecast & ResidualsPrediction Error \tabularnewline
1 & 1.2935 & 1.28582737745918 & 0.0076726225408169 \tabularnewline
2 & 1.2811 & 1.28155175427631 & -0.000451754276310604 \tabularnewline
3 & 1.2773 & 1.27761375265526 & -0.000313752655262051 \tabularnewline
4 & 1.2602 & 1.26010721341877 & 9.27865812322944e-05 \tabularnewline
5 & 1.2542 & 1.25610947979492 & -0.00190947979491824 \tabularnewline
6 & 1.2634 & 1.26849042239556 & -0.0050904223955583 \tabularnewline
7 & 1.2653 & 1.2653 & -6.50521303491303e-19 \tabularnewline
8 & 1.266 & 1.266 & 2.16840434497101e-19 \tabularnewline
9 & 1.2675 & 1.2675 & -4.33680868994202e-19 \tabularnewline
10 & 1.2525 & 1.2525 & 2.16840434497101e-19 \tabularnewline
11 & 1.253 & 1.253 & -1.51788304147971e-18 \tabularnewline
12 & 1.2747 & 1.2747 & 4.33680868994202e-18 \tabularnewline
13 & 1.2891 & 1.29677262254082 & -0.0076726225408169 \tabularnewline
14 & 1.2756 & 1.27514824572369 & 0.000451754276310605 \tabularnewline
15 & 1.277 & 1.27668624734474 & 0.00031375265526205 \tabularnewline
16 & 1.287 & 1.28709278658123 & -9.27865812322952e-05 \tabularnewline
17 & 1.282 & 1.28009052020508 & 0.00190947979491824 \tabularnewline
18 & 1.2822 & 1.27710957760444 & 0.0050904223955583 \tabularnewline
\hline
\end{tabular}
%Source: https://freestatistics.org/blog/index.php?pk=25768&T=4

[TABLE]
[ROW][C]Multiple Linear Regression - Actuals, Interpolation, and Residuals[/C][/ROW]
[ROW][C]Time or Index[/C][C]Actuals[/C][C]InterpolationForecast[/C][C]ResidualsPrediction Error[/C][/ROW]
[ROW][C]1[/C][C]1.2935[/C][C]1.28582737745918[/C][C]0.0076726225408169[/C][/ROW]
[ROW][C]2[/C][C]1.2811[/C][C]1.28155175427631[/C][C]-0.000451754276310604[/C][/ROW]
[ROW][C]3[/C][C]1.2773[/C][C]1.27761375265526[/C][C]-0.000313752655262051[/C][/ROW]
[ROW][C]4[/C][C]1.2602[/C][C]1.26010721341877[/C][C]9.27865812322944e-05[/C][/ROW]
[ROW][C]5[/C][C]1.2542[/C][C]1.25610947979492[/C][C]-0.00190947979491824[/C][/ROW]
[ROW][C]6[/C][C]1.2634[/C][C]1.26849042239556[/C][C]-0.0050904223955583[/C][/ROW]
[ROW][C]7[/C][C]1.2653[/C][C]1.2653[/C][C]-6.50521303491303e-19[/C][/ROW]
[ROW][C]8[/C][C]1.266[/C][C]1.266[/C][C]2.16840434497101e-19[/C][/ROW]
[ROW][C]9[/C][C]1.2675[/C][C]1.2675[/C][C]-4.33680868994202e-19[/C][/ROW]
[ROW][C]10[/C][C]1.2525[/C][C]1.2525[/C][C]2.16840434497101e-19[/C][/ROW]
[ROW][C]11[/C][C]1.253[/C][C]1.253[/C][C]-1.51788304147971e-18[/C][/ROW]
[ROW][C]12[/C][C]1.2747[/C][C]1.2747[/C][C]4.33680868994202e-18[/C][/ROW]
[ROW][C]13[/C][C]1.2891[/C][C]1.29677262254082[/C][C]-0.0076726225408169[/C][/ROW]
[ROW][C]14[/C][C]1.2756[/C][C]1.27514824572369[/C][C]0.000451754276310605[/C][/ROW]
[ROW][C]15[/C][C]1.277[/C][C]1.27668624734474[/C][C]0.00031375265526205[/C][/ROW]
[ROW][C]16[/C][C]1.287[/C][C]1.28709278658123[/C][C]-9.27865812322952e-05[/C][/ROW]
[ROW][C]17[/C][C]1.282[/C][C]1.28009052020508[/C][C]0.00190947979491824[/C][/ROW]
[ROW][C]18[/C][C]1.2822[/C][C]1.27710957760444[/C][C]0.0050904223955583[/C][/ROW]
[/TABLE]
Source: https://freestatistics.org/blog/index.php?pk=25768&T=4

Globally Unique Identifier (entire table): ba.freestatistics.org/blog/index.php?pk=25768&T=4

As an alternative you can also use a QR Code:  

The GUIDs for individual cells are displayed in the table below:

Multiple Linear Regression - Actuals, Interpolation, and Residuals
Time or IndexActualsInterpolationForecastResidualsPrediction Error
11.29351.285827377459180.0076726225408169
21.28111.28155175427631-0.000451754276310604
31.27731.27761375265526-0.000313752655262051
41.26021.260107213418779.27865812322944e-05
51.25421.25610947979492-0.00190947979491824
61.26341.26849042239556-0.0050904223955583
71.26531.2653-6.50521303491303e-19
81.2661.2662.16840434497101e-19
91.26751.2675-4.33680868994202e-19
101.25251.25252.16840434497101e-19
111.2531.253-1.51788304147971e-18
121.27471.27474.33680868994202e-18
131.28911.29677262254082-0.0076726225408169
141.27561.275148245723690.000451754276310605
151.2771.276686247344740.00031375265526205
161.2871.28709278658123-9.27865812322952e-05
171.2821.280090520205080.00190947979491824
181.28221.277109577604440.0050904223955583


Parameters (Session):
par1 = 1 ; par2 = Include Monthly Dummies ; par3 = Linear Trend ;
Parameters (R input):
par1 = 1 ; par2 = Include Monthly Dummies ; par3 = Linear Trend ;
R code (references can be found in the software module):
library(lattice)
library(lmtest)
n25 <- 25 #minimum number of obs. for Goldfeld-Quandt test
par1 <- as.numeric(par1)
x <- t(y)
k <- length(x[1,])
n <- length(x[,1])
x1 <- cbind(x[,par1], x[,1:k!=par1])
mycolnames <- c(colnames(x)[par1], colnames(x)[1:k!=par1])
colnames(x1) <- mycolnames #colnames(x)[par1]
x <- x1
if (par3 == 'First Differences'){
x2 <- array(0, dim=c(n-1,k), dimnames=list(1:(n-1), paste('(1-B)',colnames(x),sep='')))
for (i in 1:n-1) {
for (j in 1:k) {
x2[i,j] <- x[i+1,j] - x[i,j]
}
}
x <- x2
}
if (par2 == 'Include Monthly Dummies'){
x2 <- array(0, dim=c(n,11), dimnames=list(1:n, paste('M', seq(1:11), sep ='')))
for (i in 1:11){
x2[seq(i,n,12),i] <- 1
}
x <- cbind(x, x2)
}
if (par2 == 'Include Quarterly Dummies'){
x2 <- array(0, dim=c(n,3), dimnames=list(1:n, paste('Q', seq(1:3), sep ='')))
for (i in 1:3){
x2[seq(i,n,4),i] <- 1
}
x <- cbind(x, x2)
}
k <- length(x[1,])
if (par3 == 'Linear Trend'){
x <- cbind(x, c(1:n))
colnames(x)[k+1] <- 't'
}
x
k <- length(x[1,])
df <- as.data.frame(x)
(mylm <- lm(df))
(mysum <- summary(mylm))
if (n > n25) {
kp3 <- k + 3
nmkm3 <- n - k - 3
gqarr <- array(NA, dim=c(nmkm3-kp3+1,3))
numgqtests <- 0
numsignificant1 <- 0
numsignificant5 <- 0
numsignificant10 <- 0
for (mypoint in kp3:nmkm3) {
j <- 0
numgqtests <- numgqtests + 1
for (myalt in c('greater', 'two.sided', 'less')) {
j <- j + 1
gqarr[mypoint-kp3+1,j] <- gqtest(mylm, point=mypoint, alternative=myalt)$p.value
}
if (gqarr[mypoint-kp3+1,2] < 0.01) numsignificant1 <- numsignificant1 + 1
if (gqarr[mypoint-kp3+1,2] < 0.05) numsignificant5 <- numsignificant5 + 1
if (gqarr[mypoint-kp3+1,2] < 0.10) numsignificant10 <- numsignificant10 + 1
}
gqarr
}
bitmap(file='test0.png')
plot(x[,1], type='l', main='Actuals and Interpolation', ylab='value of Actuals and Interpolation (dots)', xlab='time or index')
points(x[,1]-mysum$resid)
grid()
dev.off()
bitmap(file='test1.png')
plot(mysum$resid, type='b', pch=19, main='Residuals', ylab='value of Residuals', xlab='time or index')
grid()
dev.off()
bitmap(file='test2.png')
hist(mysum$resid, main='Residual Histogram', xlab='values of Residuals')
grid()
dev.off()
bitmap(file='test3.png')
densityplot(~mysum$resid,col='black',main='Residual Density Plot', xlab='values of Residuals')
dev.off()
bitmap(file='test4.png')
qqnorm(mysum$resid, main='Residual Normal Q-Q Plot')
qqline(mysum$resid)
grid()
dev.off()
(myerror <- as.ts(mysum$resid))
bitmap(file='test5.png')
dum <- cbind(lag(myerror,k=1),myerror)
dum
dum1 <- dum[2:length(myerror),]
dum1
z <- as.data.frame(dum1)
z
plot(z,main=paste('Residual Lag plot, lowess, and regression line'), ylab='values of Residuals', xlab='lagged values of Residuals')
lines(lowess(z))
abline(lm(z))
grid()
dev.off()
bitmap(file='test6.png')
acf(mysum$resid, lag.max=length(mysum$resid)/2, main='Residual Autocorrelation Function')
grid()
dev.off()
bitmap(file='test7.png')
pacf(mysum$resid, lag.max=length(mysum$resid)/2, main='Residual Partial Autocorrelation Function')
grid()
dev.off()
bitmap(file='test8.png')
opar <- par(mfrow = c(2,2), oma = c(0, 0, 1.1, 0))
plot(mylm, las = 1, sub='Residual Diagnostics')
par(opar)
dev.off()
if (n > n25) {
bitmap(file='test9.png')
plot(kp3:nmkm3,gqarr[,2], main='Goldfeld-Quandt test',ylab='2-sided p-value',xlab='breakpoint')
grid()
dev.off()
}
load(file='createtable')
a<-table.start()
a<-table.row.start(a)
a<-table.element(a, 'Multiple Linear Regression - Estimated Regression Equation', 1, TRUE)
a<-table.row.end(a)
myeq <- colnames(x)[1]
myeq <- paste(myeq, '[t] = ', sep='')
for (i in 1:k){
if (mysum$coefficients[i,1] > 0) myeq <- paste(myeq, '+', '')
myeq <- paste(myeq, mysum$coefficients[i,1], sep=' ')
if (rownames(mysum$coefficients)[i] != '(Intercept)') {
myeq <- paste(myeq, rownames(mysum$coefficients)[i], sep='')
if (rownames(mysum$coefficients)[i] != 't') myeq <- paste(myeq, '[t]', sep='')
}
}
myeq <- paste(myeq, ' + e[t]')
a<-table.row.start(a)
a<-table.element(a, myeq)
a<-table.row.end(a)
a<-table.end(a)
table.save(a,file='mytable1.tab')
a<-table.start()
a<-table.row.start(a)
a<-table.element(a,hyperlink('ols1.htm','Multiple Linear Regression - Ordinary Least Squares',''), 6, TRUE)
a<-table.row.end(a)
a<-table.row.start(a)
a<-table.element(a,'Variable',header=TRUE)
a<-table.element(a,'Parameter',header=TRUE)
a<-table.element(a,'S.D.',header=TRUE)
a<-table.element(a,'T-STAT
H0: parameter = 0',header=TRUE)
a<-table.element(a,'2-tail p-value',header=TRUE)
a<-table.element(a,'1-tail p-value',header=TRUE)
a<-table.row.end(a)
for (i in 1:k){
a<-table.row.start(a)
a<-table.element(a,rownames(mysum$coefficients)[i],header=TRUE)
a<-table.element(a,mysum$coefficients[i,1])
a<-table.element(a, round(mysum$coefficients[i,2],6))
a<-table.element(a, round(mysum$coefficients[i,3],4))
a<-table.element(a, round(mysum$coefficients[i,4],6))
a<-table.element(a, round(mysum$coefficients[i,4]/2,6))
a<-table.row.end(a)
}
a<-table.end(a)
table.save(a,file='mytable2.tab')
a<-table.start()
a<-table.row.start(a)
a<-table.element(a, 'Multiple Linear Regression - Regression Statistics', 2, TRUE)
a<-table.row.end(a)
a<-table.row.start(a)
a<-table.element(a, 'Multiple R',1,TRUE)
a<-table.element(a, sqrt(mysum$r.squared))
a<-table.row.end(a)
a<-table.row.start(a)
a<-table.element(a, 'R-squared',1,TRUE)
a<-table.element(a, mysum$r.squared)
a<-table.row.end(a)
a<-table.row.start(a)
a<-table.element(a, 'Adjusted R-squared',1,TRUE)
a<-table.element(a, mysum$adj.r.squared)
a<-table.row.end(a)
a<-table.row.start(a)
a<-table.element(a, 'F-TEST (value)',1,TRUE)
a<-table.element(a, mysum$fstatistic[1])
a<-table.row.end(a)
a<-table.row.start(a)
a<-table.element(a, 'F-TEST (DF numerator)',1,TRUE)
a<-table.element(a, mysum$fstatistic[2])
a<-table.row.end(a)
a<-table.row.start(a)
a<-table.element(a, 'F-TEST (DF denominator)',1,TRUE)
a<-table.element(a, mysum$fstatistic[3])
a<-table.row.end(a)
a<-table.row.start(a)
a<-table.element(a, 'p-value',1,TRUE)
a<-table.element(a, 1-pf(mysum$fstatistic[1],mysum$fstatistic[2],mysum$fstatistic[3]))
a<-table.row.end(a)
a<-table.row.start(a)
a<-table.element(a, 'Multiple Linear Regression - Residual Statistics', 2, TRUE)
a<-table.row.end(a)
a<-table.row.start(a)
a<-table.element(a, 'Residual Standard Deviation',1,TRUE)
a<-table.element(a, mysum$sigma)
a<-table.row.end(a)
a<-table.row.start(a)
a<-table.element(a, 'Sum Squared Residuals',1,TRUE)
a<-table.element(a, sum(myerror*myerror))
a<-table.row.end(a)
a<-table.end(a)
table.save(a,file='mytable3.tab')
a<-table.start()
a<-table.row.start(a)
a<-table.element(a, 'Multiple Linear Regression - Actuals, Interpolation, and Residuals', 4, TRUE)
a<-table.row.end(a)
a<-table.row.start(a)
a<-table.element(a, 'Time or Index', 1, TRUE)
a<-table.element(a, 'Actuals', 1, TRUE)
a<-table.element(a, 'Interpolation
Forecast', 1, TRUE)
a<-table.element(a, 'Residuals
Prediction Error', 1, TRUE)
a<-table.row.end(a)
for (i in 1:n) {
a<-table.row.start(a)
a<-table.element(a,i, 1, TRUE)
a<-table.element(a,x[i])
a<-table.element(a,x[i]-mysum$resid[i])
a<-table.element(a,mysum$resid[i])
a<-table.row.end(a)
}
a<-table.end(a)
table.save(a,file='mytable4.tab')
if (n > n25) {
a<-table.start()
a<-table.row.start(a)
a<-table.element(a,'Goldfeld-Quandt test for Heteroskedasticity',4,TRUE)
a<-table.row.end(a)
a<-table.row.start(a)
a<-table.element(a,'p-values',header=TRUE)
a<-table.element(a,'Alternative Hypothesis',3,header=TRUE)
a<-table.row.end(a)
a<-table.row.start(a)
a<-table.element(a,'breakpoint index',header=TRUE)
a<-table.element(a,'greater',header=TRUE)
a<-table.element(a,'2-sided',header=TRUE)
a<-table.element(a,'less',header=TRUE)
a<-table.row.end(a)
for (mypoint in kp3:nmkm3) {
a<-table.row.start(a)
a<-table.element(a,mypoint,header=TRUE)
a<-table.element(a,gqarr[mypoint-kp3+1,1])
a<-table.element(a,gqarr[mypoint-kp3+1,2])
a<-table.element(a,gqarr[mypoint-kp3+1,3])
a<-table.row.end(a)
}
a<-table.end(a)
table.save(a,file='mytable5.tab')
a<-table.start()
a<-table.row.start(a)
a<-table.element(a,'Meta Analysis of Goldfeld-Quandt test for Heteroskedasticity',4,TRUE)
a<-table.row.end(a)
a<-table.row.start(a)
a<-table.element(a,'Description',header=TRUE)
a<-table.element(a,'# significant tests',header=TRUE)
a<-table.element(a,'% significant tests',header=TRUE)
a<-table.element(a,'OK/NOK',header=TRUE)
a<-table.row.end(a)
a<-table.row.start(a)
a<-table.element(a,'1% type I error level',header=TRUE)
a<-table.element(a,numsignificant1)
a<-table.element(a,numsignificant1/numgqtests)
if (numsignificant1/numgqtests < 0.01) dum <- 'OK' else dum <- 'NOK'
a<-table.element(a,dum)
a<-table.row.end(a)
a<-table.row.start(a)
a<-table.element(a,'5% type I error level',header=TRUE)
a<-table.element(a,numsignificant5)
a<-table.element(a,numsignificant5/numgqtests)
if (numsignificant5/numgqtests < 0.05) dum <- 'OK' else dum <- 'NOK'
a<-table.element(a,dum)
a<-table.row.end(a)
a<-table.row.start(a)
a<-table.element(a,'10% type I error level',header=TRUE)
a<-table.element(a,numsignificant10)
a<-table.element(a,numsignificant10/numgqtests)
if (numsignificant10/numgqtests < 0.1) dum <- 'OK' else dum <- 'NOK'
a<-table.element(a,dum)
a<-table.row.end(a)
a<-table.end(a)
table.save(a,file='mytable6.tab')
}