Free Statistics

of Irreproducible Research!

Author's title

Author*Unverified author*
R Software Modulerwasp_multipleregression.wasp
Title produced by softwareMultiple Regression
Date of computationWed, 26 Nov 2008 11:17:22 -0700
Cite this page as followsStatistical Computations at FreeStatistics.org, Office for Research Development and Education, URL https://freestatistics.org/blog/index.php?v=date/2008/Nov/26/t1227723488jkozw8yce1vpwx2.htm/, Retrieved Sat, 18 May 2024 16:05:15 +0000
Statistical Computations at FreeStatistics.org, Office for Research Development and Education, URL https://freestatistics.org/blog/index.php?pk=25688, Retrieved Sat, 18 May 2024 16:05:15 +0000
QR Codes:

Original text written by user:
IsPrivate?No (this computation is public)
User-defined keywords
Estimated Impact146
Family? (F = Feedback message, R = changed R code, M = changed R Module, P = changed Parameters, D = changed Data)
F     [Multiple Regression] [] [2007-11-19 19:55:31] [b731da8b544846036771bbf9bf2f34ce]
- R  D  [Multiple Regression] [Question 3 ] [2008-11-26 18:10:11] [61ee628505870e1cbe17042de5c0878a]
F   PD      [Multiple Regression] [Seatbelt Law Ques...] [2008-11-26 18:17:22] [7423c12da5de7dfcebe74d8d26e06090] [Current]
Feedback Forum
2008-11-30 22:08:50 [Gilliam Schoorel] [reply
Je kon de gegevens uit de Estimated Regression Equation misschien iets beter uitleggen; Het lijkt erop of je het niet helemaal snapt omdat je zo'n beknopte uitleg/definitie geeft van de gegevens;
De conclusies van de grafieken zijn op sommige plaatsen onvolledig. Een algemene conclusie over de bewerkingen ontbreekt eveneens.
2008-12-01 18:02:34 [Sandra Hofmans] [reply
Tabel:
Je had hier nog kunnen vermelden dat we hier te maken hebben met een grote p-waarde, ze bedraagt meer dan de Type I Error, dit kan dus betekenen dat het resultaat te wijten is aan toeval.

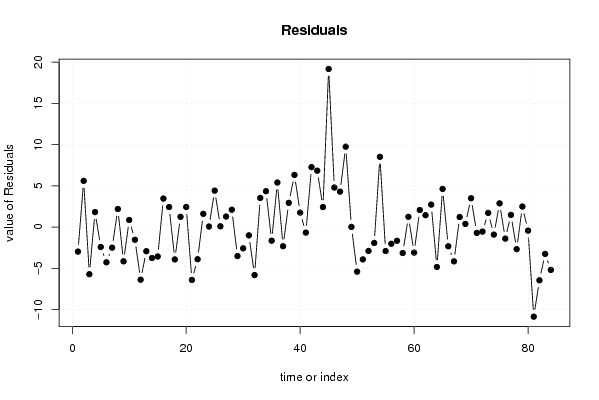
Residuals
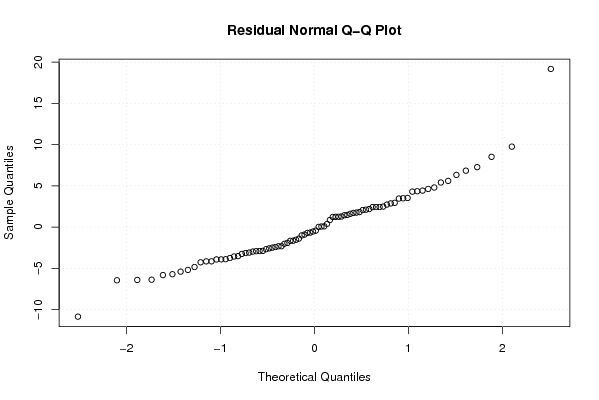
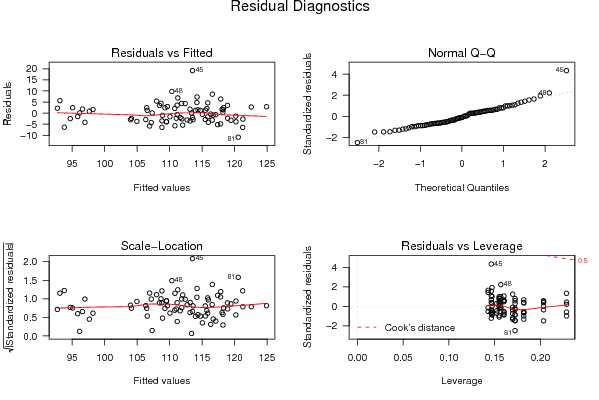
Deze grafiek geeft het verschil weer tussen de verschillende resultaten en de voorspelde resultaten, dit zijn dus de voorspellingsfouten. Normaal moet het gemiddelde hier constant zijn en gelijk aan nul. Dit is hier echter niet het geval.

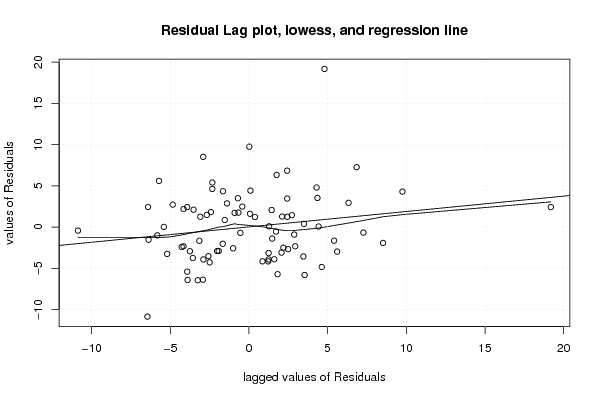
Op het residual lag plot zie je dat er geen verband is tussen de voorspellingsfouten van de vorige maand en die van deze.We spreken hier dus niet over voorspelbaarheid.

Autocorrelation:
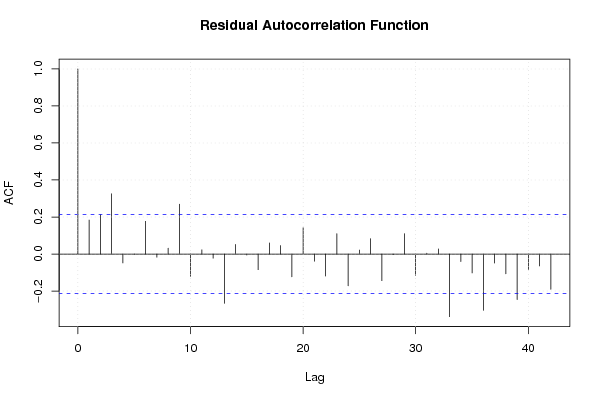
ER is geen patroon te zien, dit is goed. Bovendien bevinden zich de meeste verticale lijnen zich ook binnen het 95% betrouwbaarheidsinterval.

2008-12-01 20:04:00 [Peter Van Doninck] [reply
De r-waarde is correct geïnterpreteerd door de student. Wat opvalt is dat de residual plot vrij horizontaal loopt.
Voor de rest heeft de student weinig aantekeningen gemaakt. Wat nog wel opvalt, is dat de residual autocorrelation functie ook enkele uitschieters toont.

Post a new message
Dataseries X:
101	0
98.7	1
105.1	0
98.4	1
101.7	0
102.9	0
92.2	1
94.9	1
92.8	1
98.5	1
94.3	1
87.4	1
103.4	0
101.2	0
109.6	0
111.9	0
108.9	0
105.6	0
107.8	0
97.5	1
102.4	0
105.6	0
99.8	1
96.2	1
113.1	0
107.4	0
116.8	0
112.9	0
105.3	0
109.3	0
107.9	0
101.1	0
114.7	0
116.2	0
108.4	0
113.4	0
108.7	0
112.6	0
124.2	0
114.9	0
110.5	0
121.5	0
118.1	0
111.7	0
132.7	0
119	0
116.7	0
120.1	0
113.4	0
106.6	0
116.3	0
112.6	0
111.6	0
125.1	0
110.7	0
109.6	0
114.2	0
113.4	0
116	0
109.6	0
117.8	0
115.8	0
125.3	0
113	0
120.5	0
116.6	0
111.8	0
115.2	0
118.6	0
122.4	0
116.4	0
114.5	0
119.8	0
115.8	0
127.8	0
118.8	0
119.7	0
118.6	0
120.8	0
115.9	0
109.7	0
114.8	0
116.2	0
112.2	0


Summary of computational transaction
Raw Inputview raw input (R code)
Raw Outputview raw output of R engine
Computing time3 seconds
R Server'Gwilym Jenkins' @ 72.249.127.135

\begin{tabular}{lllllllll}
\hline
Summary of computational transaction \tabularnewline
Raw Input & view raw input (R code)  \tabularnewline
Raw Output & view raw output of R engine  \tabularnewline
Computing time & 3 seconds \tabularnewline
R Server & 'Gwilym Jenkins' @ 72.249.127.135 \tabularnewline
\hline
\end{tabular}
%Source: https://freestatistics.org/blog/index.php?pk=25688&T=0

[TABLE]
[ROW][C]Summary of computational transaction[/C][/ROW]
[ROW][C]Raw Input[/C][C]view raw input (R code) [/C][/ROW]
[ROW][C]Raw Output[/C][C]view raw output of R engine [/C][/ROW]
[ROW][C]Computing time[/C][C]3 seconds[/C][/ROW]
[ROW][C]R Server[/C][C]'Gwilym Jenkins' @ 72.249.127.135[/C][/ROW]
[/TABLE]
Source: https://freestatistics.org/blog/index.php?pk=25688&T=0

Globally Unique Identifier (entire table): ba.freestatistics.org/blog/index.php?pk=25688&T=0

As an alternative you can also use a QR Code:  

The GUIDs for individual cells are displayed in the table below:

Summary of computational transaction
Raw Inputview raw input (R code)
Raw Outputview raw output of R engine
Computing time3 seconds
R Server'Gwilym Jenkins' @ 72.249.127.135


Multiple Linear Regression - Estimated Regression Equation
y[t] = + 100.940779220779 -9.5078787878788x[t] + 2.8386219336219M1[t] + 1.27239538239537M2[t] + 9.28963203463204M3[t] + 4.36626262626262M4[t] + 2.19778499278498M5[t] + 5.05900432900432M6[t] + 1.89277777777777M7[t] -0.287734487734494M8[t] + 3.75807359307359M9[t] + 4.24786435786436M10[t] + 2.25306637806637M11[t] + 0.195923520923521t + e[t]

\begin{tabular}{lllllllll}
\hline
Multiple Linear Regression - Estimated Regression Equation \tabularnewline
y[t] =  +  100.940779220779 -9.5078787878788x[t] +  2.8386219336219M1[t] +  1.27239538239537M2[t] +  9.28963203463204M3[t] +  4.36626262626262M4[t] +  2.19778499278498M5[t] +  5.05900432900432M6[t] +  1.89277777777777M7[t] -0.287734487734494M8[t] +  3.75807359307359M9[t] +  4.24786435786436M10[t] +  2.25306637806637M11[t] +  0.195923520923521t  + e[t] \tabularnewline
\hline
\end{tabular}
%Source: https://freestatistics.org/blog/index.php?pk=25688&T=1

[TABLE]
[ROW][C]Multiple Linear Regression - Estimated Regression Equation[/C][/ROW]
[ROW][C]y[t] =  +  100.940779220779 -9.5078787878788x[t] +  2.8386219336219M1[t] +  1.27239538239537M2[t] +  9.28963203463204M3[t] +  4.36626262626262M4[t] +  2.19778499278498M5[t] +  5.05900432900432M6[t] +  1.89277777777777M7[t] -0.287734487734494M8[t] +  3.75807359307359M9[t] +  4.24786435786436M10[t] +  2.25306637806637M11[t] +  0.195923520923521t  + e[t][/C][/ROW]
[/TABLE]
Source: https://freestatistics.org/blog/index.php?pk=25688&T=1

Globally Unique Identifier (entire table): ba.freestatistics.org/blog/index.php?pk=25688&T=1

As an alternative you can also use a QR Code:  

The GUIDs for individual cells are displayed in the table below:

Multiple Linear Regression - Estimated Regression Equation
y[t] = + 100.940779220779 -9.5078787878788x[t] + 2.8386219336219M1[t] + 1.27239538239537M2[t] + 9.28963203463204M3[t] + 4.36626262626262M4[t] + 2.19778499278498M5[t] + 5.05900432900432M6[t] + 1.89277777777777M7[t] -0.287734487734494M8[t] + 3.75807359307359M9[t] + 4.24786435786436M10[t] + 2.25306637806637M11[t] + 0.195923520923521t + e[t]


Multiple Linear Regression - Ordinary Least Squares
VariableParameterS.D.T-STATH0: parameter = 02-tail p-value1-tail p-value
(Intercept)100.9407792207792.44635641.261700
x-9.50787878787881.974079-4.81648e-064e-06
M12.83862193362192.6730441.06190.2919110.145956
M21.272395382395372.6062740.48820.6269310.313465
M39.289632034632042.6616563.49020.000840.00042
M44.366262626262622.5983151.68040.0973330.048667
M52.197784992784982.6512610.8290.4099460.204973
M65.059004329004322.6464391.91160.0600180.030009
M71.892777777777772.5883330.73130.4670530.233527
M8-0.2877344877344942.56365-0.11220.9109570.455479
M93.758073593073592.5829931.45490.1501580.075079
M104.247864357864362.580721.6460.1042470.052123
M112.253066378066372.5616290.87950.3821160.191058
t0.1959235209235210.0262757.456700

\begin{tabular}{lllllllll}
\hline
Multiple Linear Regression - Ordinary Least Squares \tabularnewline
Variable & Parameter & S.D. & T-STATH0: parameter = 0 & 2-tail p-value & 1-tail p-value \tabularnewline
(Intercept) & 100.940779220779 & 2.446356 & 41.2617 & 0 & 0 \tabularnewline
x & -9.5078787878788 & 1.974079 & -4.8164 & 8e-06 & 4e-06 \tabularnewline
M1 & 2.8386219336219 & 2.673044 & 1.0619 & 0.291911 & 0.145956 \tabularnewline
M2 & 1.27239538239537 & 2.606274 & 0.4882 & 0.626931 & 0.313465 \tabularnewline
M3 & 9.28963203463204 & 2.661656 & 3.4902 & 0.00084 & 0.00042 \tabularnewline
M4 & 4.36626262626262 & 2.598315 & 1.6804 & 0.097333 & 0.048667 \tabularnewline
M5 & 2.19778499278498 & 2.651261 & 0.829 & 0.409946 & 0.204973 \tabularnewline
M6 & 5.05900432900432 & 2.646439 & 1.9116 & 0.060018 & 0.030009 \tabularnewline
M7 & 1.89277777777777 & 2.588333 & 0.7313 & 0.467053 & 0.233527 \tabularnewline
M8 & -0.287734487734494 & 2.56365 & -0.1122 & 0.910957 & 0.455479 \tabularnewline
M9 & 3.75807359307359 & 2.582993 & 1.4549 & 0.150158 & 0.075079 \tabularnewline
M10 & 4.24786435786436 & 2.58072 & 1.646 & 0.104247 & 0.052123 \tabularnewline
M11 & 2.25306637806637 & 2.561629 & 0.8795 & 0.382116 & 0.191058 \tabularnewline
t & 0.195923520923521 & 0.026275 & 7.4567 & 0 & 0 \tabularnewline
\hline
\end{tabular}
%Source: https://freestatistics.org/blog/index.php?pk=25688&T=2

[TABLE]
[ROW][C]Multiple Linear Regression - Ordinary Least Squares[/C][/ROW]
[ROW][C]Variable[/C][C]Parameter[/C][C]S.D.[/C][C]T-STATH0: parameter = 0[/C][C]2-tail p-value[/C][C]1-tail p-value[/C][/ROW]
[ROW][C](Intercept)[/C][C]100.940779220779[/C][C]2.446356[/C][C]41.2617[/C][C]0[/C][C]0[/C][/ROW]
[ROW][C]x[/C][C]-9.5078787878788[/C][C]1.974079[/C][C]-4.8164[/C][C]8e-06[/C][C]4e-06[/C][/ROW]
[ROW][C]M1[/C][C]2.8386219336219[/C][C]2.673044[/C][C]1.0619[/C][C]0.291911[/C][C]0.145956[/C][/ROW]
[ROW][C]M2[/C][C]1.27239538239537[/C][C]2.606274[/C][C]0.4882[/C][C]0.626931[/C][C]0.313465[/C][/ROW]
[ROW][C]M3[/C][C]9.28963203463204[/C][C]2.661656[/C][C]3.4902[/C][C]0.00084[/C][C]0.00042[/C][/ROW]
[ROW][C]M4[/C][C]4.36626262626262[/C][C]2.598315[/C][C]1.6804[/C][C]0.097333[/C][C]0.048667[/C][/ROW]
[ROW][C]M5[/C][C]2.19778499278498[/C][C]2.651261[/C][C]0.829[/C][C]0.409946[/C][C]0.204973[/C][/ROW]
[ROW][C]M6[/C][C]5.05900432900432[/C][C]2.646439[/C][C]1.9116[/C][C]0.060018[/C][C]0.030009[/C][/ROW]
[ROW][C]M7[/C][C]1.89277777777777[/C][C]2.588333[/C][C]0.7313[/C][C]0.467053[/C][C]0.233527[/C][/ROW]
[ROW][C]M8[/C][C]-0.287734487734494[/C][C]2.56365[/C][C]-0.1122[/C][C]0.910957[/C][C]0.455479[/C][/ROW]
[ROW][C]M9[/C][C]3.75807359307359[/C][C]2.582993[/C][C]1.4549[/C][C]0.150158[/C][C]0.075079[/C][/ROW]
[ROW][C]M10[/C][C]4.24786435786436[/C][C]2.58072[/C][C]1.646[/C][C]0.104247[/C][C]0.052123[/C][/ROW]
[ROW][C]M11[/C][C]2.25306637806637[/C][C]2.561629[/C][C]0.8795[/C][C]0.382116[/C][C]0.191058[/C][/ROW]
[ROW][C]t[/C][C]0.195923520923521[/C][C]0.026275[/C][C]7.4567[/C][C]0[/C][C]0[/C][/ROW]
[/TABLE]
Source: https://freestatistics.org/blog/index.php?pk=25688&T=2

Globally Unique Identifier (entire table): ba.freestatistics.org/blog/index.php?pk=25688&T=2

As an alternative you can also use a QR Code:  

The GUIDs for individual cells are displayed in the table below:

Multiple Linear Regression - Ordinary Least Squares
VariableParameterS.D.T-STATH0: parameter = 02-tail p-value1-tail p-value
(Intercept)100.9407792207792.44635641.261700
x-9.50787878787881.974079-4.81648e-064e-06
M12.83862193362192.6730441.06190.2919110.145956
M21.272395382395372.6062740.48820.6269310.313465
M39.289632034632042.6616563.49020.000840.00042
M44.366262626262622.5983151.68040.0973330.048667
M52.197784992784982.6512610.8290.4099460.204973
M65.059004329004322.6464391.91160.0600180.030009
M71.892777777777772.5883330.73130.4670530.233527
M8-0.2877344877344942.56365-0.11220.9109570.455479
M93.758073593073592.5829931.45490.1501580.075079
M104.247864357864362.580721.6460.1042470.052123
M112.253066378066372.5616290.87950.3821160.191058
t0.1959235209235210.0262757.456700


Multiple Linear Regression - Regression Statistics
Multiple R0.86328875740995
R-squared0.745267478670416
Adjusted R-squared0.697960010423493
F-TEST (value)15.7536961136975
F-TEST (DF numerator)13
F-TEST (DF denominator)70
p-value6.66133814775094e-16
Multiple Linear Regression - Residual Statistics
Residual Standard Deviation4.7921172389056
Sum Squared Residuals1607.50713419913

\begin{tabular}{lllllllll}
\hline
Multiple Linear Regression - Regression Statistics \tabularnewline
Multiple R & 0.86328875740995 \tabularnewline
R-squared & 0.745267478670416 \tabularnewline
Adjusted R-squared & 0.697960010423493 \tabularnewline
F-TEST (value) & 15.7536961136975 \tabularnewline
F-TEST (DF numerator) & 13 \tabularnewline
F-TEST (DF denominator) & 70 \tabularnewline
p-value & 6.66133814775094e-16 \tabularnewline
Multiple Linear Regression - Residual Statistics \tabularnewline
Residual Standard Deviation & 4.7921172389056 \tabularnewline
Sum Squared Residuals & 1607.50713419913 \tabularnewline
\hline
\end{tabular}
%Source: https://freestatistics.org/blog/index.php?pk=25688&T=3

[TABLE]
[ROW][C]Multiple Linear Regression - Regression Statistics[/C][/ROW]
[ROW][C]Multiple R[/C][C]0.86328875740995[/C][/ROW]
[ROW][C]R-squared[/C][C]0.745267478670416[/C][/ROW]
[ROW][C]Adjusted R-squared[/C][C]0.697960010423493[/C][/ROW]
[ROW][C]F-TEST (value)[/C][C]15.7536961136975[/C][/ROW]
[ROW][C]F-TEST (DF numerator)[/C][C]13[/C][/ROW]
[ROW][C]F-TEST (DF denominator)[/C][C]70[/C][/ROW]
[ROW][C]p-value[/C][C]6.66133814775094e-16[/C][/ROW]
[ROW][C]Multiple Linear Regression - Residual Statistics[/C][/ROW]
[ROW][C]Residual Standard Deviation[/C][C]4.7921172389056[/C][/ROW]
[ROW][C]Sum Squared Residuals[/C][C]1607.50713419913[/C][/ROW]
[/TABLE]
Source: https://freestatistics.org/blog/index.php?pk=25688&T=3

Globally Unique Identifier (entire table): ba.freestatistics.org/blog/index.php?pk=25688&T=3

As an alternative you can also use a QR Code:  

The GUIDs for individual cells are displayed in the table below:

Multiple Linear Regression - Regression Statistics
Multiple R0.86328875740995
R-squared0.745267478670416
Adjusted R-squared0.697960010423493
F-TEST (value)15.7536961136975
F-TEST (DF numerator)13
F-TEST (DF denominator)70
p-value6.66133814775094e-16
Multiple Linear Regression - Residual Statistics
Residual Standard Deviation4.7921172389056
Sum Squared Residuals1607.50713419913


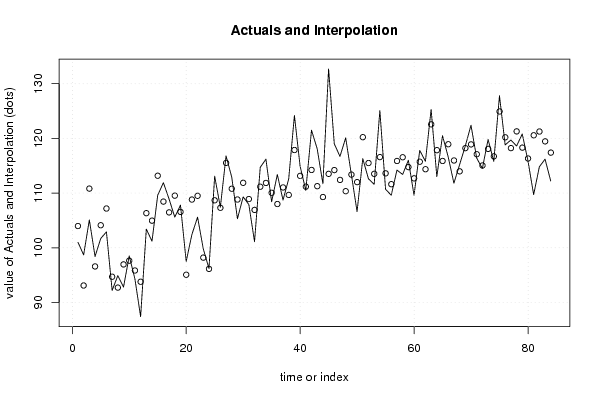
Multiple Linear Regression - Actuals, Interpolation, and Residuals
Time or IndexActualsInterpolationForecastResidualsPrediction Error
1101103.975324675325-2.97532467532478
298.793.09714285714295.60285714285715
3105.1110.818181818182-5.7181818181818
498.496.58285714285711.81714285714287
5101.7104.118181818182-2.41818181818184
6102.9107.175324675325-4.27532467532465
792.294.6971428571429-2.49714285714285
894.992.71255411255412.18744588744589
992.896.9542857142857-4.15428571428571
1098.597.640.860000000000004
1194.395.8411255411255-1.54112554112554
1287.493.7839826839827-6.38398268398268
13103.4106.326406926407-2.92640692640690
14101.2104.956103896104-3.7561038961039
15109.6113.169264069264-3.56926406926408
16111.9108.4418181818183.45818181818182
17108.9106.4692640692642.43073593073594
18105.6109.526406926407-3.92640692640693
19107.8106.5561038961041.2438961038961
2097.595.06363636363642.43636363636364
21102.4108.813246753247-6.41324675324675
22105.6109.498961038961-3.89896103896105
2399.898.19220779220781.60779220779221
2496.296.1350649350650.064935064935066
25113.1108.6774891774894.42251082251084
26107.4107.3071861471860.0928138528138628
27116.8115.5203463203461.27965367965368
28112.9110.7929004329002.10709956709957
29105.3108.820346320346-3.52034632034632
30109.3111.877489177489-2.57748917748918
31107.9108.907186147186-1.00718614718614
32101.1106.922597402597-5.82259740259741
33114.7111.1643290043293.53567099567100
34116.2111.8500432900434.34995670995671
35108.4110.051168831169-1.65116883116882
36113.4107.9940259740265.40597402597403
37108.7111.028571428571-2.32857142857141
38112.6109.6582683982682.9417316017316
39124.2117.8714285714296.32857142857143
40114.9113.1439826839831.75601731601732
41110.5111.171428571429-0.671428571428568
42121.5114.2285714285717.27142857142857
43118.1111.2582683982686.84173160173159
44111.7109.2736796536802.42632034632035
45132.7113.51541125541119.1845887445887
46119114.2011255411264.79887445887446
47116.7112.4022510822514.29774891774892
48120.1110.3451082251089.75489177489177
49113.4113.3796536796540.0203463203463458
50106.6112.009350649351-5.40935064935065
51116.3120.222510822511-3.92251082251083
52112.6115.495064935065-2.89506493506494
53111.6113.522510822511-1.92251082251082
54125.1116.5796536796548.52034632034632
55110.7113.609350649351-2.90935064935065
56109.6111.624761904762-2.02476190476191
57114.2115.866493506494-1.66649350649351
58113.4116.552207792208-3.15220779220779
59116114.7533333333331.24666666666667
60109.6112.696190476190-3.09619047619048
61117.8115.7307359307362.06926406926409
62115.8114.3604329004331.4395670995671
63125.3122.5735930735932.72640692640692
64113117.846147186147-4.84614718614719
65120.5115.8735930735934.62640692640693
66116.6118.930735930736-2.33073593073594
67111.8115.960432900433-4.16043290043290
68115.2113.9758441558441.22415584415585
69118.6118.2175757575760.382424242424234
70122.4118.903290043293.49670995670996
71116.4117.104415584416-0.704415584415578
72114.5115.047272727273-0.547272727272732
73119.8118.0818181818181.71818181818183
74115.8116.711515151515-0.911515151515152
75127.8124.9246753246752.87532467532467
76118.8120.197229437229-1.39722943722944
77119.7118.2246753246751.47532467532468
78118.6121.281818181818-2.68181818181819
79120.8118.3115151515152.48848484848484
80115.9116.326926406926-0.426926406926401
81109.7120.568658008658-10.868658008658
82114.8121.254372294372-6.4543722943723
83116.2119.455497835498-3.25549783549783
84112.2117.398354978355-5.19835497835498

\begin{tabular}{lllllllll}
\hline
Multiple Linear Regression - Actuals, Interpolation, and Residuals \tabularnewline
Time or Index & Actuals & InterpolationForecast & ResidualsPrediction Error \tabularnewline
1 & 101 & 103.975324675325 & -2.97532467532478 \tabularnewline
2 & 98.7 & 93.0971428571429 & 5.60285714285715 \tabularnewline
3 & 105.1 & 110.818181818182 & -5.7181818181818 \tabularnewline
4 & 98.4 & 96.5828571428571 & 1.81714285714287 \tabularnewline
5 & 101.7 & 104.118181818182 & -2.41818181818184 \tabularnewline
6 & 102.9 & 107.175324675325 & -4.27532467532465 \tabularnewline
7 & 92.2 & 94.6971428571429 & -2.49714285714285 \tabularnewline
8 & 94.9 & 92.7125541125541 & 2.18744588744589 \tabularnewline
9 & 92.8 & 96.9542857142857 & -4.15428571428571 \tabularnewline
10 & 98.5 & 97.64 & 0.860000000000004 \tabularnewline
11 & 94.3 & 95.8411255411255 & -1.54112554112554 \tabularnewline
12 & 87.4 & 93.7839826839827 & -6.38398268398268 \tabularnewline
13 & 103.4 & 106.326406926407 & -2.92640692640690 \tabularnewline
14 & 101.2 & 104.956103896104 & -3.7561038961039 \tabularnewline
15 & 109.6 & 113.169264069264 & -3.56926406926408 \tabularnewline
16 & 111.9 & 108.441818181818 & 3.45818181818182 \tabularnewline
17 & 108.9 & 106.469264069264 & 2.43073593073594 \tabularnewline
18 & 105.6 & 109.526406926407 & -3.92640692640693 \tabularnewline
19 & 107.8 & 106.556103896104 & 1.2438961038961 \tabularnewline
20 & 97.5 & 95.0636363636364 & 2.43636363636364 \tabularnewline
21 & 102.4 & 108.813246753247 & -6.41324675324675 \tabularnewline
22 & 105.6 & 109.498961038961 & -3.89896103896105 \tabularnewline
23 & 99.8 & 98.1922077922078 & 1.60779220779221 \tabularnewline
24 & 96.2 & 96.135064935065 & 0.064935064935066 \tabularnewline
25 & 113.1 & 108.677489177489 & 4.42251082251084 \tabularnewline
26 & 107.4 & 107.307186147186 & 0.0928138528138628 \tabularnewline
27 & 116.8 & 115.520346320346 & 1.27965367965368 \tabularnewline
28 & 112.9 & 110.792900432900 & 2.10709956709957 \tabularnewline
29 & 105.3 & 108.820346320346 & -3.52034632034632 \tabularnewline
30 & 109.3 & 111.877489177489 & -2.57748917748918 \tabularnewline
31 & 107.9 & 108.907186147186 & -1.00718614718614 \tabularnewline
32 & 101.1 & 106.922597402597 & -5.82259740259741 \tabularnewline
33 & 114.7 & 111.164329004329 & 3.53567099567100 \tabularnewline
34 & 116.2 & 111.850043290043 & 4.34995670995671 \tabularnewline
35 & 108.4 & 110.051168831169 & -1.65116883116882 \tabularnewline
36 & 113.4 & 107.994025974026 & 5.40597402597403 \tabularnewline
37 & 108.7 & 111.028571428571 & -2.32857142857141 \tabularnewline
38 & 112.6 & 109.658268398268 & 2.9417316017316 \tabularnewline
39 & 124.2 & 117.871428571429 & 6.32857142857143 \tabularnewline
40 & 114.9 & 113.143982683983 & 1.75601731601732 \tabularnewline
41 & 110.5 & 111.171428571429 & -0.671428571428568 \tabularnewline
42 & 121.5 & 114.228571428571 & 7.27142857142857 \tabularnewline
43 & 118.1 & 111.258268398268 & 6.84173160173159 \tabularnewline
44 & 111.7 & 109.273679653680 & 2.42632034632035 \tabularnewline
45 & 132.7 & 113.515411255411 & 19.1845887445887 \tabularnewline
46 & 119 & 114.201125541126 & 4.79887445887446 \tabularnewline
47 & 116.7 & 112.402251082251 & 4.29774891774892 \tabularnewline
48 & 120.1 & 110.345108225108 & 9.75489177489177 \tabularnewline
49 & 113.4 & 113.379653679654 & 0.0203463203463458 \tabularnewline
50 & 106.6 & 112.009350649351 & -5.40935064935065 \tabularnewline
51 & 116.3 & 120.222510822511 & -3.92251082251083 \tabularnewline
52 & 112.6 & 115.495064935065 & -2.89506493506494 \tabularnewline
53 & 111.6 & 113.522510822511 & -1.92251082251082 \tabularnewline
54 & 125.1 & 116.579653679654 & 8.52034632034632 \tabularnewline
55 & 110.7 & 113.609350649351 & -2.90935064935065 \tabularnewline
56 & 109.6 & 111.624761904762 & -2.02476190476191 \tabularnewline
57 & 114.2 & 115.866493506494 & -1.66649350649351 \tabularnewline
58 & 113.4 & 116.552207792208 & -3.15220779220779 \tabularnewline
59 & 116 & 114.753333333333 & 1.24666666666667 \tabularnewline
60 & 109.6 & 112.696190476190 & -3.09619047619048 \tabularnewline
61 & 117.8 & 115.730735930736 & 2.06926406926409 \tabularnewline
62 & 115.8 & 114.360432900433 & 1.4395670995671 \tabularnewline
63 & 125.3 & 122.573593073593 & 2.72640692640692 \tabularnewline
64 & 113 & 117.846147186147 & -4.84614718614719 \tabularnewline
65 & 120.5 & 115.873593073593 & 4.62640692640693 \tabularnewline
66 & 116.6 & 118.930735930736 & -2.33073593073594 \tabularnewline
67 & 111.8 & 115.960432900433 & -4.16043290043290 \tabularnewline
68 & 115.2 & 113.975844155844 & 1.22415584415585 \tabularnewline
69 & 118.6 & 118.217575757576 & 0.382424242424234 \tabularnewline
70 & 122.4 & 118.90329004329 & 3.49670995670996 \tabularnewline
71 & 116.4 & 117.104415584416 & -0.704415584415578 \tabularnewline
72 & 114.5 & 115.047272727273 & -0.547272727272732 \tabularnewline
73 & 119.8 & 118.081818181818 & 1.71818181818183 \tabularnewline
74 & 115.8 & 116.711515151515 & -0.911515151515152 \tabularnewline
75 & 127.8 & 124.924675324675 & 2.87532467532467 \tabularnewline
76 & 118.8 & 120.197229437229 & -1.39722943722944 \tabularnewline
77 & 119.7 & 118.224675324675 & 1.47532467532468 \tabularnewline
78 & 118.6 & 121.281818181818 & -2.68181818181819 \tabularnewline
79 & 120.8 & 118.311515151515 & 2.48848484848484 \tabularnewline
80 & 115.9 & 116.326926406926 & -0.426926406926401 \tabularnewline
81 & 109.7 & 120.568658008658 & -10.868658008658 \tabularnewline
82 & 114.8 & 121.254372294372 & -6.4543722943723 \tabularnewline
83 & 116.2 & 119.455497835498 & -3.25549783549783 \tabularnewline
84 & 112.2 & 117.398354978355 & -5.19835497835498 \tabularnewline
\hline
\end{tabular}
%Source: https://freestatistics.org/blog/index.php?pk=25688&T=4

[TABLE]
[ROW][C]Multiple Linear Regression - Actuals, Interpolation, and Residuals[/C][/ROW]
[ROW][C]Time or Index[/C][C]Actuals[/C][C]InterpolationForecast[/C][C]ResidualsPrediction Error[/C][/ROW]
[ROW][C]1[/C][C]101[/C][C]103.975324675325[/C][C]-2.97532467532478[/C][/ROW]
[ROW][C]2[/C][C]98.7[/C][C]93.0971428571429[/C][C]5.60285714285715[/C][/ROW]
[ROW][C]3[/C][C]105.1[/C][C]110.818181818182[/C][C]-5.7181818181818[/C][/ROW]
[ROW][C]4[/C][C]98.4[/C][C]96.5828571428571[/C][C]1.81714285714287[/C][/ROW]
[ROW][C]5[/C][C]101.7[/C][C]104.118181818182[/C][C]-2.41818181818184[/C][/ROW]
[ROW][C]6[/C][C]102.9[/C][C]107.175324675325[/C][C]-4.27532467532465[/C][/ROW]
[ROW][C]7[/C][C]92.2[/C][C]94.6971428571429[/C][C]-2.49714285714285[/C][/ROW]
[ROW][C]8[/C][C]94.9[/C][C]92.7125541125541[/C][C]2.18744588744589[/C][/ROW]
[ROW][C]9[/C][C]92.8[/C][C]96.9542857142857[/C][C]-4.15428571428571[/C][/ROW]
[ROW][C]10[/C][C]98.5[/C][C]97.64[/C][C]0.860000000000004[/C][/ROW]
[ROW][C]11[/C][C]94.3[/C][C]95.8411255411255[/C][C]-1.54112554112554[/C][/ROW]
[ROW][C]12[/C][C]87.4[/C][C]93.7839826839827[/C][C]-6.38398268398268[/C][/ROW]
[ROW][C]13[/C][C]103.4[/C][C]106.326406926407[/C][C]-2.92640692640690[/C][/ROW]
[ROW][C]14[/C][C]101.2[/C][C]104.956103896104[/C][C]-3.7561038961039[/C][/ROW]
[ROW][C]15[/C][C]109.6[/C][C]113.169264069264[/C][C]-3.56926406926408[/C][/ROW]
[ROW][C]16[/C][C]111.9[/C][C]108.441818181818[/C][C]3.45818181818182[/C][/ROW]
[ROW][C]17[/C][C]108.9[/C][C]106.469264069264[/C][C]2.43073593073594[/C][/ROW]
[ROW][C]18[/C][C]105.6[/C][C]109.526406926407[/C][C]-3.92640692640693[/C][/ROW]
[ROW][C]19[/C][C]107.8[/C][C]106.556103896104[/C][C]1.2438961038961[/C][/ROW]
[ROW][C]20[/C][C]97.5[/C][C]95.0636363636364[/C][C]2.43636363636364[/C][/ROW]
[ROW][C]21[/C][C]102.4[/C][C]108.813246753247[/C][C]-6.41324675324675[/C][/ROW]
[ROW][C]22[/C][C]105.6[/C][C]109.498961038961[/C][C]-3.89896103896105[/C][/ROW]
[ROW][C]23[/C][C]99.8[/C][C]98.1922077922078[/C][C]1.60779220779221[/C][/ROW]
[ROW][C]24[/C][C]96.2[/C][C]96.135064935065[/C][C]0.064935064935066[/C][/ROW]
[ROW][C]25[/C][C]113.1[/C][C]108.677489177489[/C][C]4.42251082251084[/C][/ROW]
[ROW][C]26[/C][C]107.4[/C][C]107.307186147186[/C][C]0.0928138528138628[/C][/ROW]
[ROW][C]27[/C][C]116.8[/C][C]115.520346320346[/C][C]1.27965367965368[/C][/ROW]
[ROW][C]28[/C][C]112.9[/C][C]110.792900432900[/C][C]2.10709956709957[/C][/ROW]
[ROW][C]29[/C][C]105.3[/C][C]108.820346320346[/C][C]-3.52034632034632[/C][/ROW]
[ROW][C]30[/C][C]109.3[/C][C]111.877489177489[/C][C]-2.57748917748918[/C][/ROW]
[ROW][C]31[/C][C]107.9[/C][C]108.907186147186[/C][C]-1.00718614718614[/C][/ROW]
[ROW][C]32[/C][C]101.1[/C][C]106.922597402597[/C][C]-5.82259740259741[/C][/ROW]
[ROW][C]33[/C][C]114.7[/C][C]111.164329004329[/C][C]3.53567099567100[/C][/ROW]
[ROW][C]34[/C][C]116.2[/C][C]111.850043290043[/C][C]4.34995670995671[/C][/ROW]
[ROW][C]35[/C][C]108.4[/C][C]110.051168831169[/C][C]-1.65116883116882[/C][/ROW]
[ROW][C]36[/C][C]113.4[/C][C]107.994025974026[/C][C]5.40597402597403[/C][/ROW]
[ROW][C]37[/C][C]108.7[/C][C]111.028571428571[/C][C]-2.32857142857141[/C][/ROW]
[ROW][C]38[/C][C]112.6[/C][C]109.658268398268[/C][C]2.9417316017316[/C][/ROW]
[ROW][C]39[/C][C]124.2[/C][C]117.871428571429[/C][C]6.32857142857143[/C][/ROW]
[ROW][C]40[/C][C]114.9[/C][C]113.143982683983[/C][C]1.75601731601732[/C][/ROW]
[ROW][C]41[/C][C]110.5[/C][C]111.171428571429[/C][C]-0.671428571428568[/C][/ROW]
[ROW][C]42[/C][C]121.5[/C][C]114.228571428571[/C][C]7.27142857142857[/C][/ROW]
[ROW][C]43[/C][C]118.1[/C][C]111.258268398268[/C][C]6.84173160173159[/C][/ROW]
[ROW][C]44[/C][C]111.7[/C][C]109.273679653680[/C][C]2.42632034632035[/C][/ROW]
[ROW][C]45[/C][C]132.7[/C][C]113.515411255411[/C][C]19.1845887445887[/C][/ROW]
[ROW][C]46[/C][C]119[/C][C]114.201125541126[/C][C]4.79887445887446[/C][/ROW]
[ROW][C]47[/C][C]116.7[/C][C]112.402251082251[/C][C]4.29774891774892[/C][/ROW]
[ROW][C]48[/C][C]120.1[/C][C]110.345108225108[/C][C]9.75489177489177[/C][/ROW]
[ROW][C]49[/C][C]113.4[/C][C]113.379653679654[/C][C]0.0203463203463458[/C][/ROW]
[ROW][C]50[/C][C]106.6[/C][C]112.009350649351[/C][C]-5.40935064935065[/C][/ROW]
[ROW][C]51[/C][C]116.3[/C][C]120.222510822511[/C][C]-3.92251082251083[/C][/ROW]
[ROW][C]52[/C][C]112.6[/C][C]115.495064935065[/C][C]-2.89506493506494[/C][/ROW]
[ROW][C]53[/C][C]111.6[/C][C]113.522510822511[/C][C]-1.92251082251082[/C][/ROW]
[ROW][C]54[/C][C]125.1[/C][C]116.579653679654[/C][C]8.52034632034632[/C][/ROW]
[ROW][C]55[/C][C]110.7[/C][C]113.609350649351[/C][C]-2.90935064935065[/C][/ROW]
[ROW][C]56[/C][C]109.6[/C][C]111.624761904762[/C][C]-2.02476190476191[/C][/ROW]
[ROW][C]57[/C][C]114.2[/C][C]115.866493506494[/C][C]-1.66649350649351[/C][/ROW]
[ROW][C]58[/C][C]113.4[/C][C]116.552207792208[/C][C]-3.15220779220779[/C][/ROW]
[ROW][C]59[/C][C]116[/C][C]114.753333333333[/C][C]1.24666666666667[/C][/ROW]
[ROW][C]60[/C][C]109.6[/C][C]112.696190476190[/C][C]-3.09619047619048[/C][/ROW]
[ROW][C]61[/C][C]117.8[/C][C]115.730735930736[/C][C]2.06926406926409[/C][/ROW]
[ROW][C]62[/C][C]115.8[/C][C]114.360432900433[/C][C]1.4395670995671[/C][/ROW]
[ROW][C]63[/C][C]125.3[/C][C]122.573593073593[/C][C]2.72640692640692[/C][/ROW]
[ROW][C]64[/C][C]113[/C][C]117.846147186147[/C][C]-4.84614718614719[/C][/ROW]
[ROW][C]65[/C][C]120.5[/C][C]115.873593073593[/C][C]4.62640692640693[/C][/ROW]
[ROW][C]66[/C][C]116.6[/C][C]118.930735930736[/C][C]-2.33073593073594[/C][/ROW]
[ROW][C]67[/C][C]111.8[/C][C]115.960432900433[/C][C]-4.16043290043290[/C][/ROW]
[ROW][C]68[/C][C]115.2[/C][C]113.975844155844[/C][C]1.22415584415585[/C][/ROW]
[ROW][C]69[/C][C]118.6[/C][C]118.217575757576[/C][C]0.382424242424234[/C][/ROW]
[ROW][C]70[/C][C]122.4[/C][C]118.90329004329[/C][C]3.49670995670996[/C][/ROW]
[ROW][C]71[/C][C]116.4[/C][C]117.104415584416[/C][C]-0.704415584415578[/C][/ROW]
[ROW][C]72[/C][C]114.5[/C][C]115.047272727273[/C][C]-0.547272727272732[/C][/ROW]
[ROW][C]73[/C][C]119.8[/C][C]118.081818181818[/C][C]1.71818181818183[/C][/ROW]
[ROW][C]74[/C][C]115.8[/C][C]116.711515151515[/C][C]-0.911515151515152[/C][/ROW]
[ROW][C]75[/C][C]127.8[/C][C]124.924675324675[/C][C]2.87532467532467[/C][/ROW]
[ROW][C]76[/C][C]118.8[/C][C]120.197229437229[/C][C]-1.39722943722944[/C][/ROW]
[ROW][C]77[/C][C]119.7[/C][C]118.224675324675[/C][C]1.47532467532468[/C][/ROW]
[ROW][C]78[/C][C]118.6[/C][C]121.281818181818[/C][C]-2.68181818181819[/C][/ROW]
[ROW][C]79[/C][C]120.8[/C][C]118.311515151515[/C][C]2.48848484848484[/C][/ROW]
[ROW][C]80[/C][C]115.9[/C][C]116.326926406926[/C][C]-0.426926406926401[/C][/ROW]
[ROW][C]81[/C][C]109.7[/C][C]120.568658008658[/C][C]-10.868658008658[/C][/ROW]
[ROW][C]82[/C][C]114.8[/C][C]121.254372294372[/C][C]-6.4543722943723[/C][/ROW]
[ROW][C]83[/C][C]116.2[/C][C]119.455497835498[/C][C]-3.25549783549783[/C][/ROW]
[ROW][C]84[/C][C]112.2[/C][C]117.398354978355[/C][C]-5.19835497835498[/C][/ROW]
[/TABLE]
Source: https://freestatistics.org/blog/index.php?pk=25688&T=4

Globally Unique Identifier (entire table): ba.freestatistics.org/blog/index.php?pk=25688&T=4

As an alternative you can also use a QR Code:  

The GUIDs for individual cells are displayed in the table below:

Multiple Linear Regression - Actuals, Interpolation, and Residuals
Time or IndexActualsInterpolationForecastResidualsPrediction Error
1101103.975324675325-2.97532467532478
298.793.09714285714295.60285714285715
3105.1110.818181818182-5.7181818181818
498.496.58285714285711.81714285714287
5101.7104.118181818182-2.41818181818184
6102.9107.175324675325-4.27532467532465
792.294.6971428571429-2.49714285714285
894.992.71255411255412.18744588744589
992.896.9542857142857-4.15428571428571
1098.597.640.860000000000004
1194.395.8411255411255-1.54112554112554
1287.493.7839826839827-6.38398268398268
13103.4106.326406926407-2.92640692640690
14101.2104.956103896104-3.7561038961039
15109.6113.169264069264-3.56926406926408
16111.9108.4418181818183.45818181818182
17108.9106.4692640692642.43073593073594
18105.6109.526406926407-3.92640692640693
19107.8106.5561038961041.2438961038961
2097.595.06363636363642.43636363636364
21102.4108.813246753247-6.41324675324675
22105.6109.498961038961-3.89896103896105
2399.898.19220779220781.60779220779221
2496.296.1350649350650.064935064935066
25113.1108.6774891774894.42251082251084
26107.4107.3071861471860.0928138528138628
27116.8115.5203463203461.27965367965368
28112.9110.7929004329002.10709956709957
29105.3108.820346320346-3.52034632034632
30109.3111.877489177489-2.57748917748918
31107.9108.907186147186-1.00718614718614
32101.1106.922597402597-5.82259740259741
33114.7111.1643290043293.53567099567100
34116.2111.8500432900434.34995670995671
35108.4110.051168831169-1.65116883116882
36113.4107.9940259740265.40597402597403
37108.7111.028571428571-2.32857142857141
38112.6109.6582683982682.9417316017316
39124.2117.8714285714296.32857142857143
40114.9113.1439826839831.75601731601732
41110.5111.171428571429-0.671428571428568
42121.5114.2285714285717.27142857142857
43118.1111.2582683982686.84173160173159
44111.7109.2736796536802.42632034632035
45132.7113.51541125541119.1845887445887
46119114.2011255411264.79887445887446
47116.7112.4022510822514.29774891774892
48120.1110.3451082251089.75489177489177
49113.4113.3796536796540.0203463203463458
50106.6112.009350649351-5.40935064935065
51116.3120.222510822511-3.92251082251083
52112.6115.495064935065-2.89506493506494
53111.6113.522510822511-1.92251082251082
54125.1116.5796536796548.52034632034632
55110.7113.609350649351-2.90935064935065
56109.6111.624761904762-2.02476190476191
57114.2115.866493506494-1.66649350649351
58113.4116.552207792208-3.15220779220779
59116114.7533333333331.24666666666667
60109.6112.696190476190-3.09619047619048
61117.8115.7307359307362.06926406926409
62115.8114.3604329004331.4395670995671
63125.3122.5735930735932.72640692640692
64113117.846147186147-4.84614718614719
65120.5115.8735930735934.62640692640693
66116.6118.930735930736-2.33073593073594
67111.8115.960432900433-4.16043290043290
68115.2113.9758441558441.22415584415585
69118.6118.2175757575760.382424242424234
70122.4118.903290043293.49670995670996
71116.4117.104415584416-0.704415584415578
72114.5115.047272727273-0.547272727272732
73119.8118.0818181818181.71818181818183
74115.8116.711515151515-0.911515151515152
75127.8124.9246753246752.87532467532467
76118.8120.197229437229-1.39722943722944
77119.7118.2246753246751.47532467532468
78118.6121.281818181818-2.68181818181819
79120.8118.3115151515152.48848484848484
80115.9116.326926406926-0.426926406926401
81109.7120.568658008658-10.868658008658
82114.8121.254372294372-6.4543722943723
83116.2119.455497835498-3.25549783549783
84112.2117.398354978355-5.19835497835498


Parameters (Session):
par1 = 1 ; par2 = Include Monthly Dummies ; par3 = Linear Trend ;
Parameters (R input):
par1 = 1 ; par2 = Include Monthly Dummies ; par3 = Linear Trend ;
R code (references can be found in the software module):
library(lattice)
par1 <- as.numeric(par1)
x <- t(y)
k <- length(x[1,])
n <- length(x[,1])
x1 <- cbind(x[,par1], x[,1:k!=par1])
mycolnames <- c(colnames(x)[par1], colnames(x)[1:k!=par1])
colnames(x1) <- mycolnames #colnames(x)[par1]
x <- x1
if (par3 == 'First Differences'){
x2 <- array(0, dim=c(n-1,k), dimnames=list(1:(n-1), paste('(1-B)',colnames(x),sep='')))
for (i in 1:n-1) {
for (j in 1:k) {
x2[i,j] <- x[i+1,j] - x[i,j]
}
}
x <- x2
}
if (par2 == 'Include Monthly Dummies'){
x2 <- array(0, dim=c(n,11), dimnames=list(1:n, paste('M', seq(1:11), sep ='')))
for (i in 1:11){
x2[seq(i,n,12),i] <- 1
}
x <- cbind(x, x2)
}
if (par2 == 'Include Quarterly Dummies'){
x2 <- array(0, dim=c(n,3), dimnames=list(1:n, paste('Q', seq(1:3), sep ='')))
for (i in 1:3){
x2[seq(i,n,4),i] <- 1
}
x <- cbind(x, x2)
}
k <- length(x[1,])
if (par3 == 'Linear Trend'){
x <- cbind(x, c(1:n))
colnames(x)[k+1] <- 't'
}
x
k <- length(x[1,])
df <- as.data.frame(x)
(mylm <- lm(df))
(mysum <- summary(mylm))
bitmap(file='test0.png')
plot(x[,1], type='l', main='Actuals and Interpolation', ylab='value of Actuals and Interpolation (dots)', xlab='time or index')
points(x[,1]-mysum$resid)
grid()
dev.off()
bitmap(file='test1.png')
plot(mysum$resid, type='b', pch=19, main='Residuals', ylab='value of Residuals', xlab='time or index')
grid()
dev.off()
bitmap(file='test2.png')
hist(mysum$resid, main='Residual Histogram', xlab='values of Residuals')
grid()
dev.off()
bitmap(file='test3.png')
densityplot(~mysum$resid,col='black',main='Residual Density Plot', xlab='values of Residuals')
dev.off()
bitmap(file='test4.png')
qqnorm(mysum$resid, main='Residual Normal Q-Q Plot')
grid()
dev.off()
(myerror <- as.ts(mysum$resid))
bitmap(file='test5.png')
dum <- cbind(lag(myerror,k=1),myerror)
dum
dum1 <- dum[2:length(myerror),]
dum1
z <- as.data.frame(dum1)
z
plot(z,main=paste('Residual Lag plot, lowess, and regression line'), ylab='values of Residuals', xlab='lagged values of Residuals')
lines(lowess(z))
abline(lm(z))
grid()
dev.off()
bitmap(file='test6.png')
acf(mysum$resid, lag.max=length(mysum$resid)/2, main='Residual Autocorrelation Function')
grid()
dev.off()
bitmap(file='test7.png')
pacf(mysum$resid, lag.max=length(mysum$resid)/2, main='Residual Partial Autocorrelation Function')
grid()
dev.off()
bitmap(file='test8.png')
opar <- par(mfrow = c(2,2), oma = c(0, 0, 1.1, 0))
plot(mylm, las = 1, sub='Residual Diagnostics')
par(opar)
dev.off()
load(file='createtable')
a<-table.start()
a<-table.row.start(a)
a<-table.element(a, 'Multiple Linear Regression - Estimated Regression Equation', 1, TRUE)
a<-table.row.end(a)
myeq <- colnames(x)[1]
myeq <- paste(myeq, '[t] = ', sep='')
for (i in 1:k){
if (mysum$coefficients[i,1] > 0) myeq <- paste(myeq, '+', '')
myeq <- paste(myeq, mysum$coefficients[i,1], sep=' ')
if (rownames(mysum$coefficients)[i] != '(Intercept)') {
myeq <- paste(myeq, rownames(mysum$coefficients)[i], sep='')
if (rownames(mysum$coefficients)[i] != 't') myeq <- paste(myeq, '[t]', sep='')
}
}
myeq <- paste(myeq, ' + e[t]')
a<-table.row.start(a)
a<-table.element(a, myeq)
a<-table.row.end(a)
a<-table.end(a)
table.save(a,file='mytable1.tab')
a<-table.start()
a<-table.row.start(a)
a<-table.element(a,hyperlink('ols1.htm','Multiple Linear Regression - Ordinary Least Squares',''), 6, TRUE)
a<-table.row.end(a)
a<-table.row.start(a)
a<-table.element(a,'Variable',header=TRUE)
a<-table.element(a,'Parameter',header=TRUE)
a<-table.element(a,'S.D.',header=TRUE)
a<-table.element(a,'T-STAT
H0: parameter = 0',header=TRUE)
a<-table.element(a,'2-tail p-value',header=TRUE)
a<-table.element(a,'1-tail p-value',header=TRUE)
a<-table.row.end(a)
for (i in 1:k){
a<-table.row.start(a)
a<-table.element(a,rownames(mysum$coefficients)[i],header=TRUE)
a<-table.element(a,mysum$coefficients[i,1])
a<-table.element(a, round(mysum$coefficients[i,2],6))
a<-table.element(a, round(mysum$coefficients[i,3],4))
a<-table.element(a, round(mysum$coefficients[i,4],6))
a<-table.element(a, round(mysum$coefficients[i,4]/2,6))
a<-table.row.end(a)
}
a<-table.end(a)
table.save(a,file='mytable2.tab')
a<-table.start()
a<-table.row.start(a)
a<-table.element(a, 'Multiple Linear Regression - Regression Statistics', 2, TRUE)
a<-table.row.end(a)
a<-table.row.start(a)
a<-table.element(a, 'Multiple R',1,TRUE)
a<-table.element(a, sqrt(mysum$r.squared))
a<-table.row.end(a)
a<-table.row.start(a)
a<-table.element(a, 'R-squared',1,TRUE)
a<-table.element(a, mysum$r.squared)
a<-table.row.end(a)
a<-table.row.start(a)
a<-table.element(a, 'Adjusted R-squared',1,TRUE)
a<-table.element(a, mysum$adj.r.squared)
a<-table.row.end(a)
a<-table.row.start(a)
a<-table.element(a, 'F-TEST (value)',1,TRUE)
a<-table.element(a, mysum$fstatistic[1])
a<-table.row.end(a)
a<-table.row.start(a)
a<-table.element(a, 'F-TEST (DF numerator)',1,TRUE)
a<-table.element(a, mysum$fstatistic[2])
a<-table.row.end(a)
a<-table.row.start(a)
a<-table.element(a, 'F-TEST (DF denominator)',1,TRUE)
a<-table.element(a, mysum$fstatistic[3])
a<-table.row.end(a)
a<-table.row.start(a)
a<-table.element(a, 'p-value',1,TRUE)
a<-table.element(a, 1-pf(mysum$fstatistic[1],mysum$fstatistic[2],mysum$fstatistic[3]))
a<-table.row.end(a)
a<-table.row.start(a)
a<-table.element(a, 'Multiple Linear Regression - Residual Statistics', 2, TRUE)
a<-table.row.end(a)
a<-table.row.start(a)
a<-table.element(a, 'Residual Standard Deviation',1,TRUE)
a<-table.element(a, mysum$sigma)
a<-table.row.end(a)
a<-table.row.start(a)
a<-table.element(a, 'Sum Squared Residuals',1,TRUE)
a<-table.element(a, sum(myerror*myerror))
a<-table.row.end(a)
a<-table.end(a)
table.save(a,file='mytable3.tab')
a<-table.start()
a<-table.row.start(a)
a<-table.element(a, 'Multiple Linear Regression - Actuals, Interpolation, and Residuals', 4, TRUE)
a<-table.row.end(a)
a<-table.row.start(a)
a<-table.element(a, 'Time or Index', 1, TRUE)
a<-table.element(a, 'Actuals', 1, TRUE)
a<-table.element(a, 'Interpolation
Forecast', 1, TRUE)
a<-table.element(a, 'Residuals
Prediction Error', 1, TRUE)
a<-table.row.end(a)
for (i in 1:n) {
a<-table.row.start(a)
a<-table.element(a,i, 1, TRUE)
a<-table.element(a,x[i])
a<-table.element(a,x[i]-mysum$resid[i])
a<-table.element(a,mysum$resid[i])
a<-table.row.end(a)
}
a<-table.end(a)
table.save(a,file='mytable4.tab')