Free Statistics

of Irreproducible Research!

Author's title

Author*The author of this computation has been verified*
R Software Modulerwasp_multipleregression.wasp
Title produced by softwareMultiple Regression
Date of computationTue, 25 Nov 2008 09:51:19 -0700
Cite this page as followsStatistical Computations at FreeStatistics.org, Office for Research Development and Education, URL https://freestatistics.org/blog/index.php?v=date/2008/Nov/25/t1227632536hjqrhpji41c0xut.htm/, Retrieved Thu, 09 May 2024 09:40:00 +0000
Statistical Computations at FreeStatistics.org, Office for Research Development and Education, URL https://freestatistics.org/blog/index.php?pk=25591, Retrieved Thu, 09 May 2024 09:40:00 +0000
QR Codes:

Original text written by user:
IsPrivate?No (this computation is public)
User-defined keywords
Estimated Impact179
Family? (F = Feedback message, R = changed R code, M = changed R Module, P = changed Parameters, D = changed Data)
F       [Multiple Regression] [SeatbeltlawQ3Geof...] [2008-11-25 16:51:19] [c04cf09058bb6459559bb5d5f71f8469] [Current]
Feedback Forum
2008-11-28 12:52:32 [407693b66d7f2e0b350979005057872d] [reply
Dit was een vraag waarbij je een eigen datareeks moest zoeken. Alle grafieken zijn gedetailleerd besproken. Dit antwoord is correct
2008-12-01 15:27:58 [Nicolaj Wuyts] [reply
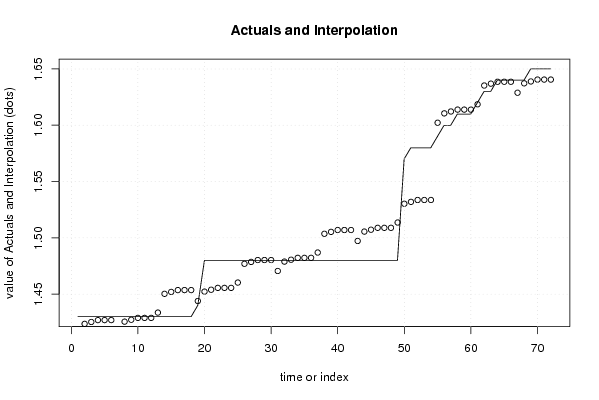
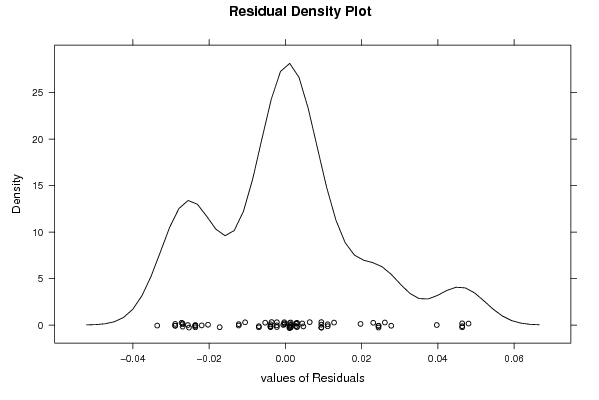
Als we kijken naar de broddprijs voor het afschaffen van de plafondprijs, zien we dat deze gelijk is aan 1,40. Na het afschaffen van de plafondprijs stijgt de broodprijs gemiddeld met 8 cent per maand. We zien dat februari de maand is waar de grootste prijsstijgingen worden doorgevoerd. Wanneer we echter kijken naar de two-tailed hypothese, de broodprijs kan zowel stijgen als dalen, zien we dat de alpha-fout niet significant verschillend is van nul. De prijsstijging(en) zou(den) dus te wijten kunnen zijn aan het toeval. Wanneer we kijken naar het residuals histogram zien we ook dat deze geen normaalverdeling vertoond, wat ook bevestigd wordt de Residual density plot.
2008-12-01 17:19:51 [Loïque Verhasselt] [reply
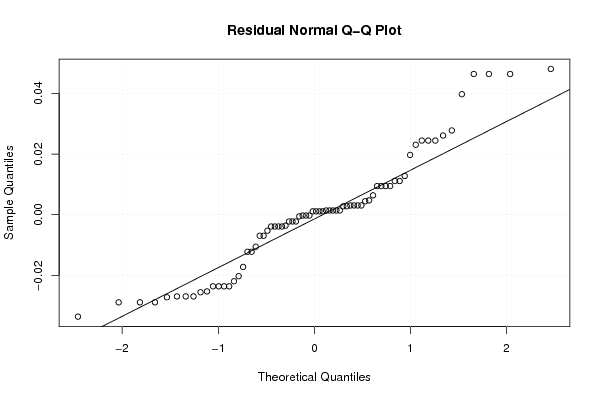
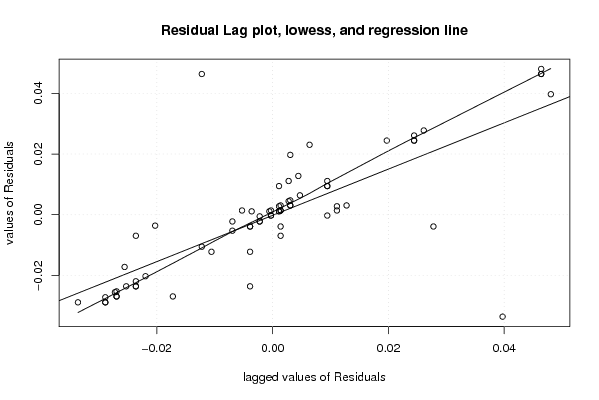
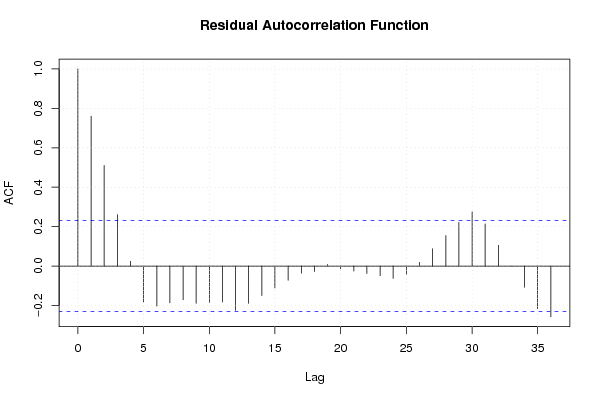
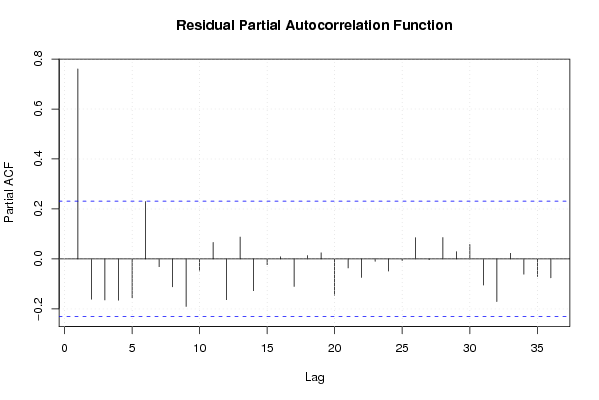
Q3: We vinden de juiste tabellen om het geheel te beantwoorden. Maar de juiste interpretatie ontbreekt soms. Hier een aanvulling.R-squared staat voor hoeveel % er wordt verklaard door variabiliteit/door spreiding van het aantal verkeersslachtoffers. De p-value is hier 0 wat wil zeggen dat die 94% significant verschilt. Door te kijken naar de 1-tailed p-value omdat we de reden van de gebeurtenis op voorhand wisten.(hier de invoering van een vrije prijszetting van brood). Hieraan zien we dat er geen sprake is van seizoenaliteit doordat geen enkele van de p-waarden kleiner is dan de vooropgestelde alpha-fout van 5%. We zien bij het histogram en het density een iets of wat normale verdeling, we kunnen ons hierover niet echt uitspreken. Hetzelfde voor het QQ plot, ze sluiten redelijk goed aan bij de rechte.We vinden geen residuals function om autocorrelatie te detecteren. Ook geen lag plot. Dit is nodig voor de interpretatie.

Post a new message
Dataseries X:
1.43	0
1.43	0
1.43	0
1.43	0
1.43	0
1.43	0
1.43	0
1.43	0
1.43	0
1.43	0
1.43	0
1.43	0
1.43	0
1.43	0
1.43	0
1.43	0
1.43	0
1.43	0
1.44	0
1.48	0
1.48	0
1.48	0
1.48	0
1.48	0
1.48	0
1.48	0
1.48	0
1.48	0
1.48	0
1.48	0
1.48	0
1.48	0
1.48	0
1.48	0
1.48	0
1.48	0
1.48	0
1.48	0
1.48	0
1.48	0
1.48	0
1.48	0
1.48	0
1.48	0
1.48	0
1.48	0
1.48	0
1.48	0
1.48	0
1.57	0
1.58	0
1.58	0
1.58	0
1.58	0
1.59	1
1.6	1
1.6	1
1.61	1
1.61	1
1.61	1
1.62	1
1.63	1
1.63	1
1.64	1
1.64	1
1.64	1
1.64	1
1.64	1
1.65	1
1.65	1
1.65	1
1.65	1


Summary of computational transaction
Raw Inputview raw input (R code)
Raw Outputview raw output of R engine
Computing time4 seconds
R Server'Gwilym Jenkins' @ 72.249.127.135

\begin{tabular}{lllllllll}
\hline
Summary of computational transaction \tabularnewline
Raw Input & view raw input (R code)  \tabularnewline
Raw Output & view raw output of R engine  \tabularnewline
Computing time & 4 seconds \tabularnewline
R Server & 'Gwilym Jenkins' @ 72.249.127.135 \tabularnewline
\hline
\end{tabular}
%Source: https://freestatistics.org/blog/index.php?pk=25591&T=0

[TABLE]
[ROW][C]Summary of computational transaction[/C][/ROW]
[ROW][C]Raw Input[/C][C]view raw input (R code) [/C][/ROW]
[ROW][C]Raw Output[/C][C]view raw output of R engine [/C][/ROW]
[ROW][C]Computing time[/C][C]4 seconds[/C][/ROW]
[ROW][C]R Server[/C][C]'Gwilym Jenkins' @ 72.249.127.135[/C][/ROW]
[/TABLE]
Source: https://freestatistics.org/blog/index.php?pk=25591&T=0

Globally Unique Identifier (entire table): ba.freestatistics.org/blog/index.php?pk=25591&T=0

As an alternative you can also use a QR Code:  

The GUIDs for individual cells are displayed in the table below:

Summary of computational transaction
Raw Inputview raw input (R code)
Raw Outputview raw output of R engine
Computing time4 seconds
R Server'Gwilym Jenkins' @ 72.249.127.135


Multiple Linear Regression - Estimated Regression Equation
Y[t] = + 1.40222222222222 + 0.0783333333333335X[t] + 0.00250000000000066M1[t] + 0.0169444444444444M2[t] + 0.0163888888888888M3[t] + 0.0158333333333333M4[t] + 0.0136111111111111M5[t] + 0.0113888888888889M6[t] -0.000555555555555579M7[t] + 0.00555555555555554M8[t] + 0.00499999999999998M9[t] + 0.00444444444444443M10[t] + 0.00222222222222222M11[t] + 0.00222222222222222t + e[t]

\begin{tabular}{lllllllll}
\hline
Multiple Linear Regression - Estimated Regression Equation \tabularnewline
Y[t] =  +  1.40222222222222 +  0.0783333333333335X[t] +  0.00250000000000066M1[t] +  0.0169444444444444M2[t] +  0.0163888888888888M3[t] +  0.0158333333333333M4[t] +  0.0136111111111111M5[t] +  0.0113888888888889M6[t] -0.000555555555555579M7[t] +  0.00555555555555554M8[t] +  0.00499999999999998M9[t] +  0.00444444444444443M10[t] +  0.00222222222222222M11[t] +  0.00222222222222222t  + e[t] \tabularnewline
\hline
\end{tabular}
%Source: https://freestatistics.org/blog/index.php?pk=25591&T=1

[TABLE]
[ROW][C]Multiple Linear Regression - Estimated Regression Equation[/C][/ROW]
[ROW][C]Y[t] =  +  1.40222222222222 +  0.0783333333333335X[t] +  0.00250000000000066M1[t] +  0.0169444444444444M2[t] +  0.0163888888888888M3[t] +  0.0158333333333333M4[t] +  0.0136111111111111M5[t] +  0.0113888888888889M6[t] -0.000555555555555579M7[t] +  0.00555555555555554M8[t] +  0.00499999999999998M9[t] +  0.00444444444444443M10[t] +  0.00222222222222222M11[t] +  0.00222222222222222t  + e[t][/C][/ROW]
[/TABLE]
Source: https://freestatistics.org/blog/index.php?pk=25591&T=1

Globally Unique Identifier (entire table): ba.freestatistics.org/blog/index.php?pk=25591&T=1

As an alternative you can also use a QR Code:  

The GUIDs for individual cells are displayed in the table below:

Multiple Linear Regression - Estimated Regression Equation
Y[t] = + 1.40222222222222 + 0.0783333333333335X[t] + 0.00250000000000066M1[t] + 0.0169444444444444M2[t] + 0.0163888888888888M3[t] + 0.0158333333333333M4[t] + 0.0136111111111111M5[t] + 0.0113888888888889M6[t] -0.000555555555555579M7[t] + 0.00555555555555554M8[t] + 0.00499999999999998M9[t] + 0.00444444444444443M10[t] + 0.00222222222222222M11[t] + 0.00222222222222222t + e[t]


Multiple Linear Regression - Ordinary Least Squares
VariableParameterS.D.T-STATH0: parameter = 02-tail p-value1-tail p-value
(Intercept)1.402222222222220.010685131.237100
X0.07833333333333350.0090448.661100
M10.002500000000000660.0126040.19830.8434660.421733
M20.01694444444444440.0125911.34570.1836340.091817
M30.01638888888888880.0125821.30260.1978610.09893
M40.01583333333333330.0125751.25910.2130230.106512
M50.01361111111111110.0125711.08280.2833870.141693
M60.01138888888888890.0125690.90610.3686310.184316
M7-0.0005555555555555790.012564-0.04420.9648830.482441
M80.005555555555555540.0125510.44260.6596850.329843
M90.004999999999999980.0125420.39870.6915990.3458
M100.004444444444444430.0125350.35460.7241950.362098
M110.002222222222222220.012530.17730.8598540.429927
t0.002222222222222220.00018811.850400

\begin{tabular}{lllllllll}
\hline
Multiple Linear Regression - Ordinary Least Squares \tabularnewline
Variable & Parameter & S.D. & T-STATH0: parameter = 0 & 2-tail p-value & 1-tail p-value \tabularnewline
(Intercept) & 1.40222222222222 & 0.010685 & 131.2371 & 0 & 0 \tabularnewline
X & 0.0783333333333335 & 0.009044 & 8.6611 & 0 & 0 \tabularnewline
M1 & 0.00250000000000066 & 0.012604 & 0.1983 & 0.843466 & 0.421733 \tabularnewline
M2 & 0.0169444444444444 & 0.012591 & 1.3457 & 0.183634 & 0.091817 \tabularnewline
M3 & 0.0163888888888888 & 0.012582 & 1.3026 & 0.197861 & 0.09893 \tabularnewline
M4 & 0.0158333333333333 & 0.012575 & 1.2591 & 0.213023 & 0.106512 \tabularnewline
M5 & 0.0136111111111111 & 0.012571 & 1.0828 & 0.283387 & 0.141693 \tabularnewline
M6 & 0.0113888888888889 & 0.012569 & 0.9061 & 0.368631 & 0.184316 \tabularnewline
M7 & -0.000555555555555579 & 0.012564 & -0.0442 & 0.964883 & 0.482441 \tabularnewline
M8 & 0.00555555555555554 & 0.012551 & 0.4426 & 0.659685 & 0.329843 \tabularnewline
M9 & 0.00499999999999998 & 0.012542 & 0.3987 & 0.691599 & 0.3458 \tabularnewline
M10 & 0.00444444444444443 & 0.012535 & 0.3546 & 0.724195 & 0.362098 \tabularnewline
M11 & 0.00222222222222222 & 0.01253 & 0.1773 & 0.859854 & 0.429927 \tabularnewline
t & 0.00222222222222222 & 0.000188 & 11.8504 & 0 & 0 \tabularnewline
\hline
\end{tabular}
%Source: https://freestatistics.org/blog/index.php?pk=25591&T=2

[TABLE]
[ROW][C]Multiple Linear Regression - Ordinary Least Squares[/C][/ROW]
[ROW][C]Variable[/C][C]Parameter[/C][C]S.D.[/C][C]T-STATH0: parameter = 0[/C][C]2-tail p-value[/C][C]1-tail p-value[/C][/ROW]
[ROW][C](Intercept)[/C][C]1.40222222222222[/C][C]0.010685[/C][C]131.2371[/C][C]0[/C][C]0[/C][/ROW]
[ROW][C]X[/C][C]0.0783333333333335[/C][C]0.009044[/C][C]8.6611[/C][C]0[/C][C]0[/C][/ROW]
[ROW][C]M1[/C][C]0.00250000000000066[/C][C]0.012604[/C][C]0.1983[/C][C]0.843466[/C][C]0.421733[/C][/ROW]
[ROW][C]M2[/C][C]0.0169444444444444[/C][C]0.012591[/C][C]1.3457[/C][C]0.183634[/C][C]0.091817[/C][/ROW]
[ROW][C]M3[/C][C]0.0163888888888888[/C][C]0.012582[/C][C]1.3026[/C][C]0.197861[/C][C]0.09893[/C][/ROW]
[ROW][C]M4[/C][C]0.0158333333333333[/C][C]0.012575[/C][C]1.2591[/C][C]0.213023[/C][C]0.106512[/C][/ROW]
[ROW][C]M5[/C][C]0.0136111111111111[/C][C]0.012571[/C][C]1.0828[/C][C]0.283387[/C][C]0.141693[/C][/ROW]
[ROW][C]M6[/C][C]0.0113888888888889[/C][C]0.012569[/C][C]0.9061[/C][C]0.368631[/C][C]0.184316[/C][/ROW]
[ROW][C]M7[/C][C]-0.000555555555555579[/C][C]0.012564[/C][C]-0.0442[/C][C]0.964883[/C][C]0.482441[/C][/ROW]
[ROW][C]M8[/C][C]0.00555555555555554[/C][C]0.012551[/C][C]0.4426[/C][C]0.659685[/C][C]0.329843[/C][/ROW]
[ROW][C]M9[/C][C]0.00499999999999998[/C][C]0.012542[/C][C]0.3987[/C][C]0.691599[/C][C]0.3458[/C][/ROW]
[ROW][C]M10[/C][C]0.00444444444444443[/C][C]0.012535[/C][C]0.3546[/C][C]0.724195[/C][C]0.362098[/C][/ROW]
[ROW][C]M11[/C][C]0.00222222222222222[/C][C]0.01253[/C][C]0.1773[/C][C]0.859854[/C][C]0.429927[/C][/ROW]
[ROW][C]t[/C][C]0.00222222222222222[/C][C]0.000188[/C][C]11.8504[/C][C]0[/C][C]0[/C][/ROW]
[/TABLE]
Source: https://freestatistics.org/blog/index.php?pk=25591&T=2

Globally Unique Identifier (entire table): ba.freestatistics.org/blog/index.php?pk=25591&T=2

As an alternative you can also use a QR Code:  

The GUIDs for individual cells are displayed in the table below:

Multiple Linear Regression - Ordinary Least Squares
VariableParameterS.D.T-STATH0: parameter = 02-tail p-value1-tail p-value
(Intercept)1.402222222222220.010685131.237100
X0.07833333333333350.0090448.661100
M10.002500000000000660.0126040.19830.8434660.421733
M20.01694444444444440.0125911.34570.1836340.091817
M30.01638888888888880.0125821.30260.1978610.09893
M40.01583333333333330.0125751.25910.2130230.106512
M50.01361111111111110.0125711.08280.2833870.141693
M60.01138888888888890.0125690.90610.3686310.184316
M7-0.0005555555555555790.012564-0.04420.9648830.482441
M80.005555555555555540.0125510.44260.6596850.329843
M90.004999999999999980.0125420.39870.6915990.3458
M100.004444444444444430.0125350.35460.7241950.362098
M110.002222222222222220.012530.17730.8598540.429927
t0.002222222222222220.00018811.850400


Multiple Linear Regression - Regression Statistics
Multiple R0.96746207394789
R-squared0.935982864527553
Adjusted R-squared0.921634196232005
F-TEST (value)65.2313403061898
F-TEST (DF numerator)13
F-TEST (DF denominator)58
p-value0
Multiple Linear Regression - Residual Statistics
Residual Standard Deviation0.0217009013355194
Sum Squared Residuals0.0273138888888891

\begin{tabular}{lllllllll}
\hline
Multiple Linear Regression - Regression Statistics \tabularnewline
Multiple R & 0.96746207394789 \tabularnewline
R-squared & 0.935982864527553 \tabularnewline
Adjusted R-squared & 0.921634196232005 \tabularnewline
F-TEST (value) & 65.2313403061898 \tabularnewline
F-TEST (DF numerator) & 13 \tabularnewline
F-TEST (DF denominator) & 58 \tabularnewline
p-value & 0 \tabularnewline
Multiple Linear Regression - Residual Statistics \tabularnewline
Residual Standard Deviation & 0.0217009013355194 \tabularnewline
Sum Squared Residuals & 0.0273138888888891 \tabularnewline
\hline
\end{tabular}
%Source: https://freestatistics.org/blog/index.php?pk=25591&T=3

[TABLE]
[ROW][C]Multiple Linear Regression - Regression Statistics[/C][/ROW]
[ROW][C]Multiple R[/C][C]0.96746207394789[/C][/ROW]
[ROW][C]R-squared[/C][C]0.935982864527553[/C][/ROW]
[ROW][C]Adjusted R-squared[/C][C]0.921634196232005[/C][/ROW]
[ROW][C]F-TEST (value)[/C][C]65.2313403061898[/C][/ROW]
[ROW][C]F-TEST (DF numerator)[/C][C]13[/C][/ROW]
[ROW][C]F-TEST (DF denominator)[/C][C]58[/C][/ROW]
[ROW][C]p-value[/C][C]0[/C][/ROW]
[ROW][C]Multiple Linear Regression - Residual Statistics[/C][/ROW]
[ROW][C]Residual Standard Deviation[/C][C]0.0217009013355194[/C][/ROW]
[ROW][C]Sum Squared Residuals[/C][C]0.0273138888888891[/C][/ROW]
[/TABLE]
Source: https://freestatistics.org/blog/index.php?pk=25591&T=3

Globally Unique Identifier (entire table): ba.freestatistics.org/blog/index.php?pk=25591&T=3

As an alternative you can also use a QR Code:  

The GUIDs for individual cells are displayed in the table below:

Multiple Linear Regression - Regression Statistics
Multiple R0.96746207394789
R-squared0.935982864527553
Adjusted R-squared0.921634196232005
F-TEST (value)65.2313403061898
F-TEST (DF numerator)13
F-TEST (DF denominator)58
p-value0
Multiple Linear Regression - Residual Statistics
Residual Standard Deviation0.0217009013355194
Sum Squared Residuals0.0273138888888891


Multiple Linear Regression - Actuals, Interpolation, and Residuals
Time or IndexActualsInterpolationForecastResidualsPrediction Error
11.431.406944444444440.0230555555555585
21.431.423611111111110.00638888888888877
31.431.425277777777780.00472222222222195
41.431.426944444444440.00305555555555539
51.431.426944444444440.00305555555555547
61.431.426944444444440.0030555555555554
71.431.417222222222220.0127777777777777
81.431.425555555555560.0044444444444443
91.431.427222222222220.00277777777777762
101.431.428888888888890.00111111111111095
111.431.428888888888890.00111111111111097
121.431.428888888888890.00111111111111097
131.431.43361111111111-0.00361111111111185
141.431.45027777777778-0.0202777777777779
151.431.45194444444444-0.0219444444444445
161.431.45361111111111-0.0236111111111112
171.431.45361111111111-0.0236111111111112
181.431.45361111111111-0.0236111111111112
191.441.44388888888889-0.00388888888888897
201.481.452222222222220.0277777777777777
211.481.453888888888890.0261111111111111
221.481.455555555555560.0244444444444444
231.481.455555555555560.0244444444444444
241.481.455555555555560.0244444444444444
251.481.460277777777780.0197222222222216
261.481.476944444444440.00305555555555555
271.481.478611111111110.00138888888888892
281.481.48027777777778-0.000277777777777775
291.481.48027777777778-0.000277777777777789
301.481.48027777777778-0.000277777777777771
311.481.470555555555560.00944444444444446
321.481.478888888888890.00111111111111112
331.481.48055555555556-0.000555555555555545
341.481.48222222222222-0.00222222222222221
351.481.48222222222222-0.00222222222222222
361.481.48222222222222-0.00222222222222221
371.481.48694444444445-0.00694444444444504
381.481.50361111111111-0.0236111111111111
391.481.50527777777778-0.0252777777777777
401.481.50694444444444-0.0269444444444444
411.481.50694444444444-0.0269444444444444
421.481.50694444444444-0.0269444444444444
431.481.49722222222222-0.0172222222222221
441.481.50555555555556-0.0255555555555555
451.481.50722222222222-0.0272222222222221
461.481.50888888888889-0.0288888888888888
471.481.50888888888889-0.0288888888888888
481.481.50888888888889-0.0288888888888888
491.481.51361111111111-0.0336111111111116
501.571.530277777777780.0397222222222224
511.581.531944444444440.0480555555555558
521.581.533611111111110.0463888888888891
531.581.533611111111110.0463888888888891
541.581.533611111111110.0463888888888891
551.591.60222222222222-0.0122222222222221
561.61.61055555555556-0.0105555555555554
571.61.61222222222222-0.0122222222222221
581.611.61388888888889-0.00388888888888877
591.611.61388888888889-0.00388888888888877
601.611.61388888888889-0.00388888888888876
611.621.618611111111110.00138888888888843
621.631.63527777777778-0.00527777777777783
631.631.63694444444444-0.00694444444444445
641.641.638611111111110.00138888888888886
651.641.638611111111110.00138888888888886
661.641.638611111111110.00138888888888887
671.641.628888888888890.0111111111111111
681.641.637222222222220.00277777777777776
691.651.638888888888890.0111111111111111
701.651.640555555555560.00944444444444444
711.651.640555555555560.00944444444444445
721.651.640555555555560.00944444444444444

\begin{tabular}{lllllllll}
\hline
Multiple Linear Regression - Actuals, Interpolation, and Residuals \tabularnewline
Time or Index & Actuals & InterpolationForecast & ResidualsPrediction Error \tabularnewline
1 & 1.43 & 1.40694444444444 & 0.0230555555555585 \tabularnewline
2 & 1.43 & 1.42361111111111 & 0.00638888888888877 \tabularnewline
3 & 1.43 & 1.42527777777778 & 0.00472222222222195 \tabularnewline
4 & 1.43 & 1.42694444444444 & 0.00305555555555539 \tabularnewline
5 & 1.43 & 1.42694444444444 & 0.00305555555555547 \tabularnewline
6 & 1.43 & 1.42694444444444 & 0.0030555555555554 \tabularnewline
7 & 1.43 & 1.41722222222222 & 0.0127777777777777 \tabularnewline
8 & 1.43 & 1.42555555555556 & 0.0044444444444443 \tabularnewline
9 & 1.43 & 1.42722222222222 & 0.00277777777777762 \tabularnewline
10 & 1.43 & 1.42888888888889 & 0.00111111111111095 \tabularnewline
11 & 1.43 & 1.42888888888889 & 0.00111111111111097 \tabularnewline
12 & 1.43 & 1.42888888888889 & 0.00111111111111097 \tabularnewline
13 & 1.43 & 1.43361111111111 & -0.00361111111111185 \tabularnewline
14 & 1.43 & 1.45027777777778 & -0.0202777777777779 \tabularnewline
15 & 1.43 & 1.45194444444444 & -0.0219444444444445 \tabularnewline
16 & 1.43 & 1.45361111111111 & -0.0236111111111112 \tabularnewline
17 & 1.43 & 1.45361111111111 & -0.0236111111111112 \tabularnewline
18 & 1.43 & 1.45361111111111 & -0.0236111111111112 \tabularnewline
19 & 1.44 & 1.44388888888889 & -0.00388888888888897 \tabularnewline
20 & 1.48 & 1.45222222222222 & 0.0277777777777777 \tabularnewline
21 & 1.48 & 1.45388888888889 & 0.0261111111111111 \tabularnewline
22 & 1.48 & 1.45555555555556 & 0.0244444444444444 \tabularnewline
23 & 1.48 & 1.45555555555556 & 0.0244444444444444 \tabularnewline
24 & 1.48 & 1.45555555555556 & 0.0244444444444444 \tabularnewline
25 & 1.48 & 1.46027777777778 & 0.0197222222222216 \tabularnewline
26 & 1.48 & 1.47694444444444 & 0.00305555555555555 \tabularnewline
27 & 1.48 & 1.47861111111111 & 0.00138888888888892 \tabularnewline
28 & 1.48 & 1.48027777777778 & -0.000277777777777775 \tabularnewline
29 & 1.48 & 1.48027777777778 & -0.000277777777777789 \tabularnewline
30 & 1.48 & 1.48027777777778 & -0.000277777777777771 \tabularnewline
31 & 1.48 & 1.47055555555556 & 0.00944444444444446 \tabularnewline
32 & 1.48 & 1.47888888888889 & 0.00111111111111112 \tabularnewline
33 & 1.48 & 1.48055555555556 & -0.000555555555555545 \tabularnewline
34 & 1.48 & 1.48222222222222 & -0.00222222222222221 \tabularnewline
35 & 1.48 & 1.48222222222222 & -0.00222222222222222 \tabularnewline
36 & 1.48 & 1.48222222222222 & -0.00222222222222221 \tabularnewline
37 & 1.48 & 1.48694444444445 & -0.00694444444444504 \tabularnewline
38 & 1.48 & 1.50361111111111 & -0.0236111111111111 \tabularnewline
39 & 1.48 & 1.50527777777778 & -0.0252777777777777 \tabularnewline
40 & 1.48 & 1.50694444444444 & -0.0269444444444444 \tabularnewline
41 & 1.48 & 1.50694444444444 & -0.0269444444444444 \tabularnewline
42 & 1.48 & 1.50694444444444 & -0.0269444444444444 \tabularnewline
43 & 1.48 & 1.49722222222222 & -0.0172222222222221 \tabularnewline
44 & 1.48 & 1.50555555555556 & -0.0255555555555555 \tabularnewline
45 & 1.48 & 1.50722222222222 & -0.0272222222222221 \tabularnewline
46 & 1.48 & 1.50888888888889 & -0.0288888888888888 \tabularnewline
47 & 1.48 & 1.50888888888889 & -0.0288888888888888 \tabularnewline
48 & 1.48 & 1.50888888888889 & -0.0288888888888888 \tabularnewline
49 & 1.48 & 1.51361111111111 & -0.0336111111111116 \tabularnewline
50 & 1.57 & 1.53027777777778 & 0.0397222222222224 \tabularnewline
51 & 1.58 & 1.53194444444444 & 0.0480555555555558 \tabularnewline
52 & 1.58 & 1.53361111111111 & 0.0463888888888891 \tabularnewline
53 & 1.58 & 1.53361111111111 & 0.0463888888888891 \tabularnewline
54 & 1.58 & 1.53361111111111 & 0.0463888888888891 \tabularnewline
55 & 1.59 & 1.60222222222222 & -0.0122222222222221 \tabularnewline
56 & 1.6 & 1.61055555555556 & -0.0105555555555554 \tabularnewline
57 & 1.6 & 1.61222222222222 & -0.0122222222222221 \tabularnewline
58 & 1.61 & 1.61388888888889 & -0.00388888888888877 \tabularnewline
59 & 1.61 & 1.61388888888889 & -0.00388888888888877 \tabularnewline
60 & 1.61 & 1.61388888888889 & -0.00388888888888876 \tabularnewline
61 & 1.62 & 1.61861111111111 & 0.00138888888888843 \tabularnewline
62 & 1.63 & 1.63527777777778 & -0.00527777777777783 \tabularnewline
63 & 1.63 & 1.63694444444444 & -0.00694444444444445 \tabularnewline
64 & 1.64 & 1.63861111111111 & 0.00138888888888886 \tabularnewline
65 & 1.64 & 1.63861111111111 & 0.00138888888888886 \tabularnewline
66 & 1.64 & 1.63861111111111 & 0.00138888888888887 \tabularnewline
67 & 1.64 & 1.62888888888889 & 0.0111111111111111 \tabularnewline
68 & 1.64 & 1.63722222222222 & 0.00277777777777776 \tabularnewline
69 & 1.65 & 1.63888888888889 & 0.0111111111111111 \tabularnewline
70 & 1.65 & 1.64055555555556 & 0.00944444444444444 \tabularnewline
71 & 1.65 & 1.64055555555556 & 0.00944444444444445 \tabularnewline
72 & 1.65 & 1.64055555555556 & 0.00944444444444444 \tabularnewline
\hline
\end{tabular}
%Source: https://freestatistics.org/blog/index.php?pk=25591&T=4

[TABLE]
[ROW][C]Multiple Linear Regression - Actuals, Interpolation, and Residuals[/C][/ROW]
[ROW][C]Time or Index[/C][C]Actuals[/C][C]InterpolationForecast[/C][C]ResidualsPrediction Error[/C][/ROW]
[ROW][C]1[/C][C]1.43[/C][C]1.40694444444444[/C][C]0.0230555555555585[/C][/ROW]
[ROW][C]2[/C][C]1.43[/C][C]1.42361111111111[/C][C]0.00638888888888877[/C][/ROW]
[ROW][C]3[/C][C]1.43[/C][C]1.42527777777778[/C][C]0.00472222222222195[/C][/ROW]
[ROW][C]4[/C][C]1.43[/C][C]1.42694444444444[/C][C]0.00305555555555539[/C][/ROW]
[ROW][C]5[/C][C]1.43[/C][C]1.42694444444444[/C][C]0.00305555555555547[/C][/ROW]
[ROW][C]6[/C][C]1.43[/C][C]1.42694444444444[/C][C]0.0030555555555554[/C][/ROW]
[ROW][C]7[/C][C]1.43[/C][C]1.41722222222222[/C][C]0.0127777777777777[/C][/ROW]
[ROW][C]8[/C][C]1.43[/C][C]1.42555555555556[/C][C]0.0044444444444443[/C][/ROW]
[ROW][C]9[/C][C]1.43[/C][C]1.42722222222222[/C][C]0.00277777777777762[/C][/ROW]
[ROW][C]10[/C][C]1.43[/C][C]1.42888888888889[/C][C]0.00111111111111095[/C][/ROW]
[ROW][C]11[/C][C]1.43[/C][C]1.42888888888889[/C][C]0.00111111111111097[/C][/ROW]
[ROW][C]12[/C][C]1.43[/C][C]1.42888888888889[/C][C]0.00111111111111097[/C][/ROW]
[ROW][C]13[/C][C]1.43[/C][C]1.43361111111111[/C][C]-0.00361111111111185[/C][/ROW]
[ROW][C]14[/C][C]1.43[/C][C]1.45027777777778[/C][C]-0.0202777777777779[/C][/ROW]
[ROW][C]15[/C][C]1.43[/C][C]1.45194444444444[/C][C]-0.0219444444444445[/C][/ROW]
[ROW][C]16[/C][C]1.43[/C][C]1.45361111111111[/C][C]-0.0236111111111112[/C][/ROW]
[ROW][C]17[/C][C]1.43[/C][C]1.45361111111111[/C][C]-0.0236111111111112[/C][/ROW]
[ROW][C]18[/C][C]1.43[/C][C]1.45361111111111[/C][C]-0.0236111111111112[/C][/ROW]
[ROW][C]19[/C][C]1.44[/C][C]1.44388888888889[/C][C]-0.00388888888888897[/C][/ROW]
[ROW][C]20[/C][C]1.48[/C][C]1.45222222222222[/C][C]0.0277777777777777[/C][/ROW]
[ROW][C]21[/C][C]1.48[/C][C]1.45388888888889[/C][C]0.0261111111111111[/C][/ROW]
[ROW][C]22[/C][C]1.48[/C][C]1.45555555555556[/C][C]0.0244444444444444[/C][/ROW]
[ROW][C]23[/C][C]1.48[/C][C]1.45555555555556[/C][C]0.0244444444444444[/C][/ROW]
[ROW][C]24[/C][C]1.48[/C][C]1.45555555555556[/C][C]0.0244444444444444[/C][/ROW]
[ROW][C]25[/C][C]1.48[/C][C]1.46027777777778[/C][C]0.0197222222222216[/C][/ROW]
[ROW][C]26[/C][C]1.48[/C][C]1.47694444444444[/C][C]0.00305555555555555[/C][/ROW]
[ROW][C]27[/C][C]1.48[/C][C]1.47861111111111[/C][C]0.00138888888888892[/C][/ROW]
[ROW][C]28[/C][C]1.48[/C][C]1.48027777777778[/C][C]-0.000277777777777775[/C][/ROW]
[ROW][C]29[/C][C]1.48[/C][C]1.48027777777778[/C][C]-0.000277777777777789[/C][/ROW]
[ROW][C]30[/C][C]1.48[/C][C]1.48027777777778[/C][C]-0.000277777777777771[/C][/ROW]
[ROW][C]31[/C][C]1.48[/C][C]1.47055555555556[/C][C]0.00944444444444446[/C][/ROW]
[ROW][C]32[/C][C]1.48[/C][C]1.47888888888889[/C][C]0.00111111111111112[/C][/ROW]
[ROW][C]33[/C][C]1.48[/C][C]1.48055555555556[/C][C]-0.000555555555555545[/C][/ROW]
[ROW][C]34[/C][C]1.48[/C][C]1.48222222222222[/C][C]-0.00222222222222221[/C][/ROW]
[ROW][C]35[/C][C]1.48[/C][C]1.48222222222222[/C][C]-0.00222222222222222[/C][/ROW]
[ROW][C]36[/C][C]1.48[/C][C]1.48222222222222[/C][C]-0.00222222222222221[/C][/ROW]
[ROW][C]37[/C][C]1.48[/C][C]1.48694444444445[/C][C]-0.00694444444444504[/C][/ROW]
[ROW][C]38[/C][C]1.48[/C][C]1.50361111111111[/C][C]-0.0236111111111111[/C][/ROW]
[ROW][C]39[/C][C]1.48[/C][C]1.50527777777778[/C][C]-0.0252777777777777[/C][/ROW]
[ROW][C]40[/C][C]1.48[/C][C]1.50694444444444[/C][C]-0.0269444444444444[/C][/ROW]
[ROW][C]41[/C][C]1.48[/C][C]1.50694444444444[/C][C]-0.0269444444444444[/C][/ROW]
[ROW][C]42[/C][C]1.48[/C][C]1.50694444444444[/C][C]-0.0269444444444444[/C][/ROW]
[ROW][C]43[/C][C]1.48[/C][C]1.49722222222222[/C][C]-0.0172222222222221[/C][/ROW]
[ROW][C]44[/C][C]1.48[/C][C]1.50555555555556[/C][C]-0.0255555555555555[/C][/ROW]
[ROW][C]45[/C][C]1.48[/C][C]1.50722222222222[/C][C]-0.0272222222222221[/C][/ROW]
[ROW][C]46[/C][C]1.48[/C][C]1.50888888888889[/C][C]-0.0288888888888888[/C][/ROW]
[ROW][C]47[/C][C]1.48[/C][C]1.50888888888889[/C][C]-0.0288888888888888[/C][/ROW]
[ROW][C]48[/C][C]1.48[/C][C]1.50888888888889[/C][C]-0.0288888888888888[/C][/ROW]
[ROW][C]49[/C][C]1.48[/C][C]1.51361111111111[/C][C]-0.0336111111111116[/C][/ROW]
[ROW][C]50[/C][C]1.57[/C][C]1.53027777777778[/C][C]0.0397222222222224[/C][/ROW]
[ROW][C]51[/C][C]1.58[/C][C]1.53194444444444[/C][C]0.0480555555555558[/C][/ROW]
[ROW][C]52[/C][C]1.58[/C][C]1.53361111111111[/C][C]0.0463888888888891[/C][/ROW]
[ROW][C]53[/C][C]1.58[/C][C]1.53361111111111[/C][C]0.0463888888888891[/C][/ROW]
[ROW][C]54[/C][C]1.58[/C][C]1.53361111111111[/C][C]0.0463888888888891[/C][/ROW]
[ROW][C]55[/C][C]1.59[/C][C]1.60222222222222[/C][C]-0.0122222222222221[/C][/ROW]
[ROW][C]56[/C][C]1.6[/C][C]1.61055555555556[/C][C]-0.0105555555555554[/C][/ROW]
[ROW][C]57[/C][C]1.6[/C][C]1.61222222222222[/C][C]-0.0122222222222221[/C][/ROW]
[ROW][C]58[/C][C]1.61[/C][C]1.61388888888889[/C][C]-0.00388888888888877[/C][/ROW]
[ROW][C]59[/C][C]1.61[/C][C]1.61388888888889[/C][C]-0.00388888888888877[/C][/ROW]
[ROW][C]60[/C][C]1.61[/C][C]1.61388888888889[/C][C]-0.00388888888888876[/C][/ROW]
[ROW][C]61[/C][C]1.62[/C][C]1.61861111111111[/C][C]0.00138888888888843[/C][/ROW]
[ROW][C]62[/C][C]1.63[/C][C]1.63527777777778[/C][C]-0.00527777777777783[/C][/ROW]
[ROW][C]63[/C][C]1.63[/C][C]1.63694444444444[/C][C]-0.00694444444444445[/C][/ROW]
[ROW][C]64[/C][C]1.64[/C][C]1.63861111111111[/C][C]0.00138888888888886[/C][/ROW]
[ROW][C]65[/C][C]1.64[/C][C]1.63861111111111[/C][C]0.00138888888888886[/C][/ROW]
[ROW][C]66[/C][C]1.64[/C][C]1.63861111111111[/C][C]0.00138888888888887[/C][/ROW]
[ROW][C]67[/C][C]1.64[/C][C]1.62888888888889[/C][C]0.0111111111111111[/C][/ROW]
[ROW][C]68[/C][C]1.64[/C][C]1.63722222222222[/C][C]0.00277777777777776[/C][/ROW]
[ROW][C]69[/C][C]1.65[/C][C]1.63888888888889[/C][C]0.0111111111111111[/C][/ROW]
[ROW][C]70[/C][C]1.65[/C][C]1.64055555555556[/C][C]0.00944444444444444[/C][/ROW]
[ROW][C]71[/C][C]1.65[/C][C]1.64055555555556[/C][C]0.00944444444444445[/C][/ROW]
[ROW][C]72[/C][C]1.65[/C][C]1.64055555555556[/C][C]0.00944444444444444[/C][/ROW]
[/TABLE]
Source: https://freestatistics.org/blog/index.php?pk=25591&T=4

Globally Unique Identifier (entire table): ba.freestatistics.org/blog/index.php?pk=25591&T=4

As an alternative you can also use a QR Code:  

The GUIDs for individual cells are displayed in the table below:

Multiple Linear Regression - Actuals, Interpolation, and Residuals
Time or IndexActualsInterpolationForecastResidualsPrediction Error
11.431.406944444444440.0230555555555585
21.431.423611111111110.00638888888888877
31.431.425277777777780.00472222222222195
41.431.426944444444440.00305555555555539
51.431.426944444444440.00305555555555547
61.431.426944444444440.0030555555555554
71.431.417222222222220.0127777777777777
81.431.425555555555560.0044444444444443
91.431.427222222222220.00277777777777762
101.431.428888888888890.00111111111111095
111.431.428888888888890.00111111111111097
121.431.428888888888890.00111111111111097
131.431.43361111111111-0.00361111111111185
141.431.45027777777778-0.0202777777777779
151.431.45194444444444-0.0219444444444445
161.431.45361111111111-0.0236111111111112
171.431.45361111111111-0.0236111111111112
181.431.45361111111111-0.0236111111111112
191.441.44388888888889-0.00388888888888897
201.481.452222222222220.0277777777777777
211.481.453888888888890.0261111111111111
221.481.455555555555560.0244444444444444
231.481.455555555555560.0244444444444444
241.481.455555555555560.0244444444444444
251.481.460277777777780.0197222222222216
261.481.476944444444440.00305555555555555
271.481.478611111111110.00138888888888892
281.481.48027777777778-0.000277777777777775
291.481.48027777777778-0.000277777777777789
301.481.48027777777778-0.000277777777777771
311.481.470555555555560.00944444444444446
321.481.478888888888890.00111111111111112
331.481.48055555555556-0.000555555555555545
341.481.48222222222222-0.00222222222222221
351.481.48222222222222-0.00222222222222222
361.481.48222222222222-0.00222222222222221
371.481.48694444444445-0.00694444444444504
381.481.50361111111111-0.0236111111111111
391.481.50527777777778-0.0252777777777777
401.481.50694444444444-0.0269444444444444
411.481.50694444444444-0.0269444444444444
421.481.50694444444444-0.0269444444444444
431.481.49722222222222-0.0172222222222221
441.481.50555555555556-0.0255555555555555
451.481.50722222222222-0.0272222222222221
461.481.50888888888889-0.0288888888888888
471.481.50888888888889-0.0288888888888888
481.481.50888888888889-0.0288888888888888
491.481.51361111111111-0.0336111111111116
501.571.530277777777780.0397222222222224
511.581.531944444444440.0480555555555558
521.581.533611111111110.0463888888888891
531.581.533611111111110.0463888888888891
541.581.533611111111110.0463888888888891
551.591.60222222222222-0.0122222222222221
561.61.61055555555556-0.0105555555555554
571.61.61222222222222-0.0122222222222221
581.611.61388888888889-0.00388888888888877
591.611.61388888888889-0.00388888888888877
601.611.61388888888889-0.00388888888888876
611.621.618611111111110.00138888888888843
621.631.63527777777778-0.00527777777777783
631.631.63694444444444-0.00694444444444445
641.641.638611111111110.00138888888888886
651.641.638611111111110.00138888888888886
661.641.638611111111110.00138888888888887
671.641.628888888888890.0111111111111111
681.641.637222222222220.00277777777777776
691.651.638888888888890.0111111111111111
701.651.640555555555560.00944444444444444
711.651.640555555555560.00944444444444445
721.651.640555555555560.00944444444444444


Goldfeld-Quandt test for Heteroskedasticity
p-valuesAlternative Hypothesis
breakpoint indexgreater2-sidedless
172.96840180793134e-415.93680361586267e-411
18001
197.87177433430026e-050.0001574354866860050.999921282256657
200.06965133249544930.1393026649908990.93034866750455
210.1462388759612570.2924777519225150.853761124038743
220.1937496667631500.3874993335263010.80625033323685
230.2249553716242050.4499107432484100.775044628375795
240.253303333657740.506606667315480.74669666634226
250.2517640442204570.5035280884409140.748235955779543
260.1981711909386150.3963423818772300.801828809061385
270.1487582459280460.2975164918560920.851241754071954
280.1066810734749270.2133621469498540.893318926525073
290.07429502184275330.1485900436855070.925704978157247
300.05066266252326370.1013253250465270.949337337476736
310.03972038287391890.07944076574783790.960279617126081
320.03952615242631550.07905230485263110.960473847573684
330.0390873568226380.0781747136452760.960912643177362
340.03915358290116810.07830716580233620.960846417098832
350.04436350749890570.08872701499781140.955636492501094
360.06283912046940140.1256782409388030.937160879530599
370.09098974197171450.1819794839434290.909010258028286
380.06952801572745770.1390560314549150.930471984272542
390.052696986596250.10539397319250.94730301340375
400.04168723525125270.08337447050250540.958312764748747
410.0335132131935740.0670264263871480.966486786806426
420.02830729830486880.05661459660973750.971692701695131
430.01979826038478130.03959652076956270.980201739615219
440.02058108702612010.04116217405224010.97941891297388
450.02346600177929580.04693200355859170.976533998220704
460.03489077317195730.06978154634391450.965109226828043
470.06956228652498860.1391245730499770.930437713475011
480.2487145272189840.4974290544379680.751285472781016
490.9999603519408557.92961182898487e-053.96480591449243e-05
500.9999655434701226.89130597567617e-053.44565298783809e-05
510.999986966341742.60673165191107e-051.30336582595554e-05
520.9999515998796669.68002406682206e-054.84001203341103e-05
530.9997640512807070.000471897438585330.000235948719292665
540.9986869159431670.002626168113665350.00131308405683268
550.9958362636721960.008327472655608660.00416373632780433

\begin{tabular}{lllllllll}
\hline
Goldfeld-Quandt test for Heteroskedasticity \tabularnewline
p-values & Alternative Hypothesis \tabularnewline
breakpoint index & greater & 2-sided & less \tabularnewline
17 & 2.96840180793134e-41 & 5.93680361586267e-41 & 1 \tabularnewline
18 & 0 & 0 & 1 \tabularnewline
19 & 7.87177433430026e-05 & 0.000157435486686005 & 0.999921282256657 \tabularnewline
20 & 0.0696513324954493 & 0.139302664990899 & 0.93034866750455 \tabularnewline
21 & 0.146238875961257 & 0.292477751922515 & 0.853761124038743 \tabularnewline
22 & 0.193749666763150 & 0.387499333526301 & 0.80625033323685 \tabularnewline
23 & 0.224955371624205 & 0.449910743248410 & 0.775044628375795 \tabularnewline
24 & 0.25330333365774 & 0.50660666731548 & 0.74669666634226 \tabularnewline
25 & 0.251764044220457 & 0.503528088440914 & 0.748235955779543 \tabularnewline
26 & 0.198171190938615 & 0.396342381877230 & 0.801828809061385 \tabularnewline
27 & 0.148758245928046 & 0.297516491856092 & 0.851241754071954 \tabularnewline
28 & 0.106681073474927 & 0.213362146949854 & 0.893318926525073 \tabularnewline
29 & 0.0742950218427533 & 0.148590043685507 & 0.925704978157247 \tabularnewline
30 & 0.0506626625232637 & 0.101325325046527 & 0.949337337476736 \tabularnewline
31 & 0.0397203828739189 & 0.0794407657478379 & 0.960279617126081 \tabularnewline
32 & 0.0395261524263155 & 0.0790523048526311 & 0.960473847573684 \tabularnewline
33 & 0.039087356822638 & 0.078174713645276 & 0.960912643177362 \tabularnewline
34 & 0.0391535829011681 & 0.0783071658023362 & 0.960846417098832 \tabularnewline
35 & 0.0443635074989057 & 0.0887270149978114 & 0.955636492501094 \tabularnewline
36 & 0.0628391204694014 & 0.125678240938803 & 0.937160879530599 \tabularnewline
37 & 0.0909897419717145 & 0.181979483943429 & 0.909010258028286 \tabularnewline
38 & 0.0695280157274577 & 0.139056031454915 & 0.930471984272542 \tabularnewline
39 & 0.05269698659625 & 0.1053939731925 & 0.94730301340375 \tabularnewline
40 & 0.0416872352512527 & 0.0833744705025054 & 0.958312764748747 \tabularnewline
41 & 0.033513213193574 & 0.067026426387148 & 0.966486786806426 \tabularnewline
42 & 0.0283072983048688 & 0.0566145966097375 & 0.971692701695131 \tabularnewline
43 & 0.0197982603847813 & 0.0395965207695627 & 0.980201739615219 \tabularnewline
44 & 0.0205810870261201 & 0.0411621740522401 & 0.97941891297388 \tabularnewline
45 & 0.0234660017792958 & 0.0469320035585917 & 0.976533998220704 \tabularnewline
46 & 0.0348907731719573 & 0.0697815463439145 & 0.965109226828043 \tabularnewline
47 & 0.0695622865249886 & 0.139124573049977 & 0.930437713475011 \tabularnewline
48 & 0.248714527218984 & 0.497429054437968 & 0.751285472781016 \tabularnewline
49 & 0.999960351940855 & 7.92961182898487e-05 & 3.96480591449243e-05 \tabularnewline
50 & 0.999965543470122 & 6.89130597567617e-05 & 3.44565298783809e-05 \tabularnewline
51 & 0.99998696634174 & 2.60673165191107e-05 & 1.30336582595554e-05 \tabularnewline
52 & 0.999951599879666 & 9.68002406682206e-05 & 4.84001203341103e-05 \tabularnewline
53 & 0.999764051280707 & 0.00047189743858533 & 0.000235948719292665 \tabularnewline
54 & 0.998686915943167 & 0.00262616811366535 & 0.00131308405683268 \tabularnewline
55 & 0.995836263672196 & 0.00832747265560866 & 0.00416373632780433 \tabularnewline
\hline
\end{tabular}
%Source: https://freestatistics.org/blog/index.php?pk=25591&T=5

[TABLE]
[ROW][C]Goldfeld-Quandt test for Heteroskedasticity[/C][/ROW]
[ROW][C]p-values[/C][C]Alternative Hypothesis[/C][/ROW]
[ROW][C]breakpoint index[/C][C]greater[/C][C]2-sided[/C][C]less[/C][/ROW]
[ROW][C]17[/C][C]2.96840180793134e-41[/C][C]5.93680361586267e-41[/C][C]1[/C][/ROW]
[ROW][C]18[/C][C]0[/C][C]0[/C][C]1[/C][/ROW]
[ROW][C]19[/C][C]7.87177433430026e-05[/C][C]0.000157435486686005[/C][C]0.999921282256657[/C][/ROW]
[ROW][C]20[/C][C]0.0696513324954493[/C][C]0.139302664990899[/C][C]0.93034866750455[/C][/ROW]
[ROW][C]21[/C][C]0.146238875961257[/C][C]0.292477751922515[/C][C]0.853761124038743[/C][/ROW]
[ROW][C]22[/C][C]0.193749666763150[/C][C]0.387499333526301[/C][C]0.80625033323685[/C][/ROW]
[ROW][C]23[/C][C]0.224955371624205[/C][C]0.449910743248410[/C][C]0.775044628375795[/C][/ROW]
[ROW][C]24[/C][C]0.25330333365774[/C][C]0.50660666731548[/C][C]0.74669666634226[/C][/ROW]
[ROW][C]25[/C][C]0.251764044220457[/C][C]0.503528088440914[/C][C]0.748235955779543[/C][/ROW]
[ROW][C]26[/C][C]0.198171190938615[/C][C]0.396342381877230[/C][C]0.801828809061385[/C][/ROW]
[ROW][C]27[/C][C]0.148758245928046[/C][C]0.297516491856092[/C][C]0.851241754071954[/C][/ROW]
[ROW][C]28[/C][C]0.106681073474927[/C][C]0.213362146949854[/C][C]0.893318926525073[/C][/ROW]
[ROW][C]29[/C][C]0.0742950218427533[/C][C]0.148590043685507[/C][C]0.925704978157247[/C][/ROW]
[ROW][C]30[/C][C]0.0506626625232637[/C][C]0.101325325046527[/C][C]0.949337337476736[/C][/ROW]
[ROW][C]31[/C][C]0.0397203828739189[/C][C]0.0794407657478379[/C][C]0.960279617126081[/C][/ROW]
[ROW][C]32[/C][C]0.0395261524263155[/C][C]0.0790523048526311[/C][C]0.960473847573684[/C][/ROW]
[ROW][C]33[/C][C]0.039087356822638[/C][C]0.078174713645276[/C][C]0.960912643177362[/C][/ROW]
[ROW][C]34[/C][C]0.0391535829011681[/C][C]0.0783071658023362[/C][C]0.960846417098832[/C][/ROW]
[ROW][C]35[/C][C]0.0443635074989057[/C][C]0.0887270149978114[/C][C]0.955636492501094[/C][/ROW]
[ROW][C]36[/C][C]0.0628391204694014[/C][C]0.125678240938803[/C][C]0.937160879530599[/C][/ROW]
[ROW][C]37[/C][C]0.0909897419717145[/C][C]0.181979483943429[/C][C]0.909010258028286[/C][/ROW]
[ROW][C]38[/C][C]0.0695280157274577[/C][C]0.139056031454915[/C][C]0.930471984272542[/C][/ROW]
[ROW][C]39[/C][C]0.05269698659625[/C][C]0.1053939731925[/C][C]0.94730301340375[/C][/ROW]
[ROW][C]40[/C][C]0.0416872352512527[/C][C]0.0833744705025054[/C][C]0.958312764748747[/C][/ROW]
[ROW][C]41[/C][C]0.033513213193574[/C][C]0.067026426387148[/C][C]0.966486786806426[/C][/ROW]
[ROW][C]42[/C][C]0.0283072983048688[/C][C]0.0566145966097375[/C][C]0.971692701695131[/C][/ROW]
[ROW][C]43[/C][C]0.0197982603847813[/C][C]0.0395965207695627[/C][C]0.980201739615219[/C][/ROW]
[ROW][C]44[/C][C]0.0205810870261201[/C][C]0.0411621740522401[/C][C]0.97941891297388[/C][/ROW]
[ROW][C]45[/C][C]0.0234660017792958[/C][C]0.0469320035585917[/C][C]0.976533998220704[/C][/ROW]
[ROW][C]46[/C][C]0.0348907731719573[/C][C]0.0697815463439145[/C][C]0.965109226828043[/C][/ROW]
[ROW][C]47[/C][C]0.0695622865249886[/C][C]0.139124573049977[/C][C]0.930437713475011[/C][/ROW]
[ROW][C]48[/C][C]0.248714527218984[/C][C]0.497429054437968[/C][C]0.751285472781016[/C][/ROW]
[ROW][C]49[/C][C]0.999960351940855[/C][C]7.92961182898487e-05[/C][C]3.96480591449243e-05[/C][/ROW]
[ROW][C]50[/C][C]0.999965543470122[/C][C]6.89130597567617e-05[/C][C]3.44565298783809e-05[/C][/ROW]
[ROW][C]51[/C][C]0.99998696634174[/C][C]2.60673165191107e-05[/C][C]1.30336582595554e-05[/C][/ROW]
[ROW][C]52[/C][C]0.999951599879666[/C][C]9.68002406682206e-05[/C][C]4.84001203341103e-05[/C][/ROW]
[ROW][C]53[/C][C]0.999764051280707[/C][C]0.00047189743858533[/C][C]0.000235948719292665[/C][/ROW]
[ROW][C]54[/C][C]0.998686915943167[/C][C]0.00262616811366535[/C][C]0.00131308405683268[/C][/ROW]
[ROW][C]55[/C][C]0.995836263672196[/C][C]0.00832747265560866[/C][C]0.00416373632780433[/C][/ROW]
[/TABLE]
Source: https://freestatistics.org/blog/index.php?pk=25591&T=5

Globally Unique Identifier (entire table): ba.freestatistics.org/blog/index.php?pk=25591&T=5

As an alternative you can also use a QR Code:  

The GUIDs for individual cells are displayed in the table below:

Goldfeld-Quandt test for Heteroskedasticity
p-valuesAlternative Hypothesis
breakpoint indexgreater2-sidedless
172.96840180793134e-415.93680361586267e-411
18001
197.87177433430026e-050.0001574354866860050.999921282256657
200.06965133249544930.1393026649908990.93034866750455
210.1462388759612570.2924777519225150.853761124038743
220.1937496667631500.3874993335263010.80625033323685
230.2249553716242050.4499107432484100.775044628375795
240.253303333657740.506606667315480.74669666634226
250.2517640442204570.5035280884409140.748235955779543
260.1981711909386150.3963423818772300.801828809061385
270.1487582459280460.2975164918560920.851241754071954
280.1066810734749270.2133621469498540.893318926525073
290.07429502184275330.1485900436855070.925704978157247
300.05066266252326370.1013253250465270.949337337476736
310.03972038287391890.07944076574783790.960279617126081
320.03952615242631550.07905230485263110.960473847573684
330.0390873568226380.0781747136452760.960912643177362
340.03915358290116810.07830716580233620.960846417098832
350.04436350749890570.08872701499781140.955636492501094
360.06283912046940140.1256782409388030.937160879530599
370.09098974197171450.1819794839434290.909010258028286
380.06952801572745770.1390560314549150.930471984272542
390.052696986596250.10539397319250.94730301340375
400.04168723525125270.08337447050250540.958312764748747
410.0335132131935740.0670264263871480.966486786806426
420.02830729830486880.05661459660973750.971692701695131
430.01979826038478130.03959652076956270.980201739615219
440.02058108702612010.04116217405224010.97941891297388
450.02346600177929580.04693200355859170.976533998220704
460.03489077317195730.06978154634391450.965109226828043
470.06956228652498860.1391245730499770.930437713475011
480.2487145272189840.4974290544379680.751285472781016
490.9999603519408557.92961182898487e-053.96480591449243e-05
500.9999655434701226.89130597567617e-053.44565298783809e-05
510.999986966341742.60673165191107e-051.30336582595554e-05
520.9999515998796669.68002406682206e-054.84001203341103e-05
530.9997640512807070.000471897438585330.000235948719292665
540.9986869159431670.002626168113665350.00131308405683268
550.9958362636721960.008327472655608660.00416373632780433


Meta Analysis of Goldfeld-Quandt test for Heteroskedasticity
Description# significant tests% significant testsOK/NOK
1% type I error level100.256410256410256NOK
5% type I error level130.333333333333333NOK
10% type I error level220.564102564102564NOK

\begin{tabular}{lllllllll}
\hline
Meta Analysis of Goldfeld-Quandt test for Heteroskedasticity \tabularnewline
Description & # significant tests & % significant tests & OK/NOK \tabularnewline
1% type I error level & 10 & 0.256410256410256 & NOK \tabularnewline
5% type I error level & 13 & 0.333333333333333 & NOK \tabularnewline
10% type I error level & 22 & 0.564102564102564 & NOK \tabularnewline
\hline
\end{tabular}
%Source: https://freestatistics.org/blog/index.php?pk=25591&T=6

[TABLE]
[ROW][C]Meta Analysis of Goldfeld-Quandt test for Heteroskedasticity[/C][/ROW]
[ROW][C]Description[/C][C]# significant tests[/C][C]% significant tests[/C][C]OK/NOK[/C][/ROW]
[ROW][C]1% type I error level[/C][C]10[/C][C]0.256410256410256[/C][C]NOK[/C][/ROW]
[ROW][C]5% type I error level[/C][C]13[/C][C]0.333333333333333[/C][C]NOK[/C][/ROW]
[ROW][C]10% type I error level[/C][C]22[/C][C]0.564102564102564[/C][C]NOK[/C][/ROW]
[/TABLE]
Source: https://freestatistics.org/blog/index.php?pk=25591&T=6

Globally Unique Identifier (entire table): ba.freestatistics.org/blog/index.php?pk=25591&T=6

As an alternative you can also use a QR Code:  

The GUIDs for individual cells are displayed in the table below:

Meta Analysis of Goldfeld-Quandt test for Heteroskedasticity
Description# significant tests% significant testsOK/NOK
1% type I error level100.256410256410256NOK
5% type I error level130.333333333333333NOK
10% type I error level220.564102564102564NOK


Parameters (Session):
par1 = 1 ; par2 = Include Monthly Dummies ; par3 = Linear Trend ;
Parameters (R input):
par1 = 1 ; par2 = Include Monthly Dummies ; par3 = Linear Trend ;
R code (references can be found in the software module):
library(lattice)
library(lmtest)
n25 <- 25 #minimum number of obs. for Goldfeld-Quandt test
par1 <- as.numeric(par1)
x <- t(y)
k <- length(x[1,])
n <- length(x[,1])
x1 <- cbind(x[,par1], x[,1:k!=par1])
mycolnames <- c(colnames(x)[par1], colnames(x)[1:k!=par1])
colnames(x1) <- mycolnames #colnames(x)[par1]
x <- x1
if (par3 == 'First Differences'){
x2 <- array(0, dim=c(n-1,k), dimnames=list(1:(n-1), paste('(1-B)',colnames(x),sep='')))
for (i in 1:n-1) {
for (j in 1:k) {
x2[i,j] <- x[i+1,j] - x[i,j]
}
}
x <- x2
}
if (par2 == 'Include Monthly Dummies'){
x2 <- array(0, dim=c(n,11), dimnames=list(1:n, paste('M', seq(1:11), sep ='')))
for (i in 1:11){
x2[seq(i,n,12),i] <- 1
}
x <- cbind(x, x2)
}
if (par2 == 'Include Quarterly Dummies'){
x2 <- array(0, dim=c(n,3), dimnames=list(1:n, paste('Q', seq(1:3), sep ='')))
for (i in 1:3){
x2[seq(i,n,4),i] <- 1
}
x <- cbind(x, x2)
}
k <- length(x[1,])
if (par3 == 'Linear Trend'){
x <- cbind(x, c(1:n))
colnames(x)[k+1] <- 't'
}
x
k <- length(x[1,])
df <- as.data.frame(x)
(mylm <- lm(df))
(mysum <- summary(mylm))
if (n > n25) {
kp3 <- k + 3
nmkm3 <- n - k - 3
gqarr <- array(NA, dim=c(nmkm3-kp3+1,3))
numgqtests <- 0
numsignificant1 <- 0
numsignificant5 <- 0
numsignificant10 <- 0
for (mypoint in kp3:nmkm3) {
j <- 0
numgqtests <- numgqtests + 1
for (myalt in c('greater', 'two.sided', 'less')) {
j <- j + 1
gqarr[mypoint-kp3+1,j] <- gqtest(mylm, point=mypoint, alternative=myalt)$p.value
}
if (gqarr[mypoint-kp3+1,2] < 0.01) numsignificant1 <- numsignificant1 + 1
if (gqarr[mypoint-kp3+1,2] < 0.05) numsignificant5 <- numsignificant5 + 1
if (gqarr[mypoint-kp3+1,2] < 0.10) numsignificant10 <- numsignificant10 + 1
}
gqarr
}
bitmap(file='test0.png')
plot(x[,1], type='l', main='Actuals and Interpolation', ylab='value of Actuals and Interpolation (dots)', xlab='time or index')
points(x[,1]-mysum$resid)
grid()
dev.off()
bitmap(file='test1.png')
plot(mysum$resid, type='b', pch=19, main='Residuals', ylab='value of Residuals', xlab='time or index')
grid()
dev.off()
bitmap(file='test2.png')
hist(mysum$resid, main='Residual Histogram', xlab='values of Residuals')
grid()
dev.off()
bitmap(file='test3.png')
densityplot(~mysum$resid,col='black',main='Residual Density Plot', xlab='values of Residuals')
dev.off()
bitmap(file='test4.png')
qqnorm(mysum$resid, main='Residual Normal Q-Q Plot')
qqline(mysum$resid)
grid()
dev.off()
(myerror <- as.ts(mysum$resid))
bitmap(file='test5.png')
dum <- cbind(lag(myerror,k=1),myerror)
dum
dum1 <- dum[2:length(myerror),]
dum1
z <- as.data.frame(dum1)
z
plot(z,main=paste('Residual Lag plot, lowess, and regression line'), ylab='values of Residuals', xlab='lagged values of Residuals')
lines(lowess(z))
abline(lm(z))
grid()
dev.off()
bitmap(file='test6.png')
acf(mysum$resid, lag.max=length(mysum$resid)/2, main='Residual Autocorrelation Function')
grid()
dev.off()
bitmap(file='test7.png')
pacf(mysum$resid, lag.max=length(mysum$resid)/2, main='Residual Partial Autocorrelation Function')
grid()
dev.off()
bitmap(file='test8.png')
opar <- par(mfrow = c(2,2), oma = c(0, 0, 1.1, 0))
plot(mylm, las = 1, sub='Residual Diagnostics')
par(opar)
dev.off()
if (n > n25) {
bitmap(file='test9.png')
plot(kp3:nmkm3,gqarr[,2], main='Goldfeld-Quandt test',ylab='2-sided p-value',xlab='breakpoint')
grid()
dev.off()
}
load(file='createtable')
a<-table.start()
a<-table.row.start(a)
a<-table.element(a, 'Multiple Linear Regression - Estimated Regression Equation', 1, TRUE)
a<-table.row.end(a)
myeq <- colnames(x)[1]
myeq <- paste(myeq, '[t] = ', sep='')
for (i in 1:k){
if (mysum$coefficients[i,1] > 0) myeq <- paste(myeq, '+', '')
myeq <- paste(myeq, mysum$coefficients[i,1], sep=' ')
if (rownames(mysum$coefficients)[i] != '(Intercept)') {
myeq <- paste(myeq, rownames(mysum$coefficients)[i], sep='')
if (rownames(mysum$coefficients)[i] != 't') myeq <- paste(myeq, '[t]', sep='')
}
}
myeq <- paste(myeq, ' + e[t]')
a<-table.row.start(a)
a<-table.element(a, myeq)
a<-table.row.end(a)
a<-table.end(a)
table.save(a,file='mytable1.tab')
a<-table.start()
a<-table.row.start(a)
a<-table.element(a,hyperlink('ols1.htm','Multiple Linear Regression - Ordinary Least Squares',''), 6, TRUE)
a<-table.row.end(a)
a<-table.row.start(a)
a<-table.element(a,'Variable',header=TRUE)
a<-table.element(a,'Parameter',header=TRUE)
a<-table.element(a,'S.D.',header=TRUE)
a<-table.element(a,'T-STAT
H0: parameter = 0',header=TRUE)
a<-table.element(a,'2-tail p-value',header=TRUE)
a<-table.element(a,'1-tail p-value',header=TRUE)
a<-table.row.end(a)
for (i in 1:k){
a<-table.row.start(a)
a<-table.element(a,rownames(mysum$coefficients)[i],header=TRUE)
a<-table.element(a,mysum$coefficients[i,1])
a<-table.element(a, round(mysum$coefficients[i,2],6))
a<-table.element(a, round(mysum$coefficients[i,3],4))
a<-table.element(a, round(mysum$coefficients[i,4],6))
a<-table.element(a, round(mysum$coefficients[i,4]/2,6))
a<-table.row.end(a)
}
a<-table.end(a)
table.save(a,file='mytable2.tab')
a<-table.start()
a<-table.row.start(a)
a<-table.element(a, 'Multiple Linear Regression - Regression Statistics', 2, TRUE)
a<-table.row.end(a)
a<-table.row.start(a)
a<-table.element(a, 'Multiple R',1,TRUE)
a<-table.element(a, sqrt(mysum$r.squared))
a<-table.row.end(a)
a<-table.row.start(a)
a<-table.element(a, 'R-squared',1,TRUE)
a<-table.element(a, mysum$r.squared)
a<-table.row.end(a)
a<-table.row.start(a)
a<-table.element(a, 'Adjusted R-squared',1,TRUE)
a<-table.element(a, mysum$adj.r.squared)
a<-table.row.end(a)
a<-table.row.start(a)
a<-table.element(a, 'F-TEST (value)',1,TRUE)
a<-table.element(a, mysum$fstatistic[1])
a<-table.row.end(a)
a<-table.row.start(a)
a<-table.element(a, 'F-TEST (DF numerator)',1,TRUE)
a<-table.element(a, mysum$fstatistic[2])
a<-table.row.end(a)
a<-table.row.start(a)
a<-table.element(a, 'F-TEST (DF denominator)',1,TRUE)
a<-table.element(a, mysum$fstatistic[3])
a<-table.row.end(a)
a<-table.row.start(a)
a<-table.element(a, 'p-value',1,TRUE)
a<-table.element(a, 1-pf(mysum$fstatistic[1],mysum$fstatistic[2],mysum$fstatistic[3]))
a<-table.row.end(a)
a<-table.row.start(a)
a<-table.element(a, 'Multiple Linear Regression - Residual Statistics', 2, TRUE)
a<-table.row.end(a)
a<-table.row.start(a)
a<-table.element(a, 'Residual Standard Deviation',1,TRUE)
a<-table.element(a, mysum$sigma)
a<-table.row.end(a)
a<-table.row.start(a)
a<-table.element(a, 'Sum Squared Residuals',1,TRUE)
a<-table.element(a, sum(myerror*myerror))
a<-table.row.end(a)
a<-table.end(a)
table.save(a,file='mytable3.tab')
a<-table.start()
a<-table.row.start(a)
a<-table.element(a, 'Multiple Linear Regression - Actuals, Interpolation, and Residuals', 4, TRUE)
a<-table.row.end(a)
a<-table.row.start(a)
a<-table.element(a, 'Time or Index', 1, TRUE)
a<-table.element(a, 'Actuals', 1, TRUE)
a<-table.element(a, 'Interpolation
Forecast', 1, TRUE)
a<-table.element(a, 'Residuals
Prediction Error', 1, TRUE)
a<-table.row.end(a)
for (i in 1:n) {
a<-table.row.start(a)
a<-table.element(a,i, 1, TRUE)
a<-table.element(a,x[i])
a<-table.element(a,x[i]-mysum$resid[i])
a<-table.element(a,mysum$resid[i])
a<-table.row.end(a)
}
a<-table.end(a)
table.save(a,file='mytable4.tab')
if (n > n25) {
a<-table.start()
a<-table.row.start(a)
a<-table.element(a,'Goldfeld-Quandt test for Heteroskedasticity',4,TRUE)
a<-table.row.end(a)
a<-table.row.start(a)
a<-table.element(a,'p-values',header=TRUE)
a<-table.element(a,'Alternative Hypothesis',3,header=TRUE)
a<-table.row.end(a)
a<-table.row.start(a)
a<-table.element(a,'breakpoint index',header=TRUE)
a<-table.element(a,'greater',header=TRUE)
a<-table.element(a,'2-sided',header=TRUE)
a<-table.element(a,'less',header=TRUE)
a<-table.row.end(a)
for (mypoint in kp3:nmkm3) {
a<-table.row.start(a)
a<-table.element(a,mypoint,header=TRUE)
a<-table.element(a,gqarr[mypoint-kp3+1,1])
a<-table.element(a,gqarr[mypoint-kp3+1,2])
a<-table.element(a,gqarr[mypoint-kp3+1,3])
a<-table.row.end(a)
}
a<-table.end(a)
table.save(a,file='mytable5.tab')
a<-table.start()
a<-table.row.start(a)
a<-table.element(a,'Meta Analysis of Goldfeld-Quandt test for Heteroskedasticity',4,TRUE)
a<-table.row.end(a)
a<-table.row.start(a)
a<-table.element(a,'Description',header=TRUE)
a<-table.element(a,'# significant tests',header=TRUE)
a<-table.element(a,'% significant tests',header=TRUE)
a<-table.element(a,'OK/NOK',header=TRUE)
a<-table.row.end(a)
a<-table.row.start(a)
a<-table.element(a,'1% type I error level',header=TRUE)
a<-table.element(a,numsignificant1)
a<-table.element(a,numsignificant1/numgqtests)
if (numsignificant1/numgqtests < 0.01) dum <- 'OK' else dum <- 'NOK'
a<-table.element(a,dum)
a<-table.row.end(a)
a<-table.row.start(a)
a<-table.element(a,'5% type I error level',header=TRUE)
a<-table.element(a,numsignificant5)
a<-table.element(a,numsignificant5/numgqtests)
if (numsignificant5/numgqtests < 0.05) dum <- 'OK' else dum <- 'NOK'
a<-table.element(a,dum)
a<-table.row.end(a)
a<-table.row.start(a)
a<-table.element(a,'10% type I error level',header=TRUE)
a<-table.element(a,numsignificant10)
a<-table.element(a,numsignificant10/numgqtests)
if (numsignificant10/numgqtests < 0.1) dum <- 'OK' else dum <- 'NOK'
a<-table.element(a,dum)
a<-table.row.end(a)
a<-table.end(a)
table.save(a,file='mytable6.tab')
}