Free Statistics

of Irreproducible Research!

Author's title

Author*Unverified author*
R Software Modulerwasp_multipleregression.wasp
Title produced by softwareMultiple Regression
Date of computationTue, 25 Nov 2008 09:06:35 -0700
Cite this page as followsStatistical Computations at FreeStatistics.org, Office for Research Development and Education, URL https://freestatistics.org/blog/index.php?v=date/2008/Nov/25/t122762933679jvtaifg5rklzg.htm/, Retrieved Thu, 09 May 2024 04:56:52 +0000
Statistical Computations at FreeStatistics.org, Office for Research Development and Education, URL https://freestatistics.org/blog/index.php?pk=25587, Retrieved Thu, 09 May 2024 04:56:52 +0000
QR Codes:

Original text written by user:
IsPrivate?No (this computation is public)
User-defined keywordsNatalie De Wilde
Estimated Impact186
Family? (F = Feedback message, R = changed R code, M = changed R Module, P = changed Parameters, D = changed Data)
-     [Multiple Regression] [Q1 The Seatbeltlaw] [2007-11-14 19:27:43] [8cd6641b921d30ebe00b648d1481bba0]
F R  D  [Multiple Regression] [Seatbelt Law & Tu...] [2008-11-22 11:43:40] [415d0222c17b651a9576eaac006f530d]
F    D      [Multiple Regression] [Multiple Regressi...] [2008-11-25 16:06:35] [325408a88a81f0351fc4ca12f2953f3c] [Current]
Feedback Forum
2008-11-30 12:52:13 [Steven Vercammen] [reply
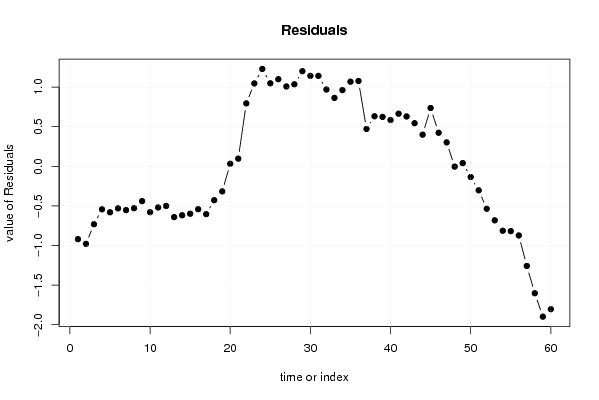
Het model wordt niet uitgebreid genoeg besproken. Er wordt geen gebeurtenis weergegeven waarvoor de dummie-waarde verandert. Het model blijkt verre van correct. Er is sprake van een zeer grote autocorrelatie (alle verticale lijntjes op de AC-plot overschrijden de betrouwbaarheidsintervallen en op de lag plot is duidelijk een positieve correlatie merkbaar). De qq-plot, het histogram en de density plot wijzen alles behalve op een normaalverdeling van de residuals. Er zijn dus nog veel andere gebeurtenis waarmee geen rekening wordt gehouden in het model.
2008-11-30 17:41:05 [a2386b643d711541400692649981f2dc] [reply
Je vermeldt niet welke gegevens je gebruikt waardoor het moeilijk is om een beoordeling te maken. Je had beter eerst een model gemaakt zonder dummies en lineaire trend om daaruit bv iets te ontdekken wat je zou kunnen onderzoeken. Je zegt heel weinig bij de grafieken. Je kon bv zeggen waarom het niet op een normaalverdeling lijkt. (de grafiek vertoont niet de typische klokvorm van een normaalverdeling)Sommige grafieken(de twee laatste) bespreek je niet eens.

Post a new message
Dataseries X:
6.06	106.8
5.983	114.3
6.11	105.7
6.143	90.1
6.093	91.6
6.148	97.7
6.464	100.8
6.532	104.6
6.321	95.9
6.23	102.7
6.176	104
6.338	107.9
6.462	113.8
6.401	113.8
6.46	123.1
6.519	125.1
6.542	137.6
6.637	134
7.114	140.3
7.579	152.1
7.408	150.6
8.243	167.3
8.243	153.2
8.434	142
8.576	154.4
8.58	158.5
8.645	180.9
8.66	181.3
8.72	172.4
8.787	192
9.162	199.3
9.144	215.4
8.806	214.3
8.778	201.5
8.66	190.5
8.826	196
8.609	215.7
8.628	209.4
8.619	214.1
8.775	237.8
8.84	239
8.745	237.8
9.092	251.5
8.934	248.8
8.749	215.4
8.298	201.2
8.067	203.1
7.969	214.2
7.999	188.9
7.865	203
7.746	213.3
7.633	228.5
7.458	228.2
7.391	240.9
7.856	258.8
7.72	248.5
7.297	269.2
7.123	289.6
7.004	323.4
7.151	317.2


Summary of computational transaction
Raw Inputview raw input (R code)
Raw Outputview raw output of R engine
Computing time5 seconds
R Server'Gwilym Jenkins' @ 72.249.127.135

\begin{tabular}{lllllllll}
\hline
Summary of computational transaction \tabularnewline
Raw Input & view raw input (R code)  \tabularnewline
Raw Output & view raw output of R engine  \tabularnewline
Computing time & 5 seconds \tabularnewline
R Server & 'Gwilym Jenkins' @ 72.249.127.135 \tabularnewline
\hline
\end{tabular}
%Source: https://freestatistics.org/blog/index.php?pk=25587&T=0

[TABLE]
[ROW][C]Summary of computational transaction[/C][/ROW]
[ROW][C]Raw Input[/C][C]view raw input (R code) [/C][/ROW]
[ROW][C]Raw Output[/C][C]view raw output of R engine [/C][/ROW]
[ROW][C]Computing time[/C][C]5 seconds[/C][/ROW]
[ROW][C]R Server[/C][C]'Gwilym Jenkins' @ 72.249.127.135[/C][/ROW]
[/TABLE]
Source: https://freestatistics.org/blog/index.php?pk=25587&T=0

Globally Unique Identifier (entire table): ba.freestatistics.org/blog/index.php?pk=25587&T=0

As an alternative you can also use a QR Code:  

The GUIDs for individual cells are displayed in the table below:

Summary of computational transaction
Raw Inputview raw input (R code)
Raw Outputview raw output of R engine
Computing time5 seconds
R Server'Gwilym Jenkins' @ 72.249.127.135


Multiple Linear Regression - Estimated Regression Equation
werkloosheid_textielsector[t] = + 5.81197085338971 + 0.0089425481890016energieprijzen[t] + 0.207324617989468M1[t] + 0.117724234416474M2[t] + 0.0690787206166146M3[t] + 0.0480107263254788M4[t] + 0.0167763718990092M5[t] -0.0374208485307496M6[t] + 0.267090839363828M7[t] + 0.272742412537294M8[t] + 0.0449633472448334M9[t] + 0.0278342377663408M10[t] -0.102952323523151M11[t] + 0.00510329659966777t + e[t]

\begin{tabular}{lllllllll}
\hline
Multiple Linear Regression - Estimated Regression Equation \tabularnewline
werkloosheid_textielsector[t] =  +  5.81197085338971 +  0.0089425481890016energieprijzen[t] +  0.207324617989468M1[t] +  0.117724234416474M2[t] +  0.0690787206166146M3[t] +  0.0480107263254788M4[t] +  0.0167763718990092M5[t] -0.0374208485307496M6[t] +  0.267090839363828M7[t] +  0.272742412537294M8[t] +  0.0449633472448334M9[t] +  0.0278342377663408M10[t] -0.102952323523151M11[t] +  0.00510329659966777t  + e[t] \tabularnewline
\hline
\end{tabular}
%Source: https://freestatistics.org/blog/index.php?pk=25587&T=1

[TABLE]
[ROW][C]Multiple Linear Regression - Estimated Regression Equation[/C][/ROW]
[ROW][C]werkloosheid_textielsector[t] =  +  5.81197085338971 +  0.0089425481890016energieprijzen[t] +  0.207324617989468M1[t] +  0.117724234416474M2[t] +  0.0690787206166146M3[t] +  0.0480107263254788M4[t] +  0.0167763718990092M5[t] -0.0374208485307496M6[t] +  0.267090839363828M7[t] +  0.272742412537294M8[t] +  0.0449633472448334M9[t] +  0.0278342377663408M10[t] -0.102952323523151M11[t] +  0.00510329659966777t  + e[t][/C][/ROW]
[/TABLE]
Source: https://freestatistics.org/blog/index.php?pk=25587&T=1

Globally Unique Identifier (entire table): ba.freestatistics.org/blog/index.php?pk=25587&T=1

As an alternative you can also use a QR Code:  

The GUIDs for individual cells are displayed in the table below:

Multiple Linear Regression - Estimated Regression Equation
werkloosheid_textielsector[t] = + 5.81197085338971 + 0.0089425481890016energieprijzen[t] + 0.207324617989468M1[t] + 0.117724234416474M2[t] + 0.0690787206166146M3[t] + 0.0480107263254788M4[t] + 0.0167763718990092M5[t] -0.0374208485307496M6[t] + 0.267090839363828M7[t] + 0.272742412537294M8[t] + 0.0449633472448334M9[t] + 0.0278342377663408M10[t] -0.102952323523151M11[t] + 0.00510329659966777t + e[t]


Multiple Linear Regression - Ordinary Least Squares
VariableParameterS.D.T-STATH0: parameter = 02-tail p-value1-tail p-value
(Intercept)5.811970853389710.710668.178300
energieprijzen0.00894254818900160.0063541.40730.1660530.083027
M10.2073246179894680.6030980.34380.7325890.366294
M20.1177242344164740.6020170.19550.8458240.422912
M30.06907872061661460.6007760.1150.9089590.45448
M40.04801072632547880.6002720.080.9365990.468299
M50.01677637189900920.5993960.0280.9777920.488896
M6-0.03742084853074960.599422-0.06240.9504920.475246
M70.2670908393638280.6021860.44350.6594580.329729
M80.2727424125372940.6021960.45290.6527410.32637
M90.04496334724483340.5980060.07520.9403910.470195
M100.02783423776634080.597830.04660.9630660.481533
M11-0.1029523235231510.597535-0.17230.8639610.431981
t0.005103296599667770.0215730.23660.8140520.407026

\begin{tabular}{lllllllll}
\hline
Multiple Linear Regression - Ordinary Least Squares \tabularnewline
Variable & Parameter & S.D. & T-STATH0: parameter = 0 & 2-tail p-value & 1-tail p-value \tabularnewline
(Intercept) & 5.81197085338971 & 0.71066 & 8.1783 & 0 & 0 \tabularnewline
energieprijzen & 0.0089425481890016 & 0.006354 & 1.4073 & 0.166053 & 0.083027 \tabularnewline
M1 & 0.207324617989468 & 0.603098 & 0.3438 & 0.732589 & 0.366294 \tabularnewline
M2 & 0.117724234416474 & 0.602017 & 0.1955 & 0.845824 & 0.422912 \tabularnewline
M3 & 0.0690787206166146 & 0.600776 & 0.115 & 0.908959 & 0.45448 \tabularnewline
M4 & 0.0480107263254788 & 0.600272 & 0.08 & 0.936599 & 0.468299 \tabularnewline
M5 & 0.0167763718990092 & 0.599396 & 0.028 & 0.977792 & 0.488896 \tabularnewline
M6 & -0.0374208485307496 & 0.599422 & -0.0624 & 0.950492 & 0.475246 \tabularnewline
M7 & 0.267090839363828 & 0.602186 & 0.4435 & 0.659458 & 0.329729 \tabularnewline
M8 & 0.272742412537294 & 0.602196 & 0.4529 & 0.652741 & 0.32637 \tabularnewline
M9 & 0.0449633472448334 & 0.598006 & 0.0752 & 0.940391 & 0.470195 \tabularnewline
M10 & 0.0278342377663408 & 0.59783 & 0.0466 & 0.963066 & 0.481533 \tabularnewline
M11 & -0.102952323523151 & 0.597535 & -0.1723 & 0.863961 & 0.431981 \tabularnewline
t & 0.00510329659966777 & 0.021573 & 0.2366 & 0.814052 & 0.407026 \tabularnewline
\hline
\end{tabular}
%Source: https://freestatistics.org/blog/index.php?pk=25587&T=2

[TABLE]
[ROW][C]Multiple Linear Regression - Ordinary Least Squares[/C][/ROW]
[ROW][C]Variable[/C][C]Parameter[/C][C]S.D.[/C][C]T-STATH0: parameter = 0[/C][C]2-tail p-value[/C][C]1-tail p-value[/C][/ROW]
[ROW][C](Intercept)[/C][C]5.81197085338971[/C][C]0.71066[/C][C]8.1783[/C][C]0[/C][C]0[/C][/ROW]
[ROW][C]energieprijzen[/C][C]0.0089425481890016[/C][C]0.006354[/C][C]1.4073[/C][C]0.166053[/C][C]0.083027[/C][/ROW]
[ROW][C]M1[/C][C]0.207324617989468[/C][C]0.603098[/C][C]0.3438[/C][C]0.732589[/C][C]0.366294[/C][/ROW]
[ROW][C]M2[/C][C]0.117724234416474[/C][C]0.602017[/C][C]0.1955[/C][C]0.845824[/C][C]0.422912[/C][/ROW]
[ROW][C]M3[/C][C]0.0690787206166146[/C][C]0.600776[/C][C]0.115[/C][C]0.908959[/C][C]0.45448[/C][/ROW]
[ROW][C]M4[/C][C]0.0480107263254788[/C][C]0.600272[/C][C]0.08[/C][C]0.936599[/C][C]0.468299[/C][/ROW]
[ROW][C]M5[/C][C]0.0167763718990092[/C][C]0.599396[/C][C]0.028[/C][C]0.977792[/C][C]0.488896[/C][/ROW]
[ROW][C]M6[/C][C]-0.0374208485307496[/C][C]0.599422[/C][C]-0.0624[/C][C]0.950492[/C][C]0.475246[/C][/ROW]
[ROW][C]M7[/C][C]0.267090839363828[/C][C]0.602186[/C][C]0.4435[/C][C]0.659458[/C][C]0.329729[/C][/ROW]
[ROW][C]M8[/C][C]0.272742412537294[/C][C]0.602196[/C][C]0.4529[/C][C]0.652741[/C][C]0.32637[/C][/ROW]
[ROW][C]M9[/C][C]0.0449633472448334[/C][C]0.598006[/C][C]0.0752[/C][C]0.940391[/C][C]0.470195[/C][/ROW]
[ROW][C]M10[/C][C]0.0278342377663408[/C][C]0.59783[/C][C]0.0466[/C][C]0.963066[/C][C]0.481533[/C][/ROW]
[ROW][C]M11[/C][C]-0.102952323523151[/C][C]0.597535[/C][C]-0.1723[/C][C]0.863961[/C][C]0.431981[/C][/ROW]
[ROW][C]t[/C][C]0.00510329659966777[/C][C]0.021573[/C][C]0.2366[/C][C]0.814052[/C][C]0.407026[/C][/ROW]
[/TABLE]
Source: https://freestatistics.org/blog/index.php?pk=25587&T=2

Globally Unique Identifier (entire table): ba.freestatistics.org/blog/index.php?pk=25587&T=2

As an alternative you can also use a QR Code:  

The GUIDs for individual cells are displayed in the table below:

Multiple Linear Regression - Ordinary Least Squares
VariableParameterS.D.T-STATH0: parameter = 02-tail p-value1-tail p-value
(Intercept)5.811970853389710.710668.178300
energieprijzen0.00894254818900160.0063541.40730.1660530.083027
M10.2073246179894680.6030980.34380.7325890.366294
M20.1177242344164740.6020170.19550.8458240.422912
M30.06907872061661460.6007760.1150.9089590.45448
M40.04801072632547880.6002720.080.9365990.468299
M50.01677637189900920.5993960.0280.9777920.488896
M6-0.03742084853074960.599422-0.06240.9504920.475246
M70.2670908393638280.6021860.44350.6594580.329729
M80.2727424125372940.6021960.45290.6527410.32637
M90.04496334724483340.5980060.07520.9403910.470195
M100.02783423776634080.597830.04660.9630660.481533
M11-0.1029523235231510.597535-0.17230.8639610.431981
t0.005103296599667770.0215730.23660.8140520.407026


Multiple Linear Regression - Regression Statistics
Multiple R0.598938556194584
R-squared0.358727394096452
Adjusted R-squared0.177498179384580
F-TEST (value)1.97941261659593
F-TEST (DF numerator)13
F-TEST (DF denominator)46
p-value0.0450107465049226
Multiple Linear Regression - Residual Statistics
Residual Standard Deviation0.944360703491922
Sum Squared Residuals41.0235883617888

\begin{tabular}{lllllllll}
\hline
Multiple Linear Regression - Regression Statistics \tabularnewline
Multiple R & 0.598938556194584 \tabularnewline
R-squared & 0.358727394096452 \tabularnewline
Adjusted R-squared & 0.177498179384580 \tabularnewline
F-TEST (value) & 1.97941261659593 \tabularnewline
F-TEST (DF numerator) & 13 \tabularnewline
F-TEST (DF denominator) & 46 \tabularnewline
p-value & 0.0450107465049226 \tabularnewline
Multiple Linear Regression - Residual Statistics \tabularnewline
Residual Standard Deviation & 0.944360703491922 \tabularnewline
Sum Squared Residuals & 41.0235883617888 \tabularnewline
\hline
\end{tabular}
%Source: https://freestatistics.org/blog/index.php?pk=25587&T=3

[TABLE]
[ROW][C]Multiple Linear Regression - Regression Statistics[/C][/ROW]
[ROW][C]Multiple R[/C][C]0.598938556194584[/C][/ROW]
[ROW][C]R-squared[/C][C]0.358727394096452[/C][/ROW]
[ROW][C]Adjusted R-squared[/C][C]0.177498179384580[/C][/ROW]
[ROW][C]F-TEST (value)[/C][C]1.97941261659593[/C][/ROW]
[ROW][C]F-TEST (DF numerator)[/C][C]13[/C][/ROW]
[ROW][C]F-TEST (DF denominator)[/C][C]46[/C][/ROW]
[ROW][C]p-value[/C][C]0.0450107465049226[/C][/ROW]
[ROW][C]Multiple Linear Regression - Residual Statistics[/C][/ROW]
[ROW][C]Residual Standard Deviation[/C][C]0.944360703491922[/C][/ROW]
[ROW][C]Sum Squared Residuals[/C][C]41.0235883617888[/C][/ROW]
[/TABLE]
Source: https://freestatistics.org/blog/index.php?pk=25587&T=3

Globally Unique Identifier (entire table): ba.freestatistics.org/blog/index.php?pk=25587&T=3

As an alternative you can also use a QR Code:  

The GUIDs for individual cells are displayed in the table below:

Multiple Linear Regression - Regression Statistics
Multiple R0.598938556194584
R-squared0.358727394096452
Adjusted R-squared0.177498179384580
F-TEST (value)1.97941261659593
F-TEST (DF numerator)13
F-TEST (DF denominator)46
p-value0.0450107465049226
Multiple Linear Regression - Residual Statistics
Residual Standard Deviation0.944360703491922
Sum Squared Residuals41.0235883617888


Multiple Linear Regression - Actuals, Interpolation, and Residuals
Time or IndexActualsInterpolationForecastResidualsPrediction Error
16.066.97946291456422-0.919462914564217
25.9836.9620349390084-0.979034939008404
36.116.8415868073828-0.731586807382796
46.1436.6861183579429-0.543118357942903
56.0936.6734011223996-0.580401122399603
66.1486.67885674252242-0.530856742522422
76.4647.01619362640257-0.552193626402571
86.5327.06093017929391-0.528930179293911
96.3216.7604542413568-0.439454241356806
106.236.80923775616319-0.579237756163191
116.1766.69517980411907-0.519179804119069
126.3386.838111362179-0.500111362178994
136.4627.10330031108324-0.64130031108324
146.4017.01880322410991-0.617803224109913
156.467.05842670506744-0.598426705067436
166.5197.06034710375397-0.541347103753971
176.5427.14599789828969-0.60399789828969
186.6377.0647108009792-0.427710800979193
197.1147.43066383906415-0.316663839064148
207.5797.54694077746750.0320592225324994
217.4087.31085118649120.097148813508795
228.2437.44816592836870.794834071631293
238.2437.196392734213961.04660726578604
248.4347.204291814619961.22970818538004
258.5767.527607326752721.04839267324728
268.587.47977468735431.10022531264570
278.6457.636545549587741.00845445041226
288.667.624157871171871.03584212882813
298.727.518438134462961.20156186553704
308.7877.64461815513731.14238184486270
319.1628.019513741411261.14248625858875
329.1448.174243637027320.969756362972686
338.8067.941731065326620.864268934673379
348.7787.815240635628570.962759364371426
358.667.591189340859731.06881065914027
368.8267.748428976022061.07757102397794
378.6098.137025089934530.471974910065472
388.6287.996189949370490.631810050629509
398.6197.99467770865860.624322291341392
408.7758.190651403046480.584348596953523
418.848.175251403046480.664748596953523
428.7458.115426421389580.629573578610415
439.0928.547554316073150.544445683926849
448.9348.534164305735980.399835694264019
458.7498.012807427530530.736192572469466
468.2987.873797430367890.424202569632112
478.0677.765105007237170.301894992762834
487.9697.9724229122579-0.00342291225790253
497.9997.95860435766530.0403956423347012
507.8658.0001972001569-0.135197200156894
517.7468.04876322930342-0.302763229303419
527.6338.16872526408478-0.535725264084775
537.4588.13991144180127-0.681911441801273
547.3918.2043878799715-0.813387879971502
557.8568.67407447704888-0.818074477048876
567.728.5927211004753-0.872721100475294
577.2978.55515607929483-1.25815607929483
587.1238.72555824947164-1.60255824947164
597.0048.90213311357007-1.89813311357007
607.1518.95474493492108-1.80374493492108

\begin{tabular}{lllllllll}
\hline
Multiple Linear Regression - Actuals, Interpolation, and Residuals \tabularnewline
Time or Index & Actuals & InterpolationForecast & ResidualsPrediction Error \tabularnewline
1 & 6.06 & 6.97946291456422 & -0.919462914564217 \tabularnewline
2 & 5.983 & 6.9620349390084 & -0.979034939008404 \tabularnewline
3 & 6.11 & 6.8415868073828 & -0.731586807382796 \tabularnewline
4 & 6.143 & 6.6861183579429 & -0.543118357942903 \tabularnewline
5 & 6.093 & 6.6734011223996 & -0.580401122399603 \tabularnewline
6 & 6.148 & 6.67885674252242 & -0.530856742522422 \tabularnewline
7 & 6.464 & 7.01619362640257 & -0.552193626402571 \tabularnewline
8 & 6.532 & 7.06093017929391 & -0.528930179293911 \tabularnewline
9 & 6.321 & 6.7604542413568 & -0.439454241356806 \tabularnewline
10 & 6.23 & 6.80923775616319 & -0.579237756163191 \tabularnewline
11 & 6.176 & 6.69517980411907 & -0.519179804119069 \tabularnewline
12 & 6.338 & 6.838111362179 & -0.500111362178994 \tabularnewline
13 & 6.462 & 7.10330031108324 & -0.64130031108324 \tabularnewline
14 & 6.401 & 7.01880322410991 & -0.617803224109913 \tabularnewline
15 & 6.46 & 7.05842670506744 & -0.598426705067436 \tabularnewline
16 & 6.519 & 7.06034710375397 & -0.541347103753971 \tabularnewline
17 & 6.542 & 7.14599789828969 & -0.60399789828969 \tabularnewline
18 & 6.637 & 7.0647108009792 & -0.427710800979193 \tabularnewline
19 & 7.114 & 7.43066383906415 & -0.316663839064148 \tabularnewline
20 & 7.579 & 7.5469407774675 & 0.0320592225324994 \tabularnewline
21 & 7.408 & 7.3108511864912 & 0.097148813508795 \tabularnewline
22 & 8.243 & 7.4481659283687 & 0.794834071631293 \tabularnewline
23 & 8.243 & 7.19639273421396 & 1.04660726578604 \tabularnewline
24 & 8.434 & 7.20429181461996 & 1.22970818538004 \tabularnewline
25 & 8.576 & 7.52760732675272 & 1.04839267324728 \tabularnewline
26 & 8.58 & 7.4797746873543 & 1.10022531264570 \tabularnewline
27 & 8.645 & 7.63654554958774 & 1.00845445041226 \tabularnewline
28 & 8.66 & 7.62415787117187 & 1.03584212882813 \tabularnewline
29 & 8.72 & 7.51843813446296 & 1.20156186553704 \tabularnewline
30 & 8.787 & 7.6446181551373 & 1.14238184486270 \tabularnewline
31 & 9.162 & 8.01951374141126 & 1.14248625858875 \tabularnewline
32 & 9.144 & 8.17424363702732 & 0.969756362972686 \tabularnewline
33 & 8.806 & 7.94173106532662 & 0.864268934673379 \tabularnewline
34 & 8.778 & 7.81524063562857 & 0.962759364371426 \tabularnewline
35 & 8.66 & 7.59118934085973 & 1.06881065914027 \tabularnewline
36 & 8.826 & 7.74842897602206 & 1.07757102397794 \tabularnewline
37 & 8.609 & 8.13702508993453 & 0.471974910065472 \tabularnewline
38 & 8.628 & 7.99618994937049 & 0.631810050629509 \tabularnewline
39 & 8.619 & 7.9946777086586 & 0.624322291341392 \tabularnewline
40 & 8.775 & 8.19065140304648 & 0.584348596953523 \tabularnewline
41 & 8.84 & 8.17525140304648 & 0.664748596953523 \tabularnewline
42 & 8.745 & 8.11542642138958 & 0.629573578610415 \tabularnewline
43 & 9.092 & 8.54755431607315 & 0.544445683926849 \tabularnewline
44 & 8.934 & 8.53416430573598 & 0.399835694264019 \tabularnewline
45 & 8.749 & 8.01280742753053 & 0.736192572469466 \tabularnewline
46 & 8.298 & 7.87379743036789 & 0.424202569632112 \tabularnewline
47 & 8.067 & 7.76510500723717 & 0.301894992762834 \tabularnewline
48 & 7.969 & 7.9724229122579 & -0.00342291225790253 \tabularnewline
49 & 7.999 & 7.9586043576653 & 0.0403956423347012 \tabularnewline
50 & 7.865 & 8.0001972001569 & -0.135197200156894 \tabularnewline
51 & 7.746 & 8.04876322930342 & -0.302763229303419 \tabularnewline
52 & 7.633 & 8.16872526408478 & -0.535725264084775 \tabularnewline
53 & 7.458 & 8.13991144180127 & -0.681911441801273 \tabularnewline
54 & 7.391 & 8.2043878799715 & -0.813387879971502 \tabularnewline
55 & 7.856 & 8.67407447704888 & -0.818074477048876 \tabularnewline
56 & 7.72 & 8.5927211004753 & -0.872721100475294 \tabularnewline
57 & 7.297 & 8.55515607929483 & -1.25815607929483 \tabularnewline
58 & 7.123 & 8.72555824947164 & -1.60255824947164 \tabularnewline
59 & 7.004 & 8.90213311357007 & -1.89813311357007 \tabularnewline
60 & 7.151 & 8.95474493492108 & -1.80374493492108 \tabularnewline
\hline
\end{tabular}
%Source: https://freestatistics.org/blog/index.php?pk=25587&T=4

[TABLE]
[ROW][C]Multiple Linear Regression - Actuals, Interpolation, and Residuals[/C][/ROW]
[ROW][C]Time or Index[/C][C]Actuals[/C][C]InterpolationForecast[/C][C]ResidualsPrediction Error[/C][/ROW]
[ROW][C]1[/C][C]6.06[/C][C]6.97946291456422[/C][C]-0.919462914564217[/C][/ROW]
[ROW][C]2[/C][C]5.983[/C][C]6.9620349390084[/C][C]-0.979034939008404[/C][/ROW]
[ROW][C]3[/C][C]6.11[/C][C]6.8415868073828[/C][C]-0.731586807382796[/C][/ROW]
[ROW][C]4[/C][C]6.143[/C][C]6.6861183579429[/C][C]-0.543118357942903[/C][/ROW]
[ROW][C]5[/C][C]6.093[/C][C]6.6734011223996[/C][C]-0.580401122399603[/C][/ROW]
[ROW][C]6[/C][C]6.148[/C][C]6.67885674252242[/C][C]-0.530856742522422[/C][/ROW]
[ROW][C]7[/C][C]6.464[/C][C]7.01619362640257[/C][C]-0.552193626402571[/C][/ROW]
[ROW][C]8[/C][C]6.532[/C][C]7.06093017929391[/C][C]-0.528930179293911[/C][/ROW]
[ROW][C]9[/C][C]6.321[/C][C]6.7604542413568[/C][C]-0.439454241356806[/C][/ROW]
[ROW][C]10[/C][C]6.23[/C][C]6.80923775616319[/C][C]-0.579237756163191[/C][/ROW]
[ROW][C]11[/C][C]6.176[/C][C]6.69517980411907[/C][C]-0.519179804119069[/C][/ROW]
[ROW][C]12[/C][C]6.338[/C][C]6.838111362179[/C][C]-0.500111362178994[/C][/ROW]
[ROW][C]13[/C][C]6.462[/C][C]7.10330031108324[/C][C]-0.64130031108324[/C][/ROW]
[ROW][C]14[/C][C]6.401[/C][C]7.01880322410991[/C][C]-0.617803224109913[/C][/ROW]
[ROW][C]15[/C][C]6.46[/C][C]7.05842670506744[/C][C]-0.598426705067436[/C][/ROW]
[ROW][C]16[/C][C]6.519[/C][C]7.06034710375397[/C][C]-0.541347103753971[/C][/ROW]
[ROW][C]17[/C][C]6.542[/C][C]7.14599789828969[/C][C]-0.60399789828969[/C][/ROW]
[ROW][C]18[/C][C]6.637[/C][C]7.0647108009792[/C][C]-0.427710800979193[/C][/ROW]
[ROW][C]19[/C][C]7.114[/C][C]7.43066383906415[/C][C]-0.316663839064148[/C][/ROW]
[ROW][C]20[/C][C]7.579[/C][C]7.5469407774675[/C][C]0.0320592225324994[/C][/ROW]
[ROW][C]21[/C][C]7.408[/C][C]7.3108511864912[/C][C]0.097148813508795[/C][/ROW]
[ROW][C]22[/C][C]8.243[/C][C]7.4481659283687[/C][C]0.794834071631293[/C][/ROW]
[ROW][C]23[/C][C]8.243[/C][C]7.19639273421396[/C][C]1.04660726578604[/C][/ROW]
[ROW][C]24[/C][C]8.434[/C][C]7.20429181461996[/C][C]1.22970818538004[/C][/ROW]
[ROW][C]25[/C][C]8.576[/C][C]7.52760732675272[/C][C]1.04839267324728[/C][/ROW]
[ROW][C]26[/C][C]8.58[/C][C]7.4797746873543[/C][C]1.10022531264570[/C][/ROW]
[ROW][C]27[/C][C]8.645[/C][C]7.63654554958774[/C][C]1.00845445041226[/C][/ROW]
[ROW][C]28[/C][C]8.66[/C][C]7.62415787117187[/C][C]1.03584212882813[/C][/ROW]
[ROW][C]29[/C][C]8.72[/C][C]7.51843813446296[/C][C]1.20156186553704[/C][/ROW]
[ROW][C]30[/C][C]8.787[/C][C]7.6446181551373[/C][C]1.14238184486270[/C][/ROW]
[ROW][C]31[/C][C]9.162[/C][C]8.01951374141126[/C][C]1.14248625858875[/C][/ROW]
[ROW][C]32[/C][C]9.144[/C][C]8.17424363702732[/C][C]0.969756362972686[/C][/ROW]
[ROW][C]33[/C][C]8.806[/C][C]7.94173106532662[/C][C]0.864268934673379[/C][/ROW]
[ROW][C]34[/C][C]8.778[/C][C]7.81524063562857[/C][C]0.962759364371426[/C][/ROW]
[ROW][C]35[/C][C]8.66[/C][C]7.59118934085973[/C][C]1.06881065914027[/C][/ROW]
[ROW][C]36[/C][C]8.826[/C][C]7.74842897602206[/C][C]1.07757102397794[/C][/ROW]
[ROW][C]37[/C][C]8.609[/C][C]8.13702508993453[/C][C]0.471974910065472[/C][/ROW]
[ROW][C]38[/C][C]8.628[/C][C]7.99618994937049[/C][C]0.631810050629509[/C][/ROW]
[ROW][C]39[/C][C]8.619[/C][C]7.9946777086586[/C][C]0.624322291341392[/C][/ROW]
[ROW][C]40[/C][C]8.775[/C][C]8.19065140304648[/C][C]0.584348596953523[/C][/ROW]
[ROW][C]41[/C][C]8.84[/C][C]8.17525140304648[/C][C]0.664748596953523[/C][/ROW]
[ROW][C]42[/C][C]8.745[/C][C]8.11542642138958[/C][C]0.629573578610415[/C][/ROW]
[ROW][C]43[/C][C]9.092[/C][C]8.54755431607315[/C][C]0.544445683926849[/C][/ROW]
[ROW][C]44[/C][C]8.934[/C][C]8.53416430573598[/C][C]0.399835694264019[/C][/ROW]
[ROW][C]45[/C][C]8.749[/C][C]8.01280742753053[/C][C]0.736192572469466[/C][/ROW]
[ROW][C]46[/C][C]8.298[/C][C]7.87379743036789[/C][C]0.424202569632112[/C][/ROW]
[ROW][C]47[/C][C]8.067[/C][C]7.76510500723717[/C][C]0.301894992762834[/C][/ROW]
[ROW][C]48[/C][C]7.969[/C][C]7.9724229122579[/C][C]-0.00342291225790253[/C][/ROW]
[ROW][C]49[/C][C]7.999[/C][C]7.9586043576653[/C][C]0.0403956423347012[/C][/ROW]
[ROW][C]50[/C][C]7.865[/C][C]8.0001972001569[/C][C]-0.135197200156894[/C][/ROW]
[ROW][C]51[/C][C]7.746[/C][C]8.04876322930342[/C][C]-0.302763229303419[/C][/ROW]
[ROW][C]52[/C][C]7.633[/C][C]8.16872526408478[/C][C]-0.535725264084775[/C][/ROW]
[ROW][C]53[/C][C]7.458[/C][C]8.13991144180127[/C][C]-0.681911441801273[/C][/ROW]
[ROW][C]54[/C][C]7.391[/C][C]8.2043878799715[/C][C]-0.813387879971502[/C][/ROW]
[ROW][C]55[/C][C]7.856[/C][C]8.67407447704888[/C][C]-0.818074477048876[/C][/ROW]
[ROW][C]56[/C][C]7.72[/C][C]8.5927211004753[/C][C]-0.872721100475294[/C][/ROW]
[ROW][C]57[/C][C]7.297[/C][C]8.55515607929483[/C][C]-1.25815607929483[/C][/ROW]
[ROW][C]58[/C][C]7.123[/C][C]8.72555824947164[/C][C]-1.60255824947164[/C][/ROW]
[ROW][C]59[/C][C]7.004[/C][C]8.90213311357007[/C][C]-1.89813311357007[/C][/ROW]
[ROW][C]60[/C][C]7.151[/C][C]8.95474493492108[/C][C]-1.80374493492108[/C][/ROW]
[/TABLE]
Source: https://freestatistics.org/blog/index.php?pk=25587&T=4

Globally Unique Identifier (entire table): ba.freestatistics.org/blog/index.php?pk=25587&T=4

As an alternative you can also use a QR Code:  

The GUIDs for individual cells are displayed in the table below:

Multiple Linear Regression - Actuals, Interpolation, and Residuals
Time or IndexActualsInterpolationForecastResidualsPrediction Error
16.066.97946291456422-0.919462914564217
25.9836.9620349390084-0.979034939008404
36.116.8415868073828-0.731586807382796
46.1436.6861183579429-0.543118357942903
56.0936.6734011223996-0.580401122399603
66.1486.67885674252242-0.530856742522422
76.4647.01619362640257-0.552193626402571
86.5327.06093017929391-0.528930179293911
96.3216.7604542413568-0.439454241356806
106.236.80923775616319-0.579237756163191
116.1766.69517980411907-0.519179804119069
126.3386.838111362179-0.500111362178994
136.4627.10330031108324-0.64130031108324
146.4017.01880322410991-0.617803224109913
156.467.05842670506744-0.598426705067436
166.5197.06034710375397-0.541347103753971
176.5427.14599789828969-0.60399789828969
186.6377.0647108009792-0.427710800979193
197.1147.43066383906415-0.316663839064148
207.5797.54694077746750.0320592225324994
217.4087.31085118649120.097148813508795
228.2437.44816592836870.794834071631293
238.2437.196392734213961.04660726578604
248.4347.204291814619961.22970818538004
258.5767.527607326752721.04839267324728
268.587.47977468735431.10022531264570
278.6457.636545549587741.00845445041226
288.667.624157871171871.03584212882813
298.727.518438134462961.20156186553704
308.7877.64461815513731.14238184486270
319.1628.019513741411261.14248625858875
329.1448.174243637027320.969756362972686
338.8067.941731065326620.864268934673379
348.7787.815240635628570.962759364371426
358.667.591189340859731.06881065914027
368.8267.748428976022061.07757102397794
378.6098.137025089934530.471974910065472
388.6287.996189949370490.631810050629509
398.6197.99467770865860.624322291341392
408.7758.190651403046480.584348596953523
418.848.175251403046480.664748596953523
428.7458.115426421389580.629573578610415
439.0928.547554316073150.544445683926849
448.9348.534164305735980.399835694264019
458.7498.012807427530530.736192572469466
468.2987.873797430367890.424202569632112
478.0677.765105007237170.301894992762834
487.9697.9724229122579-0.00342291225790253
497.9997.95860435766530.0403956423347012
507.8658.0001972001569-0.135197200156894
517.7468.04876322930342-0.302763229303419
527.6338.16872526408478-0.535725264084775
537.4588.13991144180127-0.681911441801273
547.3918.2043878799715-0.813387879971502
557.8568.67407447704888-0.818074477048876
567.728.5927211004753-0.872721100475294
577.2978.55515607929483-1.25815607929483
587.1238.72555824947164-1.60255824947164
597.0048.90213311357007-1.89813311357007
607.1518.95474493492108-1.80374493492108


Goldfeld-Quandt test for Heteroskedasticity
p-valuesAlternative Hypothesis
breakpoint indexgreater2-sidedless
170.0001036500338126280.0002073000676252560.999896349966187
181.99787746941637e-053.99575493883274e-050.999980021225306
198.03442605757157e-050.0001606885211514310.999919655739424
200.002704420679186920.005408841358373850.997295579320813
210.007649822703639620.01529964540727920.99235017729636
220.1375718990045140.2751437980090270.862428100995486
230.4214208946065390.8428417892130780.578579105393461
240.768492898726780.4630142025464390.231507101273220
250.8955880147636470.2088239704727060.104411985236353
260.9437071696974450.1125856606051100.0562928303025548
270.9446916361373660.1106167277252690.0553083638626344
280.949650008460090.1006999830798200.0503499915399102
290.9594961593273330.08100768134533330.0405038406726666
300.9557130597721260.08857388045574710.0442869402278736
310.9626869928996540.07462601420069230.0373130071003461
320.9698301287144220.06033974257115680.0301698712855784
330.9872160059523170.02556798809536660.0127839940476833
340.9891068596018720.02178628079625510.0108931403981276
350.9910939138815260.01781217223694730.00890608611847366
360.9917754703084620.01644905938307510.00822452969153757
370.9976323768098540.004735246380292670.00236762319014633
380.9988931788294370.002213642341125640.00110682117056282
390.9995105390004360.0009789219991272650.000489460999563632
400.9991171850628880.001765629874223790.000882814937111896
410.9966227709747760.006754458050447620.00337722902522381
420.9877563146417440.02448737071651160.0122436853582558
430.9584530068944220.08309398621115640.0415469931055782

\begin{tabular}{lllllllll}
\hline
Goldfeld-Quandt test for Heteroskedasticity \tabularnewline
p-values & Alternative Hypothesis \tabularnewline
breakpoint index & greater & 2-sided & less \tabularnewline
17 & 0.000103650033812628 & 0.000207300067625256 & 0.999896349966187 \tabularnewline
18 & 1.99787746941637e-05 & 3.99575493883274e-05 & 0.999980021225306 \tabularnewline
19 & 8.03442605757157e-05 & 0.000160688521151431 & 0.999919655739424 \tabularnewline
20 & 0.00270442067918692 & 0.00540884135837385 & 0.997295579320813 \tabularnewline
21 & 0.00764982270363962 & 0.0152996454072792 & 0.99235017729636 \tabularnewline
22 & 0.137571899004514 & 0.275143798009027 & 0.862428100995486 \tabularnewline
23 & 0.421420894606539 & 0.842841789213078 & 0.578579105393461 \tabularnewline
24 & 0.76849289872678 & 0.463014202546439 & 0.231507101273220 \tabularnewline
25 & 0.895588014763647 & 0.208823970472706 & 0.104411985236353 \tabularnewline
26 & 0.943707169697445 & 0.112585660605110 & 0.0562928303025548 \tabularnewline
27 & 0.944691636137366 & 0.110616727725269 & 0.0553083638626344 \tabularnewline
28 & 0.94965000846009 & 0.100699983079820 & 0.0503499915399102 \tabularnewline
29 & 0.959496159327333 & 0.0810076813453333 & 0.0405038406726666 \tabularnewline
30 & 0.955713059772126 & 0.0885738804557471 & 0.0442869402278736 \tabularnewline
31 & 0.962686992899654 & 0.0746260142006923 & 0.0373130071003461 \tabularnewline
32 & 0.969830128714422 & 0.0603397425711568 & 0.0301698712855784 \tabularnewline
33 & 0.987216005952317 & 0.0255679880953666 & 0.0127839940476833 \tabularnewline
34 & 0.989106859601872 & 0.0217862807962551 & 0.0108931403981276 \tabularnewline
35 & 0.991093913881526 & 0.0178121722369473 & 0.00890608611847366 \tabularnewline
36 & 0.991775470308462 & 0.0164490593830751 & 0.00822452969153757 \tabularnewline
37 & 0.997632376809854 & 0.00473524638029267 & 0.00236762319014633 \tabularnewline
38 & 0.998893178829437 & 0.00221364234112564 & 0.00110682117056282 \tabularnewline
39 & 0.999510539000436 & 0.000978921999127265 & 0.000489460999563632 \tabularnewline
40 & 0.999117185062888 & 0.00176562987422379 & 0.000882814937111896 \tabularnewline
41 & 0.996622770974776 & 0.00675445805044762 & 0.00337722902522381 \tabularnewline
42 & 0.987756314641744 & 0.0244873707165116 & 0.0122436853582558 \tabularnewline
43 & 0.958453006894422 & 0.0830939862111564 & 0.0415469931055782 \tabularnewline
\hline
\end{tabular}
%Source: https://freestatistics.org/blog/index.php?pk=25587&T=5

[TABLE]
[ROW][C]Goldfeld-Quandt test for Heteroskedasticity[/C][/ROW]
[ROW][C]p-values[/C][C]Alternative Hypothesis[/C][/ROW]
[ROW][C]breakpoint index[/C][C]greater[/C][C]2-sided[/C][C]less[/C][/ROW]
[ROW][C]17[/C][C]0.000103650033812628[/C][C]0.000207300067625256[/C][C]0.999896349966187[/C][/ROW]
[ROW][C]18[/C][C]1.99787746941637e-05[/C][C]3.99575493883274e-05[/C][C]0.999980021225306[/C][/ROW]
[ROW][C]19[/C][C]8.03442605757157e-05[/C][C]0.000160688521151431[/C][C]0.999919655739424[/C][/ROW]
[ROW][C]20[/C][C]0.00270442067918692[/C][C]0.00540884135837385[/C][C]0.997295579320813[/C][/ROW]
[ROW][C]21[/C][C]0.00764982270363962[/C][C]0.0152996454072792[/C][C]0.99235017729636[/C][/ROW]
[ROW][C]22[/C][C]0.137571899004514[/C][C]0.275143798009027[/C][C]0.862428100995486[/C][/ROW]
[ROW][C]23[/C][C]0.421420894606539[/C][C]0.842841789213078[/C][C]0.578579105393461[/C][/ROW]
[ROW][C]24[/C][C]0.76849289872678[/C][C]0.463014202546439[/C][C]0.231507101273220[/C][/ROW]
[ROW][C]25[/C][C]0.895588014763647[/C][C]0.208823970472706[/C][C]0.104411985236353[/C][/ROW]
[ROW][C]26[/C][C]0.943707169697445[/C][C]0.112585660605110[/C][C]0.0562928303025548[/C][/ROW]
[ROW][C]27[/C][C]0.944691636137366[/C][C]0.110616727725269[/C][C]0.0553083638626344[/C][/ROW]
[ROW][C]28[/C][C]0.94965000846009[/C][C]0.100699983079820[/C][C]0.0503499915399102[/C][/ROW]
[ROW][C]29[/C][C]0.959496159327333[/C][C]0.0810076813453333[/C][C]0.0405038406726666[/C][/ROW]
[ROW][C]30[/C][C]0.955713059772126[/C][C]0.0885738804557471[/C][C]0.0442869402278736[/C][/ROW]
[ROW][C]31[/C][C]0.962686992899654[/C][C]0.0746260142006923[/C][C]0.0373130071003461[/C][/ROW]
[ROW][C]32[/C][C]0.969830128714422[/C][C]0.0603397425711568[/C][C]0.0301698712855784[/C][/ROW]
[ROW][C]33[/C][C]0.987216005952317[/C][C]0.0255679880953666[/C][C]0.0127839940476833[/C][/ROW]
[ROW][C]34[/C][C]0.989106859601872[/C][C]0.0217862807962551[/C][C]0.0108931403981276[/C][/ROW]
[ROW][C]35[/C][C]0.991093913881526[/C][C]0.0178121722369473[/C][C]0.00890608611847366[/C][/ROW]
[ROW][C]36[/C][C]0.991775470308462[/C][C]0.0164490593830751[/C][C]0.00822452969153757[/C][/ROW]
[ROW][C]37[/C][C]0.997632376809854[/C][C]0.00473524638029267[/C][C]0.00236762319014633[/C][/ROW]
[ROW][C]38[/C][C]0.998893178829437[/C][C]0.00221364234112564[/C][C]0.00110682117056282[/C][/ROW]
[ROW][C]39[/C][C]0.999510539000436[/C][C]0.000978921999127265[/C][C]0.000489460999563632[/C][/ROW]
[ROW][C]40[/C][C]0.999117185062888[/C][C]0.00176562987422379[/C][C]0.000882814937111896[/C][/ROW]
[ROW][C]41[/C][C]0.996622770974776[/C][C]0.00675445805044762[/C][C]0.00337722902522381[/C][/ROW]
[ROW][C]42[/C][C]0.987756314641744[/C][C]0.0244873707165116[/C][C]0.0122436853582558[/C][/ROW]
[ROW][C]43[/C][C]0.958453006894422[/C][C]0.0830939862111564[/C][C]0.0415469931055782[/C][/ROW]
[/TABLE]
Source: https://freestatistics.org/blog/index.php?pk=25587&T=5

Globally Unique Identifier (entire table): ba.freestatistics.org/blog/index.php?pk=25587&T=5

As an alternative you can also use a QR Code:  

The GUIDs for individual cells are displayed in the table below:

Goldfeld-Quandt test for Heteroskedasticity
p-valuesAlternative Hypothesis
breakpoint indexgreater2-sidedless
170.0001036500338126280.0002073000676252560.999896349966187
181.99787746941637e-053.99575493883274e-050.999980021225306
198.03442605757157e-050.0001606885211514310.999919655739424
200.002704420679186920.005408841358373850.997295579320813
210.007649822703639620.01529964540727920.99235017729636
220.1375718990045140.2751437980090270.862428100995486
230.4214208946065390.8428417892130780.578579105393461
240.768492898726780.4630142025464390.231507101273220
250.8955880147636470.2088239704727060.104411985236353
260.9437071696974450.1125856606051100.0562928303025548
270.9446916361373660.1106167277252690.0553083638626344
280.949650008460090.1006999830798200.0503499915399102
290.9594961593273330.08100768134533330.0405038406726666
300.9557130597721260.08857388045574710.0442869402278736
310.9626869928996540.07462601420069230.0373130071003461
320.9698301287144220.06033974257115680.0301698712855784
330.9872160059523170.02556798809536660.0127839940476833
340.9891068596018720.02178628079625510.0108931403981276
350.9910939138815260.01781217223694730.00890608611847366
360.9917754703084620.01644905938307510.00822452969153757
370.9976323768098540.004735246380292670.00236762319014633
380.9988931788294370.002213642341125640.00110682117056282
390.9995105390004360.0009789219991272650.000489460999563632
400.9991171850628880.001765629874223790.000882814937111896
410.9966227709747760.006754458050447620.00337722902522381
420.9877563146417440.02448737071651160.0122436853582558
430.9584530068944220.08309398621115640.0415469931055782


Meta Analysis of Goldfeld-Quandt test for Heteroskedasticity
Description# significant tests% significant testsOK/NOK
1% type I error level90.333333333333333NOK
5% type I error level150.555555555555556NOK
10% type I error level200.740740740740741NOK

\begin{tabular}{lllllllll}
\hline
Meta Analysis of Goldfeld-Quandt test for Heteroskedasticity \tabularnewline
Description & # significant tests & % significant tests & OK/NOK \tabularnewline
1% type I error level & 9 & 0.333333333333333 & NOK \tabularnewline
5% type I error level & 15 & 0.555555555555556 & NOK \tabularnewline
10% type I error level & 20 & 0.740740740740741 & NOK \tabularnewline
\hline
\end{tabular}
%Source: https://freestatistics.org/blog/index.php?pk=25587&T=6

[TABLE]
[ROW][C]Meta Analysis of Goldfeld-Quandt test for Heteroskedasticity[/C][/ROW]
[ROW][C]Description[/C][C]# significant tests[/C][C]% significant tests[/C][C]OK/NOK[/C][/ROW]
[ROW][C]1% type I error level[/C][C]9[/C][C]0.333333333333333[/C][C]NOK[/C][/ROW]
[ROW][C]5% type I error level[/C][C]15[/C][C]0.555555555555556[/C][C]NOK[/C][/ROW]
[ROW][C]10% type I error level[/C][C]20[/C][C]0.740740740740741[/C][C]NOK[/C][/ROW]
[/TABLE]
Source: https://freestatistics.org/blog/index.php?pk=25587&T=6

Globally Unique Identifier (entire table): ba.freestatistics.org/blog/index.php?pk=25587&T=6

As an alternative you can also use a QR Code:  

The GUIDs for individual cells are displayed in the table below:

Meta Analysis of Goldfeld-Quandt test for Heteroskedasticity
Description# significant tests% significant testsOK/NOK
1% type I error level90.333333333333333NOK
5% type I error level150.555555555555556NOK
10% type I error level200.740740740740741NOK


Parameters (Session):
par1 = 1 ; par2 = Include Monthly Dummies ; par3 = Linear Trend ;
Parameters (R input):
par1 = 1 ; par2 = Include Monthly Dummies ; par3 = Linear Trend ;
R code (references can be found in the software module):
library(lattice)
library(lmtest)
n25 <- 25 #minimum number of obs. for Goldfeld-Quandt test
par1 <- as.numeric(par1)
x <- t(y)
k <- length(x[1,])
n <- length(x[,1])
x1 <- cbind(x[,par1], x[,1:k!=par1])
mycolnames <- c(colnames(x)[par1], colnames(x)[1:k!=par1])
colnames(x1) <- mycolnames #colnames(x)[par1]
x <- x1
if (par3 == 'First Differences'){
x2 <- array(0, dim=c(n-1,k), dimnames=list(1:(n-1), paste('(1-B)',colnames(x),sep='')))
for (i in 1:n-1) {
for (j in 1:k) {
x2[i,j] <- x[i+1,j] - x[i,j]
}
}
x <- x2
}
if (par2 == 'Include Monthly Dummies'){
x2 <- array(0, dim=c(n,11), dimnames=list(1:n, paste('M', seq(1:11), sep ='')))
for (i in 1:11){
x2[seq(i,n,12),i] <- 1
}
x <- cbind(x, x2)
}
if (par2 == 'Include Quarterly Dummies'){
x2 <- array(0, dim=c(n,3), dimnames=list(1:n, paste('Q', seq(1:3), sep ='')))
for (i in 1:3){
x2[seq(i,n,4),i] <- 1
}
x <- cbind(x, x2)
}
k <- length(x[1,])
if (par3 == 'Linear Trend'){
x <- cbind(x, c(1:n))
colnames(x)[k+1] <- 't'
}
x
k <- length(x[1,])
df <- as.data.frame(x)
(mylm <- lm(df))
(mysum <- summary(mylm))
if (n > n25) {
kp3 <- k + 3
nmkm3 <- n - k - 3
gqarr <- array(NA, dim=c(nmkm3-kp3+1,3))
numgqtests <- 0
numsignificant1 <- 0
numsignificant5 <- 0
numsignificant10 <- 0
for (mypoint in kp3:nmkm3) {
j <- 0
numgqtests <- numgqtests + 1
for (myalt in c('greater', 'two.sided', 'less')) {
j <- j + 1
gqarr[mypoint-kp3+1,j] <- gqtest(mylm, point=mypoint, alternative=myalt)$p.value
}
if (gqarr[mypoint-kp3+1,2] < 0.01) numsignificant1 <- numsignificant1 + 1
if (gqarr[mypoint-kp3+1,2] < 0.05) numsignificant5 <- numsignificant5 + 1
if (gqarr[mypoint-kp3+1,2] < 0.10) numsignificant10 <- numsignificant10 + 1
}
gqarr
}
bitmap(file='test0.png')
plot(x[,1], type='l', main='Actuals and Interpolation', ylab='value of Actuals and Interpolation (dots)', xlab='time or index')
points(x[,1]-mysum$resid)
grid()
dev.off()
bitmap(file='test1.png')
plot(mysum$resid, type='b', pch=19, main='Residuals', ylab='value of Residuals', xlab='time or index')
grid()
dev.off()
bitmap(file='test2.png')
hist(mysum$resid, main='Residual Histogram', xlab='values of Residuals')
grid()
dev.off()
bitmap(file='test3.png')
densityplot(~mysum$resid,col='black',main='Residual Density Plot', xlab='values of Residuals')
dev.off()
bitmap(file='test4.png')
qqnorm(mysum$resid, main='Residual Normal Q-Q Plot')
qqline(mysum$resid)
grid()
dev.off()
(myerror <- as.ts(mysum$resid))
bitmap(file='test5.png')
dum <- cbind(lag(myerror,k=1),myerror)
dum
dum1 <- dum[2:length(myerror),]
dum1
z <- as.data.frame(dum1)
z
plot(z,main=paste('Residual Lag plot, lowess, and regression line'), ylab='values of Residuals', xlab='lagged values of Residuals')
lines(lowess(z))
abline(lm(z))
grid()
dev.off()
bitmap(file='test6.png')
acf(mysum$resid, lag.max=length(mysum$resid)/2, main='Residual Autocorrelation Function')
grid()
dev.off()
bitmap(file='test7.png')
pacf(mysum$resid, lag.max=length(mysum$resid)/2, main='Residual Partial Autocorrelation Function')
grid()
dev.off()
bitmap(file='test8.png')
opar <- par(mfrow = c(2,2), oma = c(0, 0, 1.1, 0))
plot(mylm, las = 1, sub='Residual Diagnostics')
par(opar)
dev.off()
if (n > n25) {
bitmap(file='test9.png')
plot(kp3:nmkm3,gqarr[,2], main='Goldfeld-Quandt test',ylab='2-sided p-value',xlab='breakpoint')
grid()
dev.off()
}
load(file='createtable')
a<-table.start()
a<-table.row.start(a)
a<-table.element(a, 'Multiple Linear Regression - Estimated Regression Equation', 1, TRUE)
a<-table.row.end(a)
myeq <- colnames(x)[1]
myeq <- paste(myeq, '[t] = ', sep='')
for (i in 1:k){
if (mysum$coefficients[i,1] > 0) myeq <- paste(myeq, '+', '')
myeq <- paste(myeq, mysum$coefficients[i,1], sep=' ')
if (rownames(mysum$coefficients)[i] != '(Intercept)') {
myeq <- paste(myeq, rownames(mysum$coefficients)[i], sep='')
if (rownames(mysum$coefficients)[i] != 't') myeq <- paste(myeq, '[t]', sep='')
}
}
myeq <- paste(myeq, ' + e[t]')
a<-table.row.start(a)
a<-table.element(a, myeq)
a<-table.row.end(a)
a<-table.end(a)
table.save(a,file='mytable1.tab')
a<-table.start()
a<-table.row.start(a)
a<-table.element(a,hyperlink('ols1.htm','Multiple Linear Regression - Ordinary Least Squares',''), 6, TRUE)
a<-table.row.end(a)
a<-table.row.start(a)
a<-table.element(a,'Variable',header=TRUE)
a<-table.element(a,'Parameter',header=TRUE)
a<-table.element(a,'S.D.',header=TRUE)
a<-table.element(a,'T-STAT
H0: parameter = 0',header=TRUE)
a<-table.element(a,'2-tail p-value',header=TRUE)
a<-table.element(a,'1-tail p-value',header=TRUE)
a<-table.row.end(a)
for (i in 1:k){
a<-table.row.start(a)
a<-table.element(a,rownames(mysum$coefficients)[i],header=TRUE)
a<-table.element(a,mysum$coefficients[i,1])
a<-table.element(a, round(mysum$coefficients[i,2],6))
a<-table.element(a, round(mysum$coefficients[i,3],4))
a<-table.element(a, round(mysum$coefficients[i,4],6))
a<-table.element(a, round(mysum$coefficients[i,4]/2,6))
a<-table.row.end(a)
}
a<-table.end(a)
table.save(a,file='mytable2.tab')
a<-table.start()
a<-table.row.start(a)
a<-table.element(a, 'Multiple Linear Regression - Regression Statistics', 2, TRUE)
a<-table.row.end(a)
a<-table.row.start(a)
a<-table.element(a, 'Multiple R',1,TRUE)
a<-table.element(a, sqrt(mysum$r.squared))
a<-table.row.end(a)
a<-table.row.start(a)
a<-table.element(a, 'R-squared',1,TRUE)
a<-table.element(a, mysum$r.squared)
a<-table.row.end(a)
a<-table.row.start(a)
a<-table.element(a, 'Adjusted R-squared',1,TRUE)
a<-table.element(a, mysum$adj.r.squared)
a<-table.row.end(a)
a<-table.row.start(a)
a<-table.element(a, 'F-TEST (value)',1,TRUE)
a<-table.element(a, mysum$fstatistic[1])
a<-table.row.end(a)
a<-table.row.start(a)
a<-table.element(a, 'F-TEST (DF numerator)',1,TRUE)
a<-table.element(a, mysum$fstatistic[2])
a<-table.row.end(a)
a<-table.row.start(a)
a<-table.element(a, 'F-TEST (DF denominator)',1,TRUE)
a<-table.element(a, mysum$fstatistic[3])
a<-table.row.end(a)
a<-table.row.start(a)
a<-table.element(a, 'p-value',1,TRUE)
a<-table.element(a, 1-pf(mysum$fstatistic[1],mysum$fstatistic[2],mysum$fstatistic[3]))
a<-table.row.end(a)
a<-table.row.start(a)
a<-table.element(a, 'Multiple Linear Regression - Residual Statistics', 2, TRUE)
a<-table.row.end(a)
a<-table.row.start(a)
a<-table.element(a, 'Residual Standard Deviation',1,TRUE)
a<-table.element(a, mysum$sigma)
a<-table.row.end(a)
a<-table.row.start(a)
a<-table.element(a, 'Sum Squared Residuals',1,TRUE)
a<-table.element(a, sum(myerror*myerror))
a<-table.row.end(a)
a<-table.end(a)
table.save(a,file='mytable3.tab')
a<-table.start()
a<-table.row.start(a)
a<-table.element(a, 'Multiple Linear Regression - Actuals, Interpolation, and Residuals', 4, TRUE)
a<-table.row.end(a)
a<-table.row.start(a)
a<-table.element(a, 'Time or Index', 1, TRUE)
a<-table.element(a, 'Actuals', 1, TRUE)
a<-table.element(a, 'Interpolation
Forecast', 1, TRUE)
a<-table.element(a, 'Residuals
Prediction Error', 1, TRUE)
a<-table.row.end(a)
for (i in 1:n) {
a<-table.row.start(a)
a<-table.element(a,i, 1, TRUE)
a<-table.element(a,x[i])
a<-table.element(a,x[i]-mysum$resid[i])
a<-table.element(a,mysum$resid[i])
a<-table.row.end(a)
}
a<-table.end(a)
table.save(a,file='mytable4.tab')
if (n > n25) {
a<-table.start()
a<-table.row.start(a)
a<-table.element(a,'Goldfeld-Quandt test for Heteroskedasticity',4,TRUE)
a<-table.row.end(a)
a<-table.row.start(a)
a<-table.element(a,'p-values',header=TRUE)
a<-table.element(a,'Alternative Hypothesis',3,header=TRUE)
a<-table.row.end(a)
a<-table.row.start(a)
a<-table.element(a,'breakpoint index',header=TRUE)
a<-table.element(a,'greater',header=TRUE)
a<-table.element(a,'2-sided',header=TRUE)
a<-table.element(a,'less',header=TRUE)
a<-table.row.end(a)
for (mypoint in kp3:nmkm3) {
a<-table.row.start(a)
a<-table.element(a,mypoint,header=TRUE)
a<-table.element(a,gqarr[mypoint-kp3+1,1])
a<-table.element(a,gqarr[mypoint-kp3+1,2])
a<-table.element(a,gqarr[mypoint-kp3+1,3])
a<-table.row.end(a)
}
a<-table.end(a)
table.save(a,file='mytable5.tab')
a<-table.start()
a<-table.row.start(a)
a<-table.element(a,'Meta Analysis of Goldfeld-Quandt test for Heteroskedasticity',4,TRUE)
a<-table.row.end(a)
a<-table.row.start(a)
a<-table.element(a,'Description',header=TRUE)
a<-table.element(a,'# significant tests',header=TRUE)
a<-table.element(a,'% significant tests',header=TRUE)
a<-table.element(a,'OK/NOK',header=TRUE)
a<-table.row.end(a)
a<-table.row.start(a)
a<-table.element(a,'1% type I error level',header=TRUE)
a<-table.element(a,numsignificant1)
a<-table.element(a,numsignificant1/numgqtests)
if (numsignificant1/numgqtests < 0.01) dum <- 'OK' else dum <- 'NOK'
a<-table.element(a,dum)
a<-table.row.end(a)
a<-table.row.start(a)
a<-table.element(a,'5% type I error level',header=TRUE)
a<-table.element(a,numsignificant5)
a<-table.element(a,numsignificant5/numgqtests)
if (numsignificant5/numgqtests < 0.05) dum <- 'OK' else dum <- 'NOK'
a<-table.element(a,dum)
a<-table.row.end(a)
a<-table.row.start(a)
a<-table.element(a,'10% type I error level',header=TRUE)
a<-table.element(a,numsignificant10)
a<-table.element(a,numsignificant10/numgqtests)
if (numsignificant10/numgqtests < 0.1) dum <- 'OK' else dum <- 'NOK'
a<-table.element(a,dum)
a<-table.row.end(a)
a<-table.end(a)
table.save(a,file='mytable6.tab')
}