Free Statistics

of Irreproducible Research!

Author's title

Author*The author of this computation has been verified*
R Software Modulerwasp_multipleregression.wasp
Title produced by softwareMultiple Regression
Date of computationTue, 25 Nov 2008 08:34:51 -0700
Cite this page as followsStatistical Computations at FreeStatistics.org, Office for Research Development and Education, URL https://freestatistics.org/blog/index.php?v=date/2008/Nov/25/t1227627396ncdol549tqnt2bo.htm/, Retrieved Thu, 09 May 2024 04:12:02 +0000
Statistical Computations at FreeStatistics.org, Office for Research Development and Education, URL https://freestatistics.org/blog/index.php?pk=25582, Retrieved Thu, 09 May 2024 04:12:02 +0000
QR Codes:

Original text written by user:
IsPrivate?No (this computation is public)
User-defined keywordsmultiple regression
Estimated Impact206
Family? (F = Feedback message, R = changed R code, M = changed R Module, P = changed Parameters, D = changed Data)
-     [Multiple Regression] [Multiple Regressi...] [2008-11-21 15:51:01] [c96f3dce3a823a83b6ede18389e1cfd4]
-    D  [Multiple Regression] [Multiple regressi...] [2008-11-24 14:26:32] [c96f3dce3a823a83b6ede18389e1cfd4]
F   PD      [Multiple Regression] [Seatbelt law Q3 w...] [2008-11-25 15:34:51] [3bdbbe597ac6c61989658933956ee6ac] [Current]
Feedback Forum
2008-11-30 16:18:47 [Toon Wouters] [reply
Uw berekeningen zijn goed uitgevoerd. Enkel vind ik de argumenten van conjunctuur en verkiezingen niet van toepassing op de werkloosheid van jongeren tot 25 j. Men had bevoorbeeld als dummy variabele de vakantie maanden kunnen nemen.

Post a new message
Dataseries X:
25	0
23,6	0
22,3	0
21,8	0
20,8	0
19,7	0
18,3	0
17,4	0
17	0
18,1	0
23,9	0
25,6	0
25,3	0
23,6	0
21,9	0
21,4	0
20,6	0
20,5	0
20,2	0
20,6	0
19,7	0
19,3	0
22,8	0
23,5	0
23,8	0
22,6	0
22	0
21,7	0
20,7	0
20,2	0
19,1	0
19,5	0
18,7	0
18,6	0
22,2	0
23,2	0
23,5	0
21,3	0
20	0
18,7	0
18,9	0
18,3	0
18,4	0
19,9	0
19,2	0
18,5	1
20,9	1
20,5	1
19,4	1
18,1	1
17	1
17	1
17,3	1
16,7	1
15,5	1
15,3	1
13,7	1
14,1	1
17,3	1
18,1	1
18,1	1


Summary of computational transaction
Raw Inputview raw input (R code)
Raw Outputview raw output of R engine
Computing time5 seconds
R Server'Sir Ronald Aylmer Fisher' @ 193.190.124.24

\begin{tabular}{lllllllll}
\hline
Summary of computational transaction \tabularnewline
Raw Input & view raw input (R code)  \tabularnewline
Raw Output & view raw output of R engine  \tabularnewline
Computing time & 5 seconds \tabularnewline
R Server & 'Sir Ronald Aylmer Fisher' @ 193.190.124.24 \tabularnewline
\hline
\end{tabular}
%Source: https://freestatistics.org/blog/index.php?pk=25582&T=0

[TABLE]
[ROW][C]Summary of computational transaction[/C][/ROW]
[ROW][C]Raw Input[/C][C]view raw input (R code) [/C][/ROW]
[ROW][C]Raw Output[/C][C]view raw output of R engine [/C][/ROW]
[ROW][C]Computing time[/C][C]5 seconds[/C][/ROW]
[ROW][C]R Server[/C][C]'Sir Ronald Aylmer Fisher' @ 193.190.124.24[/C][/ROW]
[/TABLE]
Source: https://freestatistics.org/blog/index.php?pk=25582&T=0

Globally Unique Identifier (entire table): ba.freestatistics.org/blog/index.php?pk=25582&T=0

As an alternative you can also use a QR Code:  

The GUIDs for individual cells are displayed in the table below:

Summary of computational transaction
Raw Inputview raw input (R code)
Raw Outputview raw output of R engine
Computing time5 seconds
R Server'Sir Ronald Aylmer Fisher' @ 193.190.124.24


Multiple Linear Regression - Estimated Regression Equation
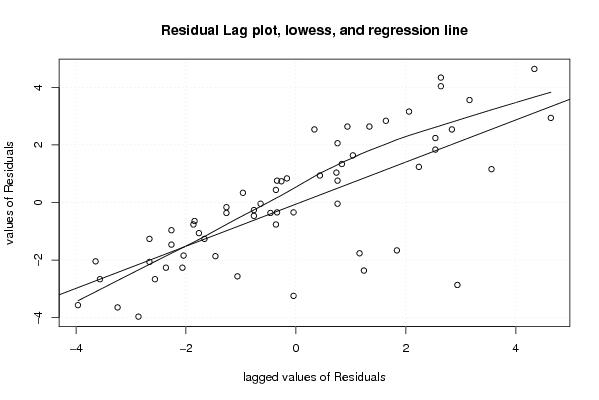
y[t] = + 20.9644444444444 -3.62069444444444x[t] + e[t]

\begin{tabular}{lllllllll}
\hline
Multiple Linear Regression - Estimated Regression Equation \tabularnewline
y[t] =  +  20.9644444444444 -3.62069444444444x[t]  + e[t] \tabularnewline
\hline
\end{tabular}
%Source: https://freestatistics.org/blog/index.php?pk=25582&T=1

[TABLE]
[ROW][C]Multiple Linear Regression - Estimated Regression Equation[/C][/ROW]
[ROW][C]y[t] =  +  20.9644444444444 -3.62069444444444x[t]  + e[t][/C][/ROW]
[/TABLE]
Source: https://freestatistics.org/blog/index.php?pk=25582&T=1

Globally Unique Identifier (entire table): ba.freestatistics.org/blog/index.php?pk=25582&T=1

As an alternative you can also use a QR Code:  

The GUIDs for individual cells are displayed in the table below:

Multiple Linear Regression - Estimated Regression Equation
y[t] = + 20.9644444444444 -3.62069444444444x[t] + e[t]


Multiple Linear Regression - Ordinary Least Squares
VariableParameterS.D.T-STATH0: parameter = 02-tail p-value1-tail p-value
(Intercept)20.96444444444440.32228165.050100
x-3.620694444444440.629275-5.753800

\begin{tabular}{lllllllll}
\hline
Multiple Linear Regression - Ordinary Least Squares \tabularnewline
Variable & Parameter & S.D. & T-STATH0: parameter = 0 & 2-tail p-value & 1-tail p-value \tabularnewline
(Intercept) & 20.9644444444444 & 0.322281 & 65.0501 & 0 & 0 \tabularnewline
x & -3.62069444444444 & 0.629275 & -5.7538 & 0 & 0 \tabularnewline
\hline
\end{tabular}
%Source: https://freestatistics.org/blog/index.php?pk=25582&T=2

[TABLE]
[ROW][C]Multiple Linear Regression - Ordinary Least Squares[/C][/ROW]
[ROW][C]Variable[/C][C]Parameter[/C][C]S.D.[/C][C]T-STATH0: parameter = 0[/C][C]2-tail p-value[/C][C]1-tail p-value[/C][/ROW]
[ROW][C](Intercept)[/C][C]20.9644444444444[/C][C]0.322281[/C][C]65.0501[/C][C]0[/C][C]0[/C][/ROW]
[ROW][C]x[/C][C]-3.62069444444444[/C][C]0.629275[/C][C]-5.7538[/C][C]0[/C][C]0[/C][/ROW]
[/TABLE]
Source: https://freestatistics.org/blog/index.php?pk=25582&T=2

Globally Unique Identifier (entire table): ba.freestatistics.org/blog/index.php?pk=25582&T=2

As an alternative you can also use a QR Code:  

The GUIDs for individual cells are displayed in the table below:

Multiple Linear Regression - Ordinary Least Squares
VariableParameterS.D.T-STATH0: parameter = 02-tail p-value1-tail p-value
(Intercept)20.96444444444440.32228165.050100
x-3.620694444444440.629275-5.753800


Multiple Linear Regression - Regression Statistics
Multiple R0.599526359057155
R-squared0.359431855204328
Adjusted R-squared0.348574768004402
F-TEST (value)33.1057353216024
F-TEST (DF numerator)1
F-TEST (DF denominator)59
p-value3.30099532930284e-07
Multiple Linear Regression - Residual Statistics
Residual Standard Deviation2.16192979593723
Sum Squared Residuals275.762486111111

\begin{tabular}{lllllllll}
\hline
Multiple Linear Regression - Regression Statistics \tabularnewline
Multiple R & 0.599526359057155 \tabularnewline
R-squared & 0.359431855204328 \tabularnewline
Adjusted R-squared & 0.348574768004402 \tabularnewline
F-TEST (value) & 33.1057353216024 \tabularnewline
F-TEST (DF numerator) & 1 \tabularnewline
F-TEST (DF denominator) & 59 \tabularnewline
p-value & 3.30099532930284e-07 \tabularnewline
Multiple Linear Regression - Residual Statistics \tabularnewline
Residual Standard Deviation & 2.16192979593723 \tabularnewline
Sum Squared Residuals & 275.762486111111 \tabularnewline
\hline
\end{tabular}
%Source: https://freestatistics.org/blog/index.php?pk=25582&T=3

[TABLE]
[ROW][C]Multiple Linear Regression - Regression Statistics[/C][/ROW]
[ROW][C]Multiple R[/C][C]0.599526359057155[/C][/ROW]
[ROW][C]R-squared[/C][C]0.359431855204328[/C][/ROW]
[ROW][C]Adjusted R-squared[/C][C]0.348574768004402[/C][/ROW]
[ROW][C]F-TEST (value)[/C][C]33.1057353216024[/C][/ROW]
[ROW][C]F-TEST (DF numerator)[/C][C]1[/C][/ROW]
[ROW][C]F-TEST (DF denominator)[/C][C]59[/C][/ROW]
[ROW][C]p-value[/C][C]3.30099532930284e-07[/C][/ROW]
[ROW][C]Multiple Linear Regression - Residual Statistics[/C][/ROW]
[ROW][C]Residual Standard Deviation[/C][C]2.16192979593723[/C][/ROW]
[ROW][C]Sum Squared Residuals[/C][C]275.762486111111[/C][/ROW]
[/TABLE]
Source: https://freestatistics.org/blog/index.php?pk=25582&T=3

Globally Unique Identifier (entire table): ba.freestatistics.org/blog/index.php?pk=25582&T=3

As an alternative you can also use a QR Code:  

The GUIDs for individual cells are displayed in the table below:

Multiple Linear Regression - Regression Statistics
Multiple R0.599526359057155
R-squared0.359431855204328
Adjusted R-squared0.348574768004402
F-TEST (value)33.1057353216024
F-TEST (DF numerator)1
F-TEST (DF denominator)59
p-value3.30099532930284e-07
Multiple Linear Regression - Residual Statistics
Residual Standard Deviation2.16192979593723
Sum Squared Residuals275.762486111111


Multiple Linear Regression - Actuals, Interpolation, and Residuals
Time or IndexActualsInterpolationForecastResidualsPrediction Error
12520.96444444444444.03555555555558
223.620.96444444444442.63555555555556
322.320.96444444444441.33555555555556
421.820.96444444444440.835555555555556
520.820.9644444444444-0.164444444444444
619.720.9644444444444-1.26444444444445
718.320.9644444444444-2.66444444444444
817.420.9644444444444-3.56444444444445
91720.9644444444444-3.96444444444444
1018.120.9644444444444-2.86444444444444
1123.920.96444444444442.93555555555555
1225.620.96444444444444.63555555555556
1325.320.96444444444444.33555555555556
1423.620.96444444444442.63555555555556
1521.920.96444444444440.935555555555554
1621.420.96444444444440.435555555555554
1720.620.9644444444444-0.364444444444444
1820.520.9644444444444-0.464444444444445
1920.220.9644444444444-0.764444444444446
2020.620.9644444444444-0.364444444444444
2119.720.9644444444444-1.26444444444445
2219.320.9644444444444-1.66444444444444
2322.820.96444444444441.83555555555556
2423.520.96444444444442.53555555555555
2523.820.96444444444442.83555555555556
2622.620.96444444444441.63555555555556
272220.96444444444441.03555555555556
2821.720.96444444444440.735555555555554
2920.720.9644444444444-0.264444444444446
3020.220.9644444444444-0.764444444444446
3119.120.9644444444444-1.86444444444444
3219.520.9644444444444-1.46444444444445
3318.720.9644444444444-2.26444444444445
3418.620.9644444444444-2.36444444444444
3522.220.96444444444441.23555555555555
3623.220.96444444444442.23555555555555
3723.520.96444444444442.53555555555555
3821.320.96444444444440.335555555555556
392020.9644444444444-0.964444444444445
4018.720.9644444444444-2.26444444444445
4118.920.9644444444444-2.06444444444445
4218.320.9644444444444-2.66444444444444
4318.420.9644444444444-2.56444444444445
4419.920.9644444444444-1.06444444444445
4519.220.9644444444444-1.76444444444445
4618.517.343751.15625
4720.917.343753.55625
4820.517.343753.15625
4919.417.343752.05625
5018.117.343750.756250000000001
511717.34375-0.34375
521717.34375-0.34375
5317.317.34375-0.0437499999999995
5416.717.34375-0.643750000000001
5515.517.34375-1.84375
5615.317.34375-2.04375
5713.717.34375-3.64375
5814.117.34375-3.24375
5917.317.34375-0.0437499999999995
6018.117.343750.756250000000001
6118.117.343750.756250000000001

\begin{tabular}{lllllllll}
\hline
Multiple Linear Regression - Actuals, Interpolation, and Residuals \tabularnewline
Time or Index & Actuals & InterpolationForecast & ResidualsPrediction Error \tabularnewline
1 & 25 & 20.9644444444444 & 4.03555555555558 \tabularnewline
2 & 23.6 & 20.9644444444444 & 2.63555555555556 \tabularnewline
3 & 22.3 & 20.9644444444444 & 1.33555555555556 \tabularnewline
4 & 21.8 & 20.9644444444444 & 0.835555555555556 \tabularnewline
5 & 20.8 & 20.9644444444444 & -0.164444444444444 \tabularnewline
6 & 19.7 & 20.9644444444444 & -1.26444444444445 \tabularnewline
7 & 18.3 & 20.9644444444444 & -2.66444444444444 \tabularnewline
8 & 17.4 & 20.9644444444444 & -3.56444444444445 \tabularnewline
9 & 17 & 20.9644444444444 & -3.96444444444444 \tabularnewline
10 & 18.1 & 20.9644444444444 & -2.86444444444444 \tabularnewline
11 & 23.9 & 20.9644444444444 & 2.93555555555555 \tabularnewline
12 & 25.6 & 20.9644444444444 & 4.63555555555556 \tabularnewline
13 & 25.3 & 20.9644444444444 & 4.33555555555556 \tabularnewline
14 & 23.6 & 20.9644444444444 & 2.63555555555556 \tabularnewline
15 & 21.9 & 20.9644444444444 & 0.935555555555554 \tabularnewline
16 & 21.4 & 20.9644444444444 & 0.435555555555554 \tabularnewline
17 & 20.6 & 20.9644444444444 & -0.364444444444444 \tabularnewline
18 & 20.5 & 20.9644444444444 & -0.464444444444445 \tabularnewline
19 & 20.2 & 20.9644444444444 & -0.764444444444446 \tabularnewline
20 & 20.6 & 20.9644444444444 & -0.364444444444444 \tabularnewline
21 & 19.7 & 20.9644444444444 & -1.26444444444445 \tabularnewline
22 & 19.3 & 20.9644444444444 & -1.66444444444444 \tabularnewline
23 & 22.8 & 20.9644444444444 & 1.83555555555556 \tabularnewline
24 & 23.5 & 20.9644444444444 & 2.53555555555555 \tabularnewline
25 & 23.8 & 20.9644444444444 & 2.83555555555556 \tabularnewline
26 & 22.6 & 20.9644444444444 & 1.63555555555556 \tabularnewline
27 & 22 & 20.9644444444444 & 1.03555555555556 \tabularnewline
28 & 21.7 & 20.9644444444444 & 0.735555555555554 \tabularnewline
29 & 20.7 & 20.9644444444444 & -0.264444444444446 \tabularnewline
30 & 20.2 & 20.9644444444444 & -0.764444444444446 \tabularnewline
31 & 19.1 & 20.9644444444444 & -1.86444444444444 \tabularnewline
32 & 19.5 & 20.9644444444444 & -1.46444444444445 \tabularnewline
33 & 18.7 & 20.9644444444444 & -2.26444444444445 \tabularnewline
34 & 18.6 & 20.9644444444444 & -2.36444444444444 \tabularnewline
35 & 22.2 & 20.9644444444444 & 1.23555555555555 \tabularnewline
36 & 23.2 & 20.9644444444444 & 2.23555555555555 \tabularnewline
37 & 23.5 & 20.9644444444444 & 2.53555555555555 \tabularnewline
38 & 21.3 & 20.9644444444444 & 0.335555555555556 \tabularnewline
39 & 20 & 20.9644444444444 & -0.964444444444445 \tabularnewline
40 & 18.7 & 20.9644444444444 & -2.26444444444445 \tabularnewline
41 & 18.9 & 20.9644444444444 & -2.06444444444445 \tabularnewline
42 & 18.3 & 20.9644444444444 & -2.66444444444444 \tabularnewline
43 & 18.4 & 20.9644444444444 & -2.56444444444445 \tabularnewline
44 & 19.9 & 20.9644444444444 & -1.06444444444445 \tabularnewline
45 & 19.2 & 20.9644444444444 & -1.76444444444445 \tabularnewline
46 & 18.5 & 17.34375 & 1.15625 \tabularnewline
47 & 20.9 & 17.34375 & 3.55625 \tabularnewline
48 & 20.5 & 17.34375 & 3.15625 \tabularnewline
49 & 19.4 & 17.34375 & 2.05625 \tabularnewline
50 & 18.1 & 17.34375 & 0.756250000000001 \tabularnewline
51 & 17 & 17.34375 & -0.34375 \tabularnewline
52 & 17 & 17.34375 & -0.34375 \tabularnewline
53 & 17.3 & 17.34375 & -0.0437499999999995 \tabularnewline
54 & 16.7 & 17.34375 & -0.643750000000001 \tabularnewline
55 & 15.5 & 17.34375 & -1.84375 \tabularnewline
56 & 15.3 & 17.34375 & -2.04375 \tabularnewline
57 & 13.7 & 17.34375 & -3.64375 \tabularnewline
58 & 14.1 & 17.34375 & -3.24375 \tabularnewline
59 & 17.3 & 17.34375 & -0.0437499999999995 \tabularnewline
60 & 18.1 & 17.34375 & 0.756250000000001 \tabularnewline
61 & 18.1 & 17.34375 & 0.756250000000001 \tabularnewline
\hline
\end{tabular}
%Source: https://freestatistics.org/blog/index.php?pk=25582&T=4

[TABLE]
[ROW][C]Multiple Linear Regression - Actuals, Interpolation, and Residuals[/C][/ROW]
[ROW][C]Time or Index[/C][C]Actuals[/C][C]InterpolationForecast[/C][C]ResidualsPrediction Error[/C][/ROW]
[ROW][C]1[/C][C]25[/C][C]20.9644444444444[/C][C]4.03555555555558[/C][/ROW]
[ROW][C]2[/C][C]23.6[/C][C]20.9644444444444[/C][C]2.63555555555556[/C][/ROW]
[ROW][C]3[/C][C]22.3[/C][C]20.9644444444444[/C][C]1.33555555555556[/C][/ROW]
[ROW][C]4[/C][C]21.8[/C][C]20.9644444444444[/C][C]0.835555555555556[/C][/ROW]
[ROW][C]5[/C][C]20.8[/C][C]20.9644444444444[/C][C]-0.164444444444444[/C][/ROW]
[ROW][C]6[/C][C]19.7[/C][C]20.9644444444444[/C][C]-1.26444444444445[/C][/ROW]
[ROW][C]7[/C][C]18.3[/C][C]20.9644444444444[/C][C]-2.66444444444444[/C][/ROW]
[ROW][C]8[/C][C]17.4[/C][C]20.9644444444444[/C][C]-3.56444444444445[/C][/ROW]
[ROW][C]9[/C][C]17[/C][C]20.9644444444444[/C][C]-3.96444444444444[/C][/ROW]
[ROW][C]10[/C][C]18.1[/C][C]20.9644444444444[/C][C]-2.86444444444444[/C][/ROW]
[ROW][C]11[/C][C]23.9[/C][C]20.9644444444444[/C][C]2.93555555555555[/C][/ROW]
[ROW][C]12[/C][C]25.6[/C][C]20.9644444444444[/C][C]4.63555555555556[/C][/ROW]
[ROW][C]13[/C][C]25.3[/C][C]20.9644444444444[/C][C]4.33555555555556[/C][/ROW]
[ROW][C]14[/C][C]23.6[/C][C]20.9644444444444[/C][C]2.63555555555556[/C][/ROW]
[ROW][C]15[/C][C]21.9[/C][C]20.9644444444444[/C][C]0.935555555555554[/C][/ROW]
[ROW][C]16[/C][C]21.4[/C][C]20.9644444444444[/C][C]0.435555555555554[/C][/ROW]
[ROW][C]17[/C][C]20.6[/C][C]20.9644444444444[/C][C]-0.364444444444444[/C][/ROW]
[ROW][C]18[/C][C]20.5[/C][C]20.9644444444444[/C][C]-0.464444444444445[/C][/ROW]
[ROW][C]19[/C][C]20.2[/C][C]20.9644444444444[/C][C]-0.764444444444446[/C][/ROW]
[ROW][C]20[/C][C]20.6[/C][C]20.9644444444444[/C][C]-0.364444444444444[/C][/ROW]
[ROW][C]21[/C][C]19.7[/C][C]20.9644444444444[/C][C]-1.26444444444445[/C][/ROW]
[ROW][C]22[/C][C]19.3[/C][C]20.9644444444444[/C][C]-1.66444444444444[/C][/ROW]
[ROW][C]23[/C][C]22.8[/C][C]20.9644444444444[/C][C]1.83555555555556[/C][/ROW]
[ROW][C]24[/C][C]23.5[/C][C]20.9644444444444[/C][C]2.53555555555555[/C][/ROW]
[ROW][C]25[/C][C]23.8[/C][C]20.9644444444444[/C][C]2.83555555555556[/C][/ROW]
[ROW][C]26[/C][C]22.6[/C][C]20.9644444444444[/C][C]1.63555555555556[/C][/ROW]
[ROW][C]27[/C][C]22[/C][C]20.9644444444444[/C][C]1.03555555555556[/C][/ROW]
[ROW][C]28[/C][C]21.7[/C][C]20.9644444444444[/C][C]0.735555555555554[/C][/ROW]
[ROW][C]29[/C][C]20.7[/C][C]20.9644444444444[/C][C]-0.264444444444446[/C][/ROW]
[ROW][C]30[/C][C]20.2[/C][C]20.9644444444444[/C][C]-0.764444444444446[/C][/ROW]
[ROW][C]31[/C][C]19.1[/C][C]20.9644444444444[/C][C]-1.86444444444444[/C][/ROW]
[ROW][C]32[/C][C]19.5[/C][C]20.9644444444444[/C][C]-1.46444444444445[/C][/ROW]
[ROW][C]33[/C][C]18.7[/C][C]20.9644444444444[/C][C]-2.26444444444445[/C][/ROW]
[ROW][C]34[/C][C]18.6[/C][C]20.9644444444444[/C][C]-2.36444444444444[/C][/ROW]
[ROW][C]35[/C][C]22.2[/C][C]20.9644444444444[/C][C]1.23555555555555[/C][/ROW]
[ROW][C]36[/C][C]23.2[/C][C]20.9644444444444[/C][C]2.23555555555555[/C][/ROW]
[ROW][C]37[/C][C]23.5[/C][C]20.9644444444444[/C][C]2.53555555555555[/C][/ROW]
[ROW][C]38[/C][C]21.3[/C][C]20.9644444444444[/C][C]0.335555555555556[/C][/ROW]
[ROW][C]39[/C][C]20[/C][C]20.9644444444444[/C][C]-0.964444444444445[/C][/ROW]
[ROW][C]40[/C][C]18.7[/C][C]20.9644444444444[/C][C]-2.26444444444445[/C][/ROW]
[ROW][C]41[/C][C]18.9[/C][C]20.9644444444444[/C][C]-2.06444444444445[/C][/ROW]
[ROW][C]42[/C][C]18.3[/C][C]20.9644444444444[/C][C]-2.66444444444444[/C][/ROW]
[ROW][C]43[/C][C]18.4[/C][C]20.9644444444444[/C][C]-2.56444444444445[/C][/ROW]
[ROW][C]44[/C][C]19.9[/C][C]20.9644444444444[/C][C]-1.06444444444445[/C][/ROW]
[ROW][C]45[/C][C]19.2[/C][C]20.9644444444444[/C][C]-1.76444444444445[/C][/ROW]
[ROW][C]46[/C][C]18.5[/C][C]17.34375[/C][C]1.15625[/C][/ROW]
[ROW][C]47[/C][C]20.9[/C][C]17.34375[/C][C]3.55625[/C][/ROW]
[ROW][C]48[/C][C]20.5[/C][C]17.34375[/C][C]3.15625[/C][/ROW]
[ROW][C]49[/C][C]19.4[/C][C]17.34375[/C][C]2.05625[/C][/ROW]
[ROW][C]50[/C][C]18.1[/C][C]17.34375[/C][C]0.756250000000001[/C][/ROW]
[ROW][C]51[/C][C]17[/C][C]17.34375[/C][C]-0.34375[/C][/ROW]
[ROW][C]52[/C][C]17[/C][C]17.34375[/C][C]-0.34375[/C][/ROW]
[ROW][C]53[/C][C]17.3[/C][C]17.34375[/C][C]-0.0437499999999995[/C][/ROW]
[ROW][C]54[/C][C]16.7[/C][C]17.34375[/C][C]-0.643750000000001[/C][/ROW]
[ROW][C]55[/C][C]15.5[/C][C]17.34375[/C][C]-1.84375[/C][/ROW]
[ROW][C]56[/C][C]15.3[/C][C]17.34375[/C][C]-2.04375[/C][/ROW]
[ROW][C]57[/C][C]13.7[/C][C]17.34375[/C][C]-3.64375[/C][/ROW]
[ROW][C]58[/C][C]14.1[/C][C]17.34375[/C][C]-3.24375[/C][/ROW]
[ROW][C]59[/C][C]17.3[/C][C]17.34375[/C][C]-0.0437499999999995[/C][/ROW]
[ROW][C]60[/C][C]18.1[/C][C]17.34375[/C][C]0.756250000000001[/C][/ROW]
[ROW][C]61[/C][C]18.1[/C][C]17.34375[/C][C]0.756250000000001[/C][/ROW]
[/TABLE]
Source: https://freestatistics.org/blog/index.php?pk=25582&T=4

Globally Unique Identifier (entire table): ba.freestatistics.org/blog/index.php?pk=25582&T=4

As an alternative you can also use a QR Code:  

The GUIDs for individual cells are displayed in the table below:

Multiple Linear Regression - Actuals, Interpolation, and Residuals
Time or IndexActualsInterpolationForecastResidualsPrediction Error
12520.96444444444444.03555555555558
223.620.96444444444442.63555555555556
322.320.96444444444441.33555555555556
421.820.96444444444440.835555555555556
520.820.9644444444444-0.164444444444444
619.720.9644444444444-1.26444444444445
718.320.9644444444444-2.66444444444444
817.420.9644444444444-3.56444444444445
91720.9644444444444-3.96444444444444
1018.120.9644444444444-2.86444444444444
1123.920.96444444444442.93555555555555
1225.620.96444444444444.63555555555556
1325.320.96444444444444.33555555555556
1423.620.96444444444442.63555555555556
1521.920.96444444444440.935555555555554
1621.420.96444444444440.435555555555554
1720.620.9644444444444-0.364444444444444
1820.520.9644444444444-0.464444444444445
1920.220.9644444444444-0.764444444444446
2020.620.9644444444444-0.364444444444444
2119.720.9644444444444-1.26444444444445
2219.320.9644444444444-1.66444444444444
2322.820.96444444444441.83555555555556
2423.520.96444444444442.53555555555555
2523.820.96444444444442.83555555555556
2622.620.96444444444441.63555555555556
272220.96444444444441.03555555555556
2821.720.96444444444440.735555555555554
2920.720.9644444444444-0.264444444444446
3020.220.9644444444444-0.764444444444446
3119.120.9644444444444-1.86444444444444
3219.520.9644444444444-1.46444444444445
3318.720.9644444444444-2.26444444444445
3418.620.9644444444444-2.36444444444444
3522.220.96444444444441.23555555555555
3623.220.96444444444442.23555555555555
3723.520.96444444444442.53555555555555
3821.320.96444444444440.335555555555556
392020.9644444444444-0.964444444444445
4018.720.9644444444444-2.26444444444445
4118.920.9644444444444-2.06444444444445
4218.320.9644444444444-2.66444444444444
4318.420.9644444444444-2.56444444444445
4419.920.9644444444444-1.06444444444445
4519.220.9644444444444-1.76444444444445
4618.517.343751.15625
4720.917.343753.55625
4820.517.343753.15625
4919.417.343752.05625
5018.117.343750.756250000000001
511717.34375-0.34375
521717.34375-0.34375
5317.317.34375-0.0437499999999995
5416.717.34375-0.643750000000001
5515.517.34375-1.84375
5615.317.34375-2.04375
5713.717.34375-3.64375
5814.117.34375-3.24375
5917.317.34375-0.0437499999999995
6018.117.343750.756250000000001
6118.117.343750.756250000000001


Goldfeld-Quandt test for Heteroskedasticity
p-valuesAlternative Hypothesis
breakpoint indexgreater2-sidedless
50.4867868739810840.9735737479621680.513213126018916
60.5710377419596980.8579245160806040.428962258040302
70.7411027120340930.5177945759318150.258897287965907
80.8708130406745030.2583739186509940.129186959325497
90.9372242967162170.1255514065675660.0627757032837831
100.9391937457104450.1216125085791110.0608062542895554
110.9571863108479050.0856273783041910.0428136891520955
120.9898346028689350.0203307942621310.0101653971310655
130.9970662831852150.005867433629569140.00293371681478457
140.9971719092428760.005656181514247240.00282809075712362
150.9951053181120220.00978936377595580.0048946818879779
160.9914729517591220.01705409648175540.0085270482408777
170.9860694181686630.02786116366267460.0139305818313373
180.978172005626730.04365598874653840.0218279943732692
190.9679769581485180.06404608370296350.0320230418514818
200.952108412567950.09578317486409860.0478915874320493
210.9381618819130890.1236762361738230.0618381180869114
220.9273445743233940.1453108513532120.072655425676606
230.9183556404649940.1632887190700110.0816443595350056
240.9282651579895710.1434696840208580.0717348420104288
250.9477166255036520.1045667489926950.0522833744963477
260.9428741665016530.1142516669966940.0571258334983468
270.929713519276020.1405729614479580.0702864807239791
280.9113829703922680.1772340592154630.0886170296077317
290.8816373616273720.2367252767452550.118362638372628
300.846944841995360.3061103160092790.153055158004640
310.828099790544630.3438004189107380.171900209455369
320.7942163385632010.4115673228735970.205783661436799
330.7851004183537230.4297991632925550.214899581646277
340.7801774936243420.4396450127513170.219822506375659
350.7570944979153290.4858110041693420.242905502084671
360.8034010459468390.3931979081063230.196598954053161
370.889569543671280.2208609126574390.110430456328719
380.8816101491907310.2367797016185370.118389850809269
390.8510073731179370.2979852537641260.148992626882063
400.8212197178338640.3575605643322730.178780282166136
410.7811343521919350.4377312956161310.218865647808065
420.7514320346233120.4971359307533760.248567965376688
430.7173919913919670.5652160172160660.282608008608033
440.6475663686584920.7048672626830160.352433631341508
450.5752891379287130.8494217241425740.424710862071287
460.5058055264153180.9883889471693640.494194473584682
470.6464506645554570.7070986708890860.353549335444543
480.7855244799205490.4289510401589030.214475520079451
490.8436402825215660.3127194349568690.156359717478434
500.827733982345510.3445320353089790.172266017654489
510.7656723899339030.4686552201321940.234327610066097
520.6860290937245480.6279418125509030.313970906275452
530.6058846134615270.7882307730769460.394115386538473
540.4901562596756320.9803125193512650.509843740324368
550.3707634552775740.7415269105551480.629236544722426
560.2577053986429620.5154107972859240.742294601357038

\begin{tabular}{lllllllll}
\hline
Goldfeld-Quandt test for Heteroskedasticity \tabularnewline
p-values & Alternative Hypothesis \tabularnewline
breakpoint index & greater & 2-sided & less \tabularnewline
5 & 0.486786873981084 & 0.973573747962168 & 0.513213126018916 \tabularnewline
6 & 0.571037741959698 & 0.857924516080604 & 0.428962258040302 \tabularnewline
7 & 0.741102712034093 & 0.517794575931815 & 0.258897287965907 \tabularnewline
8 & 0.870813040674503 & 0.258373918650994 & 0.129186959325497 \tabularnewline
9 & 0.937224296716217 & 0.125551406567566 & 0.0627757032837831 \tabularnewline
10 & 0.939193745710445 & 0.121612508579111 & 0.0608062542895554 \tabularnewline
11 & 0.957186310847905 & 0.085627378304191 & 0.0428136891520955 \tabularnewline
12 & 0.989834602868935 & 0.020330794262131 & 0.0101653971310655 \tabularnewline
13 & 0.997066283185215 & 0.00586743362956914 & 0.00293371681478457 \tabularnewline
14 & 0.997171909242876 & 0.00565618151424724 & 0.00282809075712362 \tabularnewline
15 & 0.995105318112022 & 0.0097893637759558 & 0.0048946818879779 \tabularnewline
16 & 0.991472951759122 & 0.0170540964817554 & 0.0085270482408777 \tabularnewline
17 & 0.986069418168663 & 0.0278611636626746 & 0.0139305818313373 \tabularnewline
18 & 0.97817200562673 & 0.0436559887465384 & 0.0218279943732692 \tabularnewline
19 & 0.967976958148518 & 0.0640460837029635 & 0.0320230418514818 \tabularnewline
20 & 0.95210841256795 & 0.0957831748640986 & 0.0478915874320493 \tabularnewline
21 & 0.938161881913089 & 0.123676236173823 & 0.0618381180869114 \tabularnewline
22 & 0.927344574323394 & 0.145310851353212 & 0.072655425676606 \tabularnewline
23 & 0.918355640464994 & 0.163288719070011 & 0.0816443595350056 \tabularnewline
24 & 0.928265157989571 & 0.143469684020858 & 0.0717348420104288 \tabularnewline
25 & 0.947716625503652 & 0.104566748992695 & 0.0522833744963477 \tabularnewline
26 & 0.942874166501653 & 0.114251666996694 & 0.0571258334983468 \tabularnewline
27 & 0.92971351927602 & 0.140572961447958 & 0.0702864807239791 \tabularnewline
28 & 0.911382970392268 & 0.177234059215463 & 0.0886170296077317 \tabularnewline
29 & 0.881637361627372 & 0.236725276745255 & 0.118362638372628 \tabularnewline
30 & 0.84694484199536 & 0.306110316009279 & 0.153055158004640 \tabularnewline
31 & 0.82809979054463 & 0.343800418910738 & 0.171900209455369 \tabularnewline
32 & 0.794216338563201 & 0.411567322873597 & 0.205783661436799 \tabularnewline
33 & 0.785100418353723 & 0.429799163292555 & 0.214899581646277 \tabularnewline
34 & 0.780177493624342 & 0.439645012751317 & 0.219822506375659 \tabularnewline
35 & 0.757094497915329 & 0.485811004169342 & 0.242905502084671 \tabularnewline
36 & 0.803401045946839 & 0.393197908106323 & 0.196598954053161 \tabularnewline
37 & 0.88956954367128 & 0.220860912657439 & 0.110430456328719 \tabularnewline
38 & 0.881610149190731 & 0.236779701618537 & 0.118389850809269 \tabularnewline
39 & 0.851007373117937 & 0.297985253764126 & 0.148992626882063 \tabularnewline
40 & 0.821219717833864 & 0.357560564332273 & 0.178780282166136 \tabularnewline
41 & 0.781134352191935 & 0.437731295616131 & 0.218865647808065 \tabularnewline
42 & 0.751432034623312 & 0.497135930753376 & 0.248567965376688 \tabularnewline
43 & 0.717391991391967 & 0.565216017216066 & 0.282608008608033 \tabularnewline
44 & 0.647566368658492 & 0.704867262683016 & 0.352433631341508 \tabularnewline
45 & 0.575289137928713 & 0.849421724142574 & 0.424710862071287 \tabularnewline
46 & 0.505805526415318 & 0.988388947169364 & 0.494194473584682 \tabularnewline
47 & 0.646450664555457 & 0.707098670889086 & 0.353549335444543 \tabularnewline
48 & 0.785524479920549 & 0.428951040158903 & 0.214475520079451 \tabularnewline
49 & 0.843640282521566 & 0.312719434956869 & 0.156359717478434 \tabularnewline
50 & 0.82773398234551 & 0.344532035308979 & 0.172266017654489 \tabularnewline
51 & 0.765672389933903 & 0.468655220132194 & 0.234327610066097 \tabularnewline
52 & 0.686029093724548 & 0.627941812550903 & 0.313970906275452 \tabularnewline
53 & 0.605884613461527 & 0.788230773076946 & 0.394115386538473 \tabularnewline
54 & 0.490156259675632 & 0.980312519351265 & 0.509843740324368 \tabularnewline
55 & 0.370763455277574 & 0.741526910555148 & 0.629236544722426 \tabularnewline
56 & 0.257705398642962 & 0.515410797285924 & 0.742294601357038 \tabularnewline
\hline
\end{tabular}
%Source: https://freestatistics.org/blog/index.php?pk=25582&T=5

[TABLE]
[ROW][C]Goldfeld-Quandt test for Heteroskedasticity[/C][/ROW]
[ROW][C]p-values[/C][C]Alternative Hypothesis[/C][/ROW]
[ROW][C]breakpoint index[/C][C]greater[/C][C]2-sided[/C][C]less[/C][/ROW]
[ROW][C]5[/C][C]0.486786873981084[/C][C]0.973573747962168[/C][C]0.513213126018916[/C][/ROW]
[ROW][C]6[/C][C]0.571037741959698[/C][C]0.857924516080604[/C][C]0.428962258040302[/C][/ROW]
[ROW][C]7[/C][C]0.741102712034093[/C][C]0.517794575931815[/C][C]0.258897287965907[/C][/ROW]
[ROW][C]8[/C][C]0.870813040674503[/C][C]0.258373918650994[/C][C]0.129186959325497[/C][/ROW]
[ROW][C]9[/C][C]0.937224296716217[/C][C]0.125551406567566[/C][C]0.0627757032837831[/C][/ROW]
[ROW][C]10[/C][C]0.939193745710445[/C][C]0.121612508579111[/C][C]0.0608062542895554[/C][/ROW]
[ROW][C]11[/C][C]0.957186310847905[/C][C]0.085627378304191[/C][C]0.0428136891520955[/C][/ROW]
[ROW][C]12[/C][C]0.989834602868935[/C][C]0.020330794262131[/C][C]0.0101653971310655[/C][/ROW]
[ROW][C]13[/C][C]0.997066283185215[/C][C]0.00586743362956914[/C][C]0.00293371681478457[/C][/ROW]
[ROW][C]14[/C][C]0.997171909242876[/C][C]0.00565618151424724[/C][C]0.00282809075712362[/C][/ROW]
[ROW][C]15[/C][C]0.995105318112022[/C][C]0.0097893637759558[/C][C]0.0048946818879779[/C][/ROW]
[ROW][C]16[/C][C]0.991472951759122[/C][C]0.0170540964817554[/C][C]0.0085270482408777[/C][/ROW]
[ROW][C]17[/C][C]0.986069418168663[/C][C]0.0278611636626746[/C][C]0.0139305818313373[/C][/ROW]
[ROW][C]18[/C][C]0.97817200562673[/C][C]0.0436559887465384[/C][C]0.0218279943732692[/C][/ROW]
[ROW][C]19[/C][C]0.967976958148518[/C][C]0.0640460837029635[/C][C]0.0320230418514818[/C][/ROW]
[ROW][C]20[/C][C]0.95210841256795[/C][C]0.0957831748640986[/C][C]0.0478915874320493[/C][/ROW]
[ROW][C]21[/C][C]0.938161881913089[/C][C]0.123676236173823[/C][C]0.0618381180869114[/C][/ROW]
[ROW][C]22[/C][C]0.927344574323394[/C][C]0.145310851353212[/C][C]0.072655425676606[/C][/ROW]
[ROW][C]23[/C][C]0.918355640464994[/C][C]0.163288719070011[/C][C]0.0816443595350056[/C][/ROW]
[ROW][C]24[/C][C]0.928265157989571[/C][C]0.143469684020858[/C][C]0.0717348420104288[/C][/ROW]
[ROW][C]25[/C][C]0.947716625503652[/C][C]0.104566748992695[/C][C]0.0522833744963477[/C][/ROW]
[ROW][C]26[/C][C]0.942874166501653[/C][C]0.114251666996694[/C][C]0.0571258334983468[/C][/ROW]
[ROW][C]27[/C][C]0.92971351927602[/C][C]0.140572961447958[/C][C]0.0702864807239791[/C][/ROW]
[ROW][C]28[/C][C]0.911382970392268[/C][C]0.177234059215463[/C][C]0.0886170296077317[/C][/ROW]
[ROW][C]29[/C][C]0.881637361627372[/C][C]0.236725276745255[/C][C]0.118362638372628[/C][/ROW]
[ROW][C]30[/C][C]0.84694484199536[/C][C]0.306110316009279[/C][C]0.153055158004640[/C][/ROW]
[ROW][C]31[/C][C]0.82809979054463[/C][C]0.343800418910738[/C][C]0.171900209455369[/C][/ROW]
[ROW][C]32[/C][C]0.794216338563201[/C][C]0.411567322873597[/C][C]0.205783661436799[/C][/ROW]
[ROW][C]33[/C][C]0.785100418353723[/C][C]0.429799163292555[/C][C]0.214899581646277[/C][/ROW]
[ROW][C]34[/C][C]0.780177493624342[/C][C]0.439645012751317[/C][C]0.219822506375659[/C][/ROW]
[ROW][C]35[/C][C]0.757094497915329[/C][C]0.485811004169342[/C][C]0.242905502084671[/C][/ROW]
[ROW][C]36[/C][C]0.803401045946839[/C][C]0.393197908106323[/C][C]0.196598954053161[/C][/ROW]
[ROW][C]37[/C][C]0.88956954367128[/C][C]0.220860912657439[/C][C]0.110430456328719[/C][/ROW]
[ROW][C]38[/C][C]0.881610149190731[/C][C]0.236779701618537[/C][C]0.118389850809269[/C][/ROW]
[ROW][C]39[/C][C]0.851007373117937[/C][C]0.297985253764126[/C][C]0.148992626882063[/C][/ROW]
[ROW][C]40[/C][C]0.821219717833864[/C][C]0.357560564332273[/C][C]0.178780282166136[/C][/ROW]
[ROW][C]41[/C][C]0.781134352191935[/C][C]0.437731295616131[/C][C]0.218865647808065[/C][/ROW]
[ROW][C]42[/C][C]0.751432034623312[/C][C]0.497135930753376[/C][C]0.248567965376688[/C][/ROW]
[ROW][C]43[/C][C]0.717391991391967[/C][C]0.565216017216066[/C][C]0.282608008608033[/C][/ROW]
[ROW][C]44[/C][C]0.647566368658492[/C][C]0.704867262683016[/C][C]0.352433631341508[/C][/ROW]
[ROW][C]45[/C][C]0.575289137928713[/C][C]0.849421724142574[/C][C]0.424710862071287[/C][/ROW]
[ROW][C]46[/C][C]0.505805526415318[/C][C]0.988388947169364[/C][C]0.494194473584682[/C][/ROW]
[ROW][C]47[/C][C]0.646450664555457[/C][C]0.707098670889086[/C][C]0.353549335444543[/C][/ROW]
[ROW][C]48[/C][C]0.785524479920549[/C][C]0.428951040158903[/C][C]0.214475520079451[/C][/ROW]
[ROW][C]49[/C][C]0.843640282521566[/C][C]0.312719434956869[/C][C]0.156359717478434[/C][/ROW]
[ROW][C]50[/C][C]0.82773398234551[/C][C]0.344532035308979[/C][C]0.172266017654489[/C][/ROW]
[ROW][C]51[/C][C]0.765672389933903[/C][C]0.468655220132194[/C][C]0.234327610066097[/C][/ROW]
[ROW][C]52[/C][C]0.686029093724548[/C][C]0.627941812550903[/C][C]0.313970906275452[/C][/ROW]
[ROW][C]53[/C][C]0.605884613461527[/C][C]0.788230773076946[/C][C]0.394115386538473[/C][/ROW]
[ROW][C]54[/C][C]0.490156259675632[/C][C]0.980312519351265[/C][C]0.509843740324368[/C][/ROW]
[ROW][C]55[/C][C]0.370763455277574[/C][C]0.741526910555148[/C][C]0.629236544722426[/C][/ROW]
[ROW][C]56[/C][C]0.257705398642962[/C][C]0.515410797285924[/C][C]0.742294601357038[/C][/ROW]
[/TABLE]
Source: https://freestatistics.org/blog/index.php?pk=25582&T=5

Globally Unique Identifier (entire table): ba.freestatistics.org/blog/index.php?pk=25582&T=5

As an alternative you can also use a QR Code:  

The GUIDs for individual cells are displayed in the table below:

Goldfeld-Quandt test for Heteroskedasticity
p-valuesAlternative Hypothesis
breakpoint indexgreater2-sidedless
50.4867868739810840.9735737479621680.513213126018916
60.5710377419596980.8579245160806040.428962258040302
70.7411027120340930.5177945759318150.258897287965907
80.8708130406745030.2583739186509940.129186959325497
90.9372242967162170.1255514065675660.0627757032837831
100.9391937457104450.1216125085791110.0608062542895554
110.9571863108479050.0856273783041910.0428136891520955
120.9898346028689350.0203307942621310.0101653971310655
130.9970662831852150.005867433629569140.00293371681478457
140.9971719092428760.005656181514247240.00282809075712362
150.9951053181120220.00978936377595580.0048946818879779
160.9914729517591220.01705409648175540.0085270482408777
170.9860694181686630.02786116366267460.0139305818313373
180.978172005626730.04365598874653840.0218279943732692
190.9679769581485180.06404608370296350.0320230418514818
200.952108412567950.09578317486409860.0478915874320493
210.9381618819130890.1236762361738230.0618381180869114
220.9273445743233940.1453108513532120.072655425676606
230.9183556404649940.1632887190700110.0816443595350056
240.9282651579895710.1434696840208580.0717348420104288
250.9477166255036520.1045667489926950.0522833744963477
260.9428741665016530.1142516669966940.0571258334983468
270.929713519276020.1405729614479580.0702864807239791
280.9113829703922680.1772340592154630.0886170296077317
290.8816373616273720.2367252767452550.118362638372628
300.846944841995360.3061103160092790.153055158004640
310.828099790544630.3438004189107380.171900209455369
320.7942163385632010.4115673228735970.205783661436799
330.7851004183537230.4297991632925550.214899581646277
340.7801774936243420.4396450127513170.219822506375659
350.7570944979153290.4858110041693420.242905502084671
360.8034010459468390.3931979081063230.196598954053161
370.889569543671280.2208609126574390.110430456328719
380.8816101491907310.2367797016185370.118389850809269
390.8510073731179370.2979852537641260.148992626882063
400.8212197178338640.3575605643322730.178780282166136
410.7811343521919350.4377312956161310.218865647808065
420.7514320346233120.4971359307533760.248567965376688
430.7173919913919670.5652160172160660.282608008608033
440.6475663686584920.7048672626830160.352433631341508
450.5752891379287130.8494217241425740.424710862071287
460.5058055264153180.9883889471693640.494194473584682
470.6464506645554570.7070986708890860.353549335444543
480.7855244799205490.4289510401589030.214475520079451
490.8436402825215660.3127194349568690.156359717478434
500.827733982345510.3445320353089790.172266017654489
510.7656723899339030.4686552201321940.234327610066097
520.6860290937245480.6279418125509030.313970906275452
530.6058846134615270.7882307730769460.394115386538473
540.4901562596756320.9803125193512650.509843740324368
550.3707634552775740.7415269105551480.629236544722426
560.2577053986429620.5154107972859240.742294601357038


Meta Analysis of Goldfeld-Quandt test for Heteroskedasticity
Description# significant tests% significant testsOK/NOK
1% type I error level30.0576923076923077NOK
5% type I error level70.134615384615385NOK
10% type I error level100.192307692307692NOK

\begin{tabular}{lllllllll}
\hline
Meta Analysis of Goldfeld-Quandt test for Heteroskedasticity \tabularnewline
Description & # significant tests & % significant tests & OK/NOK \tabularnewline
1% type I error level & 3 & 0.0576923076923077 & NOK \tabularnewline
5% type I error level & 7 & 0.134615384615385 & NOK \tabularnewline
10% type I error level & 10 & 0.192307692307692 & NOK \tabularnewline
\hline
\end{tabular}
%Source: https://freestatistics.org/blog/index.php?pk=25582&T=6

[TABLE]
[ROW][C]Meta Analysis of Goldfeld-Quandt test for Heteroskedasticity[/C][/ROW]
[ROW][C]Description[/C][C]# significant tests[/C][C]% significant tests[/C][C]OK/NOK[/C][/ROW]
[ROW][C]1% type I error level[/C][C]3[/C][C]0.0576923076923077[/C][C]NOK[/C][/ROW]
[ROW][C]5% type I error level[/C][C]7[/C][C]0.134615384615385[/C][C]NOK[/C][/ROW]
[ROW][C]10% type I error level[/C][C]10[/C][C]0.192307692307692[/C][C]NOK[/C][/ROW]
[/TABLE]
Source: https://freestatistics.org/blog/index.php?pk=25582&T=6

Globally Unique Identifier (entire table): ba.freestatistics.org/blog/index.php?pk=25582&T=6

As an alternative you can also use a QR Code:  

The GUIDs for individual cells are displayed in the table below:

Meta Analysis of Goldfeld-Quandt test for Heteroskedasticity
Description# significant tests% significant testsOK/NOK
1% type I error level30.0576923076923077NOK
5% type I error level70.134615384615385NOK
10% type I error level100.192307692307692NOK


Parameters (Session):
par1 = 1 ; par2 = Do not include Seasonal Dummies ; par3 = No Linear Trend ;
Parameters (R input):
par1 = 1 ; par2 = Do not include Seasonal Dummies ; par3 = No Linear Trend ;
R code (references can be found in the software module):
library(lattice)
library(lmtest)
n25 <- 25 #minimum number of obs. for Goldfeld-Quandt test
par1 <- as.numeric(par1)
x <- t(y)
k <- length(x[1,])
n <- length(x[,1])
x1 <- cbind(x[,par1], x[,1:k!=par1])
mycolnames <- c(colnames(x)[par1], colnames(x)[1:k!=par1])
colnames(x1) <- mycolnames #colnames(x)[par1]
x <- x1
if (par3 == 'First Differences'){
x2 <- array(0, dim=c(n-1,k), dimnames=list(1:(n-1), paste('(1-B)',colnames(x),sep='')))
for (i in 1:n-1) {
for (j in 1:k) {
x2[i,j] <- x[i+1,j] - x[i,j]
}
}
x <- x2
}
if (par2 == 'Include Monthly Dummies'){
x2 <- array(0, dim=c(n,11), dimnames=list(1:n, paste('M', seq(1:11), sep ='')))
for (i in 1:11){
x2[seq(i,n,12),i] <- 1
}
x <- cbind(x, x2)
}
if (par2 == 'Include Quarterly Dummies'){
x2 <- array(0, dim=c(n,3), dimnames=list(1:n, paste('Q', seq(1:3), sep ='')))
for (i in 1:3){
x2[seq(i,n,4),i] <- 1
}
x <- cbind(x, x2)
}
k <- length(x[1,])
if (par3 == 'Linear Trend'){
x <- cbind(x, c(1:n))
colnames(x)[k+1] <- 't'
}
x
k <- length(x[1,])
df <- as.data.frame(x)
(mylm <- lm(df))
(mysum <- summary(mylm))
if (n > n25) {
kp3 <- k + 3
nmkm3 <- n - k - 3
gqarr <- array(NA, dim=c(nmkm3-kp3+1,3))
numgqtests <- 0
numsignificant1 <- 0
numsignificant5 <- 0
numsignificant10 <- 0
for (mypoint in kp3:nmkm3) {
j <- 0
numgqtests <- numgqtests + 1
for (myalt in c('greater', 'two.sided', 'less')) {
j <- j + 1
gqarr[mypoint-kp3+1,j] <- gqtest(mylm, point=mypoint, alternative=myalt)$p.value
}
if (gqarr[mypoint-kp3+1,2] < 0.01) numsignificant1 <- numsignificant1 + 1
if (gqarr[mypoint-kp3+1,2] < 0.05) numsignificant5 <- numsignificant5 + 1
if (gqarr[mypoint-kp3+1,2] < 0.10) numsignificant10 <- numsignificant10 + 1
}
gqarr
}
bitmap(file='test0.png')
plot(x[,1], type='l', main='Actuals and Interpolation', ylab='value of Actuals and Interpolation (dots)', xlab='time or index')
points(x[,1]-mysum$resid)
grid()
dev.off()
bitmap(file='test1.png')
plot(mysum$resid, type='b', pch=19, main='Residuals', ylab='value of Residuals', xlab='time or index')
grid()
dev.off()
bitmap(file='test2.png')
hist(mysum$resid, main='Residual Histogram', xlab='values of Residuals')
grid()
dev.off()
bitmap(file='test3.png')
densityplot(~mysum$resid,col='black',main='Residual Density Plot', xlab='values of Residuals')
dev.off()
bitmap(file='test4.png')
qqnorm(mysum$resid, main='Residual Normal Q-Q Plot')
qqline(mysum$resid)
grid()
dev.off()
(myerror <- as.ts(mysum$resid))
bitmap(file='test5.png')
dum <- cbind(lag(myerror,k=1),myerror)
dum
dum1 <- dum[2:length(myerror),]
dum1
z <- as.data.frame(dum1)
z
plot(z,main=paste('Residual Lag plot, lowess, and regression line'), ylab='values of Residuals', xlab='lagged values of Residuals')
lines(lowess(z))
abline(lm(z))
grid()
dev.off()
bitmap(file='test6.png')
acf(mysum$resid, lag.max=length(mysum$resid)/2, main='Residual Autocorrelation Function')
grid()
dev.off()
bitmap(file='test7.png')
pacf(mysum$resid, lag.max=length(mysum$resid)/2, main='Residual Partial Autocorrelation Function')
grid()
dev.off()
bitmap(file='test8.png')
opar <- par(mfrow = c(2,2), oma = c(0, 0, 1.1, 0))
plot(mylm, las = 1, sub='Residual Diagnostics')
par(opar)
dev.off()
if (n > n25) {
bitmap(file='test9.png')
plot(kp3:nmkm3,gqarr[,2], main='Goldfeld-Quandt test',ylab='2-sided p-value',xlab='breakpoint')
grid()
dev.off()
}
load(file='createtable')
a<-table.start()
a<-table.row.start(a)
a<-table.element(a, 'Multiple Linear Regression - Estimated Regression Equation', 1, TRUE)
a<-table.row.end(a)
myeq <- colnames(x)[1]
myeq <- paste(myeq, '[t] = ', sep='')
for (i in 1:k){
if (mysum$coefficients[i,1] > 0) myeq <- paste(myeq, '+', '')
myeq <- paste(myeq, mysum$coefficients[i,1], sep=' ')
if (rownames(mysum$coefficients)[i] != '(Intercept)') {
myeq <- paste(myeq, rownames(mysum$coefficients)[i], sep='')
if (rownames(mysum$coefficients)[i] != 't') myeq <- paste(myeq, '[t]', sep='')
}
}
myeq <- paste(myeq, ' + e[t]')
a<-table.row.start(a)
a<-table.element(a, myeq)
a<-table.row.end(a)
a<-table.end(a)
table.save(a,file='mytable1.tab')
a<-table.start()
a<-table.row.start(a)
a<-table.element(a,hyperlink('ols1.htm','Multiple Linear Regression - Ordinary Least Squares',''), 6, TRUE)
a<-table.row.end(a)
a<-table.row.start(a)
a<-table.element(a,'Variable',header=TRUE)
a<-table.element(a,'Parameter',header=TRUE)
a<-table.element(a,'S.D.',header=TRUE)
a<-table.element(a,'T-STAT
H0: parameter = 0',header=TRUE)
a<-table.element(a,'2-tail p-value',header=TRUE)
a<-table.element(a,'1-tail p-value',header=TRUE)
a<-table.row.end(a)
for (i in 1:k){
a<-table.row.start(a)
a<-table.element(a,rownames(mysum$coefficients)[i],header=TRUE)
a<-table.element(a,mysum$coefficients[i,1])
a<-table.element(a, round(mysum$coefficients[i,2],6))
a<-table.element(a, round(mysum$coefficients[i,3],4))
a<-table.element(a, round(mysum$coefficients[i,4],6))
a<-table.element(a, round(mysum$coefficients[i,4]/2,6))
a<-table.row.end(a)
}
a<-table.end(a)
table.save(a,file='mytable2.tab')
a<-table.start()
a<-table.row.start(a)
a<-table.element(a, 'Multiple Linear Regression - Regression Statistics', 2, TRUE)
a<-table.row.end(a)
a<-table.row.start(a)
a<-table.element(a, 'Multiple R',1,TRUE)
a<-table.element(a, sqrt(mysum$r.squared))
a<-table.row.end(a)
a<-table.row.start(a)
a<-table.element(a, 'R-squared',1,TRUE)
a<-table.element(a, mysum$r.squared)
a<-table.row.end(a)
a<-table.row.start(a)
a<-table.element(a, 'Adjusted R-squared',1,TRUE)
a<-table.element(a, mysum$adj.r.squared)
a<-table.row.end(a)
a<-table.row.start(a)
a<-table.element(a, 'F-TEST (value)',1,TRUE)
a<-table.element(a, mysum$fstatistic[1])
a<-table.row.end(a)
a<-table.row.start(a)
a<-table.element(a, 'F-TEST (DF numerator)',1,TRUE)
a<-table.element(a, mysum$fstatistic[2])
a<-table.row.end(a)
a<-table.row.start(a)
a<-table.element(a, 'F-TEST (DF denominator)',1,TRUE)
a<-table.element(a, mysum$fstatistic[3])
a<-table.row.end(a)
a<-table.row.start(a)
a<-table.element(a, 'p-value',1,TRUE)
a<-table.element(a, 1-pf(mysum$fstatistic[1],mysum$fstatistic[2],mysum$fstatistic[3]))
a<-table.row.end(a)
a<-table.row.start(a)
a<-table.element(a, 'Multiple Linear Regression - Residual Statistics', 2, TRUE)
a<-table.row.end(a)
a<-table.row.start(a)
a<-table.element(a, 'Residual Standard Deviation',1,TRUE)
a<-table.element(a, mysum$sigma)
a<-table.row.end(a)
a<-table.row.start(a)
a<-table.element(a, 'Sum Squared Residuals',1,TRUE)
a<-table.element(a, sum(myerror*myerror))
a<-table.row.end(a)
a<-table.end(a)
table.save(a,file='mytable3.tab')
a<-table.start()
a<-table.row.start(a)
a<-table.element(a, 'Multiple Linear Regression - Actuals, Interpolation, and Residuals', 4, TRUE)
a<-table.row.end(a)
a<-table.row.start(a)
a<-table.element(a, 'Time or Index', 1, TRUE)
a<-table.element(a, 'Actuals', 1, TRUE)
a<-table.element(a, 'Interpolation
Forecast', 1, TRUE)
a<-table.element(a, 'Residuals
Prediction Error', 1, TRUE)
a<-table.row.end(a)
for (i in 1:n) {
a<-table.row.start(a)
a<-table.element(a,i, 1, TRUE)
a<-table.element(a,x[i])
a<-table.element(a,x[i]-mysum$resid[i])
a<-table.element(a,mysum$resid[i])
a<-table.row.end(a)
}
a<-table.end(a)
table.save(a,file='mytable4.tab')
if (n > n25) {
a<-table.start()
a<-table.row.start(a)
a<-table.element(a,'Goldfeld-Quandt test for Heteroskedasticity',4,TRUE)
a<-table.row.end(a)
a<-table.row.start(a)
a<-table.element(a,'p-values',header=TRUE)
a<-table.element(a,'Alternative Hypothesis',3,header=TRUE)
a<-table.row.end(a)
a<-table.row.start(a)
a<-table.element(a,'breakpoint index',header=TRUE)
a<-table.element(a,'greater',header=TRUE)
a<-table.element(a,'2-sided',header=TRUE)
a<-table.element(a,'less',header=TRUE)
a<-table.row.end(a)
for (mypoint in kp3:nmkm3) {
a<-table.row.start(a)
a<-table.element(a,mypoint,header=TRUE)
a<-table.element(a,gqarr[mypoint-kp3+1,1])
a<-table.element(a,gqarr[mypoint-kp3+1,2])
a<-table.element(a,gqarr[mypoint-kp3+1,3])
a<-table.row.end(a)
}
a<-table.end(a)
table.save(a,file='mytable5.tab')
a<-table.start()
a<-table.row.start(a)
a<-table.element(a,'Meta Analysis of Goldfeld-Quandt test for Heteroskedasticity',4,TRUE)
a<-table.row.end(a)
a<-table.row.start(a)
a<-table.element(a,'Description',header=TRUE)
a<-table.element(a,'# significant tests',header=TRUE)
a<-table.element(a,'% significant tests',header=TRUE)
a<-table.element(a,'OK/NOK',header=TRUE)
a<-table.row.end(a)
a<-table.row.start(a)
a<-table.element(a,'1% type I error level',header=TRUE)
a<-table.element(a,numsignificant1)
a<-table.element(a,numsignificant1/numgqtests)
if (numsignificant1/numgqtests < 0.01) dum <- 'OK' else dum <- 'NOK'
a<-table.element(a,dum)
a<-table.row.end(a)
a<-table.row.start(a)
a<-table.element(a,'5% type I error level',header=TRUE)
a<-table.element(a,numsignificant5)
a<-table.element(a,numsignificant5/numgqtests)
if (numsignificant5/numgqtests < 0.05) dum <- 'OK' else dum <- 'NOK'
a<-table.element(a,dum)
a<-table.row.end(a)
a<-table.row.start(a)
a<-table.element(a,'10% type I error level',header=TRUE)
a<-table.element(a,numsignificant10)
a<-table.element(a,numsignificant10/numgqtests)
if (numsignificant10/numgqtests < 0.1) dum <- 'OK' else dum <- 'NOK'
a<-table.element(a,dum)
a<-table.row.end(a)
a<-table.end(a)
table.save(a,file='mytable6.tab')
}