Free Statistics

of Irreproducible Research!

Author's title

Author*Unverified author*
R Software Modulerwasp_multipleregression.wasp
Title produced by softwareMultiple Regression
Date of computationTue, 25 Nov 2008 04:52:10 -0700
Cite this page as followsStatistical Computations at FreeStatistics.org, Office for Research Development and Education, URL https://freestatistics.org/blog/index.php?v=date/2008/Nov/25/t1227614041jtzvtujlt3n367b.htm/, Retrieved Thu, 09 May 2024 11:22:39 +0000
Statistical Computations at FreeStatistics.org, Office for Research Development and Education, URL https://freestatistics.org/blog/index.php?pk=25577, Retrieved Thu, 09 May 2024 11:22:39 +0000
QR Codes:

Original text written by user:
IsPrivate?No (this computation is public)
User-defined keywords
Estimated Impact190
Family? (F = Feedback message, R = changed R code, M = changed R Module, P = changed Parameters, D = changed Data)
F     [Multiple Regression] [Toon Wouters] [2008-11-25 11:35:36] [6610d6fd8f463fb18a844c14dc2c3579]
F   P     [Multiple Regression] [Toon Wouters] [2008-11-25 11:52:10] [129e79f7c2a947d1265718b3aa5cb7d5] [Current]
Feedback Forum
2008-11-29 20:11:26 [006ad2c49b6a7c2ad6ab685cfc1dae56] [reply
Deze vraag heb je echt heel goed opgelost. Goede tabellen en grafieken en zeer goede uitleg.
2008-11-30 12:18:05 [Aurélie Van Impe] [reply
De verklaring van de formule in het begin is goed. Uit de tabel daaronder (Multiple lineair regression - ...) had je nog wel wat meer kunnen afleiden. Je reden om een 1-zijdige test te nemen is niet correct. Volgens jou zou je dan een 2-zijdige test nemen als je aan sommige waarden een 2 had toegekend... Je had beter gezegd dat je de eenzijdige test deed omdat je bijvoorbeeld enkel een positief effect verwacht door de invoering van de variabele x. Over de SD heb je ook niets gezegd. Dit is de hoeveelheid die je kan afwijking van de geschatte waarde voor die periode. Wat opvalt is dat de SD waarde voor sommige maanden zelfs groter is dan de absolute waarde van de parameters zelf. Je kan dus meer afwijken dan dat je geschat hebt, waarden die nu positief zijn, zouden negatief kunnen zijn als je zoveel zou afwijken. Dit wijst erop dat je model nog lang niet goed is. Ook over de T-STAT had je iets kunnen zeggen. Deze moet in absolute waarde groter zijn dan 2 om er zeker van te zijn dat de kans dat je je vergist bij het verwerpen van de nulhypothese kleiner is dan 5%. Bij jouw gegevens is de absolute waarde voor geen enkele maand groter dan 2. Dit wil dus zeggen dat je veel kans hebt om je te vergissen bij het verwerpen van de nulhypothese. Dit wijst opnieuw op een slecht model. Dit wordt ook bewezen door de adjusted R-square.
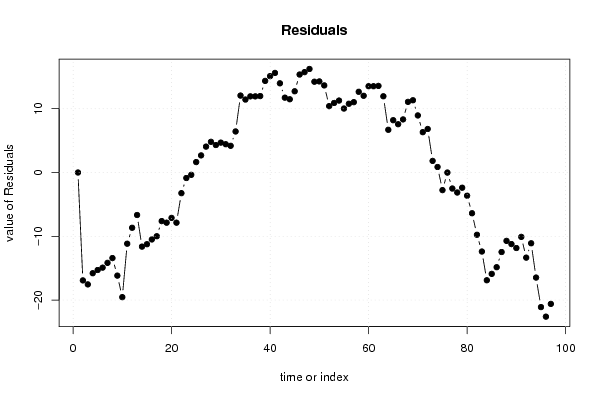
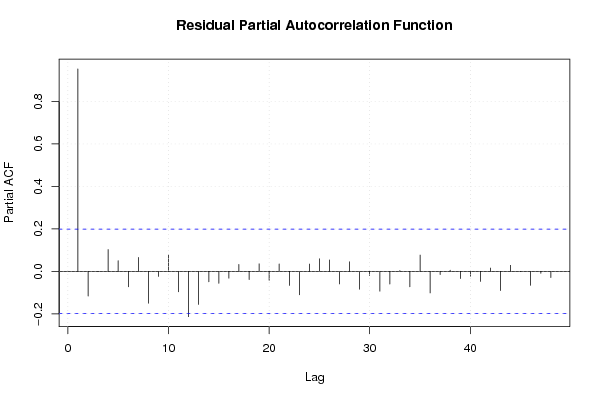
Tot slot heb ik nog een opmerking over je besluit. Je zegt dat er geen autocorrelatie mag zijn voor een goed model, en dat dit ook niet het geval is. Maar op de grafiek is duidelijk te zien dat er nog wel veel autocorrelatie is. Autocorrelatie wil zeggen dat er grote streepjes volgen op grote streepjes, en dat kleine streepjes volgen op kleine streepjes. Met andere woorden dat er een verband is tussen een meting in de ene maand en de meting in de maand ervoor. Hier is dat duideljk het geval! Als er geen correlatie zou zijn, dan zo je een groot streepje zien, en vlak daarna een heel klein streepje, of zelfs een negatief streepje, en vervolgens weer een groot streepje. Dan zouden de metingen totaal geen verband met elkaar hebben. Maar hier is duideljk nog een negatieve trend merkbaar. Je conclusie is dus fout. Hoewel het model inderdaad nog lang niet in orde is.
2008-12-01 11:03:21 [Alexander Hendrickx] [reply
Zeer goede verwerking van de opdracht. De eerste formule werd prefect uitgelegd ik heb hier niets aan toe te voegen. In de tweede tabel werd de reden van het gebruik van de een eenzijdige test niet correct verklaard. De reden van het gebruik van die eenzijdige test is omdat je verwacht dat er bij een bepaalde variabele om een of andere reden een kentering zou kunnen zijn. Ook de standaarddeviatie werd niet verklaard. Deze geeft weer hoe groot de opwaartse en neerwaartse schommelingen zouden kunnen zijn, die is in sommige maanden zo groot dat het erop wijst dat dit toch geen optimaal model zou kunnen zijn, dit was wel zeker de vermelding waard.
Over de t-stat werd eveneens geen duidelijke verklaring gegeven. Deze moet groter zijn dan 2 om een zekerheid te hebben van een kans van 5 % dat de verwerping van de nulhypothese foutief is. Ook hier zijn er aanwijzingen van een slecht model, de t stat is voor geen enkele maand groter dan 2, dit wijst op een onbetrouwbaar model. Ook de adjusted r square wijst op een onbetrouwbaar model, maar dit werd goed verklaard. Verder werden de grafieken goed en juist verklaard. Over het besluit zou ik willen zeggen dat het niet helemaal juist is. Er wordt beweerd dat er geen autocorrelatie is in dit model, maar aan de autocorrelatie plot kunnen zeer duidelijk een trend vaststellen die zeer mooi correleert. Er zijn dus 2 negatieve besluiten wat wijst op een onbetrouwbaar model
2008-12-01 23:02:56 [Li Tang Hu] [reply
goede uitwerking van de opgave...hier en daar mist er soms nog iets (oals t-stat)
conclusie is wel niet volledig juist....we merken een duidelijke negatieve trend op in de grafie over autocorrlatie...model is hoe dan ook alles behalve betrouwbaar

Post a new message
Dataseries X:
124		0
113		0
109		0
109		0
106		0
101		0
98		0
93		0
91		0
122		1
139		1
140		1
132		1
117		0
114		0
113		0
110		0
107		0
103		0
98		0
98		0
137		1
148		1
147		1
139		1
130		0
128		0
127		0
123		0
118		0
114		0
108		0
111		0
151		1
159		1
158		1
148		1
138		0
137		0
136		0
133		0
126		0
120		0
114		0
116		0
153		1
162		1
161		1
149		1
139		0
135		0
130		0
127		0
122		0
117		0
112		0
113		0
149		1
157		1
157		1
147		1
137		0
132		0
125		0
123		0
117		0
114		0
111		0
112		0
144		1
150		1
149		1
134		1
123		0
116		0
117		0
111		0
105		0
102		0
95		0
93		0
124		1
130		1
124		1
115		1
106		0
105		0
105		0
101		0
95		0
93		0
84		0
87		0
116		1
120		1
117		1
109		1


Summary of computational transaction
Raw Inputview raw input (R code)
Raw Outputview raw output of R engine
Computing time5 seconds
R Server'Gwilym Jenkins' @ 72.249.127.135
R Framework error message
Warning: there are blank lines in the 'Data X' field.
Please, use NA for missing data - blank lines are simply
 deleted and are NOT treated as missing values.

\begin{tabular}{lllllllll}
\hline
Summary of computational transaction \tabularnewline
Raw Input & view raw input (R code)  \tabularnewline
Raw Output & view raw output of R engine  \tabularnewline
Computing time & 5 seconds \tabularnewline
R Server & 'Gwilym Jenkins' @ 72.249.127.135 \tabularnewline
R Framework error message & 
Warning: there are blank lines in the 'Data X' field.
Please, use NA for missing data - blank lines are simply
 deleted and are NOT treated as missing values.
\tabularnewline \hline \end{tabular} %Source: https://freestatistics.org/blog/index.php?pk=25577&T=0

[TABLE]
[ROW][C]Summary of computational transaction[/C][/ROW]
[ROW][C]Raw Input[/C][C]view raw input (R code) [/C][/ROW]
[ROW][C]Raw Output[/C][C]view raw output of R engine [/C][/ROW]
[ROW][C]Computing time[/C][C]5 seconds[/C][/ROW]
[ROW][C]R Server[/C][C]'Gwilym Jenkins' @ 72.249.127.135[/C][/ROW]
[ROW][C]R Framework error message[/C][C]
Warning: there are blank lines in the 'Data X' field.
Please, use NA for missing data - blank lines are simply
 deleted and are NOT treated as missing values.
[/C][/ROW] [/TABLE] Source: https://freestatistics.org/blog/index.php?pk=25577&T=0

Globally Unique Identifier (entire table): ba.freestatistics.org/blog/index.php?pk=25577&T=0

As an alternative you can also use a QR Code:  

The GUIDs for individual cells are displayed in the table below:

Summary of computational transaction
Raw Inputview raw input (R code)
Raw Outputview raw output of R engine
Computing time5 seconds
R Server'Gwilym Jenkins' @ 72.249.127.135
R Framework error message
Warning: there are blank lines in the 'Data X' field.
Please, use NA for missing data - blank lines are simply
 deleted and are NOT treated as missing values.


Multiple Linear Regression - Estimated Regression Equation
Y[t] = + 134.000000000000 + 15.9553571428573X[t] -9.89203042328045M1[t] -3.87433862433845M2[t] -7.1413690476189M3[t] -8.78339947089932M4[t] -12.1754298941797M5[t] -17.4424603174601M6[t] -21.0844907407406M7[t] -26.726521164021M8[t] -25.8685515873014M9[t] -7.34093915343917M10[t] + 1.39203042328042M11[t] -0.107969576719577t + e[t]

\begin{tabular}{lllllllll}
\hline
Multiple Linear Regression - Estimated Regression Equation \tabularnewline
Y[t] =  +  134.000000000000 +  15.9553571428573X[t] -9.89203042328045M1[t] -3.87433862433845M2[t] -7.1413690476189M3[t] -8.78339947089932M4[t] -12.1754298941797M5[t] -17.4424603174601M6[t] -21.0844907407406M7[t] -26.726521164021M8[t] -25.8685515873014M9[t] -7.34093915343917M10[t] +  1.39203042328042M11[t] -0.107969576719577t  + e[t] \tabularnewline
\hline
\end{tabular}
%Source: https://freestatistics.org/blog/index.php?pk=25577&T=1

[TABLE]
[ROW][C]Multiple Linear Regression - Estimated Regression Equation[/C][/ROW]
[ROW][C]Y[t] =  +  134.000000000000 +  15.9553571428573X[t] -9.89203042328045M1[t] -3.87433862433845M2[t] -7.1413690476189M3[t] -8.78339947089932M4[t] -12.1754298941797M5[t] -17.4424603174601M6[t] -21.0844907407406M7[t] -26.726521164021M8[t] -25.8685515873014M9[t] -7.34093915343917M10[t] +  1.39203042328042M11[t] -0.107969576719577t  + e[t][/C][/ROW]
[/TABLE]
Source: https://freestatistics.org/blog/index.php?pk=25577&T=1

Globally Unique Identifier (entire table): ba.freestatistics.org/blog/index.php?pk=25577&T=1

As an alternative you can also use a QR Code:  

The GUIDs for individual cells are displayed in the table below:

Multiple Linear Regression - Estimated Regression Equation
Y[t] = + 134.000000000000 + 15.9553571428573X[t] -9.89203042328045M1[t] -3.87433862433845M2[t] -7.1413690476189M3[t] -8.78339947089932M4[t] -12.1754298941797M5[t] -17.4424603174601M6[t] -21.0844907407406M7[t] -26.726521164021M8[t] -25.8685515873014M9[t] -7.34093915343917M10[t] + 1.39203042328042M11[t] -0.107969576719577t + e[t]


Multiple Linear Regression - Ordinary Least Squares
VariableParameterS.D.T-STATH0: parameter = 02-tail p-value1-tail p-value
(Intercept)134.00000000000013.8966449.642600
X15.955357142857313.4168691.18920.2377520.118876
M1-9.892030423280456.21494-1.59170.1152640.057632
M2-3.8743386243384514.715624-0.26330.7929870.396493
M3-7.141369047618914.72206-0.48510.6288980.314449
M4-8.7833994708993214.728637-0.59630.5525660.276283
M5-12.175429894179714.735356-0.82630.4110180.205509
M6-17.442460317460114.742216-1.18320.2401220.120061
M7-21.084490740740614.749218-1.42950.1566040.078302
M8-26.72652116402114.75636-1.81120.073730.036865
M9-25.868551587301414.763644-1.75220.0834360.041718
M10-7.340939153439176.215453-1.18110.2409450.120472
M111.392030423280426.214940.2240.8233220.411661
t-0.1079695767195770.046138-2.34010.0216770.010839

\begin{tabular}{lllllllll}
\hline
Multiple Linear Regression - Ordinary Least Squares \tabularnewline
Variable & Parameter & S.D. & T-STATH0: parameter = 0 & 2-tail p-value & 1-tail p-value \tabularnewline
(Intercept) & 134.000000000000 & 13.896644 & 9.6426 & 0 & 0 \tabularnewline
X & 15.9553571428573 & 13.416869 & 1.1892 & 0.237752 & 0.118876 \tabularnewline
M1 & -9.89203042328045 & 6.21494 & -1.5917 & 0.115264 & 0.057632 \tabularnewline
M2 & -3.87433862433845 & 14.715624 & -0.2633 & 0.792987 & 0.396493 \tabularnewline
M3 & -7.1413690476189 & 14.72206 & -0.4851 & 0.628898 & 0.314449 \tabularnewline
M4 & -8.78339947089932 & 14.728637 & -0.5963 & 0.552566 & 0.276283 \tabularnewline
M5 & -12.1754298941797 & 14.735356 & -0.8263 & 0.411018 & 0.205509 \tabularnewline
M6 & -17.4424603174601 & 14.742216 & -1.1832 & 0.240122 & 0.120061 \tabularnewline
M7 & -21.0844907407406 & 14.749218 & -1.4295 & 0.156604 & 0.078302 \tabularnewline
M8 & -26.726521164021 & 14.75636 & -1.8112 & 0.07373 & 0.036865 \tabularnewline
M9 & -25.8685515873014 & 14.763644 & -1.7522 & 0.083436 & 0.041718 \tabularnewline
M10 & -7.34093915343917 & 6.215453 & -1.1811 & 0.240945 & 0.120472 \tabularnewline
M11 & 1.39203042328042 & 6.21494 & 0.224 & 0.823322 & 0.411661 \tabularnewline
t & -0.107969576719577 & 0.046138 & -2.3401 & 0.021677 & 0.010839 \tabularnewline
\hline
\end{tabular}
%Source: https://freestatistics.org/blog/index.php?pk=25577&T=2

[TABLE]
[ROW][C]Multiple Linear Regression - Ordinary Least Squares[/C][/ROW]
[ROW][C]Variable[/C][C]Parameter[/C][C]S.D.[/C][C]T-STATH0: parameter = 0[/C][C]2-tail p-value[/C][C]1-tail p-value[/C][/ROW]
[ROW][C](Intercept)[/C][C]134.000000000000[/C][C]13.896644[/C][C]9.6426[/C][C]0[/C][C]0[/C][/ROW]
[ROW][C]X[/C][C]15.9553571428573[/C][C]13.416869[/C][C]1.1892[/C][C]0.237752[/C][C]0.118876[/C][/ROW]
[ROW][C]M1[/C][C]-9.89203042328045[/C][C]6.21494[/C][C]-1.5917[/C][C]0.115264[/C][C]0.057632[/C][/ROW]
[ROW][C]M2[/C][C]-3.87433862433845[/C][C]14.715624[/C][C]-0.2633[/C][C]0.792987[/C][C]0.396493[/C][/ROW]
[ROW][C]M3[/C][C]-7.1413690476189[/C][C]14.72206[/C][C]-0.4851[/C][C]0.628898[/C][C]0.314449[/C][/ROW]
[ROW][C]M4[/C][C]-8.78339947089932[/C][C]14.728637[/C][C]-0.5963[/C][C]0.552566[/C][C]0.276283[/C][/ROW]
[ROW][C]M5[/C][C]-12.1754298941797[/C][C]14.735356[/C][C]-0.8263[/C][C]0.411018[/C][C]0.205509[/C][/ROW]
[ROW][C]M6[/C][C]-17.4424603174601[/C][C]14.742216[/C][C]-1.1832[/C][C]0.240122[/C][C]0.120061[/C][/ROW]
[ROW][C]M7[/C][C]-21.0844907407406[/C][C]14.749218[/C][C]-1.4295[/C][C]0.156604[/C][C]0.078302[/C][/ROW]
[ROW][C]M8[/C][C]-26.726521164021[/C][C]14.75636[/C][C]-1.8112[/C][C]0.07373[/C][C]0.036865[/C][/ROW]
[ROW][C]M9[/C][C]-25.8685515873014[/C][C]14.763644[/C][C]-1.7522[/C][C]0.083436[/C][C]0.041718[/C][/ROW]
[ROW][C]M10[/C][C]-7.34093915343917[/C][C]6.215453[/C][C]-1.1811[/C][C]0.240945[/C][C]0.120472[/C][/ROW]
[ROW][C]M11[/C][C]1.39203042328042[/C][C]6.21494[/C][C]0.224[/C][C]0.823322[/C][C]0.411661[/C][/ROW]
[ROW][C]t[/C][C]-0.107969576719577[/C][C]0.046138[/C][C]-2.3401[/C][C]0.021677[/C][C]0.010839[/C][/ROW]
[/TABLE]
Source: https://freestatistics.org/blog/index.php?pk=25577&T=2

Globally Unique Identifier (entire table): ba.freestatistics.org/blog/index.php?pk=25577&T=2

As an alternative you can also use a QR Code:  

The GUIDs for individual cells are displayed in the table below:

Multiple Linear Regression - Ordinary Least Squares
VariableParameterS.D.T-STATH0: parameter = 02-tail p-value1-tail p-value
(Intercept)134.00000000000013.8966449.642600
X15.955357142857313.4168691.18920.2377520.118876
M1-9.892030423280456.21494-1.59170.1152640.057632
M2-3.8743386243384514.715624-0.26330.7929870.396493
M3-7.141369047618914.72206-0.48510.6288980.314449
M4-8.7833994708993214.728637-0.59630.5525660.276283
M5-12.175429894179714.735356-0.82630.4110180.205509
M6-17.442460317460114.742216-1.18320.2401220.120061
M7-21.084490740740614.749218-1.42950.1566040.078302
M8-26.72652116402114.75636-1.81120.073730.036865
M9-25.868551587301414.763644-1.75220.0834360.041718
M10-7.340939153439176.215453-1.18110.2409450.120472
M111.392030423280426.214940.2240.8233220.411661
t-0.1079695767195770.046138-2.34010.0216770.010839


Multiple Linear Regression - Regression Statistics
Multiple R0.79025662180139
R-squared0.624505528300945
Adjusted R-squared0.565693141167358
F-TEST (value)10.6186053438443
F-TEST (DF numerator)13
F-TEST (DF denominator)83
p-value7.49511563924443e-13
Multiple Linear Regression - Residual Statistics
Residual Standard Deviation12.4295365269589
Sum Squared Residuals12822.9503968254

\begin{tabular}{lllllllll}
\hline
Multiple Linear Regression - Regression Statistics \tabularnewline
Multiple R & 0.79025662180139 \tabularnewline
R-squared & 0.624505528300945 \tabularnewline
Adjusted R-squared & 0.565693141167358 \tabularnewline
F-TEST (value) & 10.6186053438443 \tabularnewline
F-TEST (DF numerator) & 13 \tabularnewline
F-TEST (DF denominator) & 83 \tabularnewline
p-value & 7.49511563924443e-13 \tabularnewline
Multiple Linear Regression - Residual Statistics \tabularnewline
Residual Standard Deviation & 12.4295365269589 \tabularnewline
Sum Squared Residuals & 12822.9503968254 \tabularnewline
\hline
\end{tabular}
%Source: https://freestatistics.org/blog/index.php?pk=25577&T=3

[TABLE]
[ROW][C]Multiple Linear Regression - Regression Statistics[/C][/ROW]
[ROW][C]Multiple R[/C][C]0.79025662180139[/C][/ROW]
[ROW][C]R-squared[/C][C]0.624505528300945[/C][/ROW]
[ROW][C]Adjusted R-squared[/C][C]0.565693141167358[/C][/ROW]
[ROW][C]F-TEST (value)[/C][C]10.6186053438443[/C][/ROW]
[ROW][C]F-TEST (DF numerator)[/C][C]13[/C][/ROW]
[ROW][C]F-TEST (DF denominator)[/C][C]83[/C][/ROW]
[ROW][C]p-value[/C][C]7.49511563924443e-13[/C][/ROW]
[ROW][C]Multiple Linear Regression - Residual Statistics[/C][/ROW]
[ROW][C]Residual Standard Deviation[/C][C]12.4295365269589[/C][/ROW]
[ROW][C]Sum Squared Residuals[/C][C]12822.9503968254[/C][/ROW]
[/TABLE]
Source: https://freestatistics.org/blog/index.php?pk=25577&T=3

Globally Unique Identifier (entire table): ba.freestatistics.org/blog/index.php?pk=25577&T=3

As an alternative you can also use a QR Code:  

The GUIDs for individual cells are displayed in the table below:

Multiple Linear Regression - Regression Statistics
Multiple R0.79025662180139
R-squared0.624505528300945
Adjusted R-squared0.565693141167358
F-TEST (value)10.6186053438443
F-TEST (DF numerator)13
F-TEST (DF denominator)83
p-value7.49511563924443e-13
Multiple Linear Regression - Residual Statistics
Residual Standard Deviation12.4295365269589
Sum Squared Residuals12822.9503968254


Multiple Linear Regression - Actuals, Interpolation, and Residuals
Time or IndexActualsInterpolationForecastResidualsPrediction Error
1124124-8.43769498715119e-15
2113129.909722222222-16.9097222222223
3109126.534722222222-17.5347222222222
4109124.784722222222-15.7847222222223
5106121.284722222222-15.2847222222222
6101115.909722222222-14.9097222222222
798112.159722222222-14.1597222222222
893106.409722222222-13.4097222222223
991107.159722222222-16.1597222222222
10122141.534722222222-19.5347222222223
11139150.159722222222-11.1597222222222
12140148.659722222222-8.65972222222222
13132138.659722222222-6.65972222222221
14117128.614087301587-11.6140873015873
15114125.239087301587-11.2390873015873
16113123.489087301587-10.4890873015873
17110119.989087301587-9.9890873015873
18107114.614087301587-7.6140873015873
19103110.864087301587-7.8640873015873
2098105.114087301587-7.1140873015873
2198105.864087301587-7.86408730158731
22137140.239087301587-3.23908730158729
23148148.864087301587-0.864087301587299
24147147.364087301587-0.364087301587306
25139137.3640873015871.63591269841271
26130127.3184523809522.68154761904762
27128123.9434523809524.05654761904762
28127122.1934523809524.80654761904763
29123118.6934523809524.30654761904762
30118113.3184523809524.68154761904762
31114109.5684523809524.43154761904762
32108103.8184523809524.18154761904762
33111104.5684523809526.4315476190476
34151138.94345238095212.0565476190476
35159147.56845238095211.4315476190476
36158146.06845238095211.9315476190476
37148136.06845238095211.9315476190476
38138126.02281746031711.9771825396825
39137122.64781746031714.3521825396825
40136120.89781746031715.1021825396826
41133117.39781746031715.6021825396825
42126112.02281746031713.9771825396825
43120108.27281746031711.7271825396825
44114102.52281746031711.4771825396825
45116103.27281746031712.7271825396825
46153137.64781746031715.3521825396826
47162146.27281746031715.7271825396825
48161144.77281746031716.2271825396825
49149134.77281746031714.2271825396826
50139124.72718253968314.2728174603175
51135121.35218253968313.6478174603175
52130119.60218253968310.3978174603175
53127116.10218253968310.8978174603175
54122110.72718253968311.2728174603175
55117106.97718253968310.0228174603175
56112101.22718253968310.7728174603175
57113101.97718253968311.0228174603174
58149136.35218253968312.6478174603175
59157144.97718253968312.0228174603175
60157143.47718253968313.5228174603175
61147133.47718253968313.5228174603175
62137123.43154761904813.5684523809524
63132120.05654761904811.9434523809524
64125118.3065476190486.69345238095239
65123114.8065476190488.19345238095238
66117109.4315476190487.56845238095238
67114105.6815476190488.31845238095238
6811199.931547619047611.0684523809524
69112100.68154761904811.3184523809524
70144135.0565476190488.94345238095239
71150143.6815476190486.31845238095238
72149142.1815476190486.81845238095237
73134132.1815476190481.81845238095239
74123122.1359126984130.864087301587304
75116118.760912698413-2.7609126984127
76117117.010912698413-0.0109126984126943
77111113.510912698413-2.5109126984127
78105108.135912698413-3.1359126984127
79102104.385912698413-2.3859126984127
809598.6359126984127-3.6359126984127
819399.3859126984127-6.38591269841271
82124133.760912698413-9.76091269841268
83130142.385912698413-12.3859126984127
84124140.885912698413-16.8859126984127
85115130.885912698413-15.8859126984127
86106120.840277777778-14.8402777777778
87105117.465277777778-12.4652777777778
88105115.715277777778-10.7152777777778
89101112.215277777778-11.2152777777778
9095106.840277777778-11.8402777777778
9193103.090277777778-10.0902777777778
928497.3402777777778-13.3402777777778
938798.0902777777778-11.0902777777778
94116132.465277777778-16.4652777777778
95120141.090277777778-21.0902777777778
96117139.590277777778-22.5902777777778
97109129.590277777778-20.5902777777778

\begin{tabular}{lllllllll}
\hline
Multiple Linear Regression - Actuals, Interpolation, and Residuals \tabularnewline
Time or Index & Actuals & InterpolationForecast & ResidualsPrediction Error \tabularnewline
1 & 124 & 124 & -8.43769498715119e-15 \tabularnewline
2 & 113 & 129.909722222222 & -16.9097222222223 \tabularnewline
3 & 109 & 126.534722222222 & -17.5347222222222 \tabularnewline
4 & 109 & 124.784722222222 & -15.7847222222223 \tabularnewline
5 & 106 & 121.284722222222 & -15.2847222222222 \tabularnewline
6 & 101 & 115.909722222222 & -14.9097222222222 \tabularnewline
7 & 98 & 112.159722222222 & -14.1597222222222 \tabularnewline
8 & 93 & 106.409722222222 & -13.4097222222223 \tabularnewline
9 & 91 & 107.159722222222 & -16.1597222222222 \tabularnewline
10 & 122 & 141.534722222222 & -19.5347222222223 \tabularnewline
11 & 139 & 150.159722222222 & -11.1597222222222 \tabularnewline
12 & 140 & 148.659722222222 & -8.65972222222222 \tabularnewline
13 & 132 & 138.659722222222 & -6.65972222222221 \tabularnewline
14 & 117 & 128.614087301587 & -11.6140873015873 \tabularnewline
15 & 114 & 125.239087301587 & -11.2390873015873 \tabularnewline
16 & 113 & 123.489087301587 & -10.4890873015873 \tabularnewline
17 & 110 & 119.989087301587 & -9.9890873015873 \tabularnewline
18 & 107 & 114.614087301587 & -7.6140873015873 \tabularnewline
19 & 103 & 110.864087301587 & -7.8640873015873 \tabularnewline
20 & 98 & 105.114087301587 & -7.1140873015873 \tabularnewline
21 & 98 & 105.864087301587 & -7.86408730158731 \tabularnewline
22 & 137 & 140.239087301587 & -3.23908730158729 \tabularnewline
23 & 148 & 148.864087301587 & -0.864087301587299 \tabularnewline
24 & 147 & 147.364087301587 & -0.364087301587306 \tabularnewline
25 & 139 & 137.364087301587 & 1.63591269841271 \tabularnewline
26 & 130 & 127.318452380952 & 2.68154761904762 \tabularnewline
27 & 128 & 123.943452380952 & 4.05654761904762 \tabularnewline
28 & 127 & 122.193452380952 & 4.80654761904763 \tabularnewline
29 & 123 & 118.693452380952 & 4.30654761904762 \tabularnewline
30 & 118 & 113.318452380952 & 4.68154761904762 \tabularnewline
31 & 114 & 109.568452380952 & 4.43154761904762 \tabularnewline
32 & 108 & 103.818452380952 & 4.18154761904762 \tabularnewline
33 & 111 & 104.568452380952 & 6.4315476190476 \tabularnewline
34 & 151 & 138.943452380952 & 12.0565476190476 \tabularnewline
35 & 159 & 147.568452380952 & 11.4315476190476 \tabularnewline
36 & 158 & 146.068452380952 & 11.9315476190476 \tabularnewline
37 & 148 & 136.068452380952 & 11.9315476190476 \tabularnewline
38 & 138 & 126.022817460317 & 11.9771825396825 \tabularnewline
39 & 137 & 122.647817460317 & 14.3521825396825 \tabularnewline
40 & 136 & 120.897817460317 & 15.1021825396826 \tabularnewline
41 & 133 & 117.397817460317 & 15.6021825396825 \tabularnewline
42 & 126 & 112.022817460317 & 13.9771825396825 \tabularnewline
43 & 120 & 108.272817460317 & 11.7271825396825 \tabularnewline
44 & 114 & 102.522817460317 & 11.4771825396825 \tabularnewline
45 & 116 & 103.272817460317 & 12.7271825396825 \tabularnewline
46 & 153 & 137.647817460317 & 15.3521825396826 \tabularnewline
47 & 162 & 146.272817460317 & 15.7271825396825 \tabularnewline
48 & 161 & 144.772817460317 & 16.2271825396825 \tabularnewline
49 & 149 & 134.772817460317 & 14.2271825396826 \tabularnewline
50 & 139 & 124.727182539683 & 14.2728174603175 \tabularnewline
51 & 135 & 121.352182539683 & 13.6478174603175 \tabularnewline
52 & 130 & 119.602182539683 & 10.3978174603175 \tabularnewline
53 & 127 & 116.102182539683 & 10.8978174603175 \tabularnewline
54 & 122 & 110.727182539683 & 11.2728174603175 \tabularnewline
55 & 117 & 106.977182539683 & 10.0228174603175 \tabularnewline
56 & 112 & 101.227182539683 & 10.7728174603175 \tabularnewline
57 & 113 & 101.977182539683 & 11.0228174603174 \tabularnewline
58 & 149 & 136.352182539683 & 12.6478174603175 \tabularnewline
59 & 157 & 144.977182539683 & 12.0228174603175 \tabularnewline
60 & 157 & 143.477182539683 & 13.5228174603175 \tabularnewline
61 & 147 & 133.477182539683 & 13.5228174603175 \tabularnewline
62 & 137 & 123.431547619048 & 13.5684523809524 \tabularnewline
63 & 132 & 120.056547619048 & 11.9434523809524 \tabularnewline
64 & 125 & 118.306547619048 & 6.69345238095239 \tabularnewline
65 & 123 & 114.806547619048 & 8.19345238095238 \tabularnewline
66 & 117 & 109.431547619048 & 7.56845238095238 \tabularnewline
67 & 114 & 105.681547619048 & 8.31845238095238 \tabularnewline
68 & 111 & 99.9315476190476 & 11.0684523809524 \tabularnewline
69 & 112 & 100.681547619048 & 11.3184523809524 \tabularnewline
70 & 144 & 135.056547619048 & 8.94345238095239 \tabularnewline
71 & 150 & 143.681547619048 & 6.31845238095238 \tabularnewline
72 & 149 & 142.181547619048 & 6.81845238095237 \tabularnewline
73 & 134 & 132.181547619048 & 1.81845238095239 \tabularnewline
74 & 123 & 122.135912698413 & 0.864087301587304 \tabularnewline
75 & 116 & 118.760912698413 & -2.7609126984127 \tabularnewline
76 & 117 & 117.010912698413 & -0.0109126984126943 \tabularnewline
77 & 111 & 113.510912698413 & -2.5109126984127 \tabularnewline
78 & 105 & 108.135912698413 & -3.1359126984127 \tabularnewline
79 & 102 & 104.385912698413 & -2.3859126984127 \tabularnewline
80 & 95 & 98.6359126984127 & -3.6359126984127 \tabularnewline
81 & 93 & 99.3859126984127 & -6.38591269841271 \tabularnewline
82 & 124 & 133.760912698413 & -9.76091269841268 \tabularnewline
83 & 130 & 142.385912698413 & -12.3859126984127 \tabularnewline
84 & 124 & 140.885912698413 & -16.8859126984127 \tabularnewline
85 & 115 & 130.885912698413 & -15.8859126984127 \tabularnewline
86 & 106 & 120.840277777778 & -14.8402777777778 \tabularnewline
87 & 105 & 117.465277777778 & -12.4652777777778 \tabularnewline
88 & 105 & 115.715277777778 & -10.7152777777778 \tabularnewline
89 & 101 & 112.215277777778 & -11.2152777777778 \tabularnewline
90 & 95 & 106.840277777778 & -11.8402777777778 \tabularnewline
91 & 93 & 103.090277777778 & -10.0902777777778 \tabularnewline
92 & 84 & 97.3402777777778 & -13.3402777777778 \tabularnewline
93 & 87 & 98.0902777777778 & -11.0902777777778 \tabularnewline
94 & 116 & 132.465277777778 & -16.4652777777778 \tabularnewline
95 & 120 & 141.090277777778 & -21.0902777777778 \tabularnewline
96 & 117 & 139.590277777778 & -22.5902777777778 \tabularnewline
97 & 109 & 129.590277777778 & -20.5902777777778 \tabularnewline
\hline
\end{tabular}
%Source: https://freestatistics.org/blog/index.php?pk=25577&T=4

[TABLE]
[ROW][C]Multiple Linear Regression - Actuals, Interpolation, and Residuals[/C][/ROW]
[ROW][C]Time or Index[/C][C]Actuals[/C][C]InterpolationForecast[/C][C]ResidualsPrediction Error[/C][/ROW]
[ROW][C]1[/C][C]124[/C][C]124[/C][C]-8.43769498715119e-15[/C][/ROW]
[ROW][C]2[/C][C]113[/C][C]129.909722222222[/C][C]-16.9097222222223[/C][/ROW]
[ROW][C]3[/C][C]109[/C][C]126.534722222222[/C][C]-17.5347222222222[/C][/ROW]
[ROW][C]4[/C][C]109[/C][C]124.784722222222[/C][C]-15.7847222222223[/C][/ROW]
[ROW][C]5[/C][C]106[/C][C]121.284722222222[/C][C]-15.2847222222222[/C][/ROW]
[ROW][C]6[/C][C]101[/C][C]115.909722222222[/C][C]-14.9097222222222[/C][/ROW]
[ROW][C]7[/C][C]98[/C][C]112.159722222222[/C][C]-14.1597222222222[/C][/ROW]
[ROW][C]8[/C][C]93[/C][C]106.409722222222[/C][C]-13.4097222222223[/C][/ROW]
[ROW][C]9[/C][C]91[/C][C]107.159722222222[/C][C]-16.1597222222222[/C][/ROW]
[ROW][C]10[/C][C]122[/C][C]141.534722222222[/C][C]-19.5347222222223[/C][/ROW]
[ROW][C]11[/C][C]139[/C][C]150.159722222222[/C][C]-11.1597222222222[/C][/ROW]
[ROW][C]12[/C][C]140[/C][C]148.659722222222[/C][C]-8.65972222222222[/C][/ROW]
[ROW][C]13[/C][C]132[/C][C]138.659722222222[/C][C]-6.65972222222221[/C][/ROW]
[ROW][C]14[/C][C]117[/C][C]128.614087301587[/C][C]-11.6140873015873[/C][/ROW]
[ROW][C]15[/C][C]114[/C][C]125.239087301587[/C][C]-11.2390873015873[/C][/ROW]
[ROW][C]16[/C][C]113[/C][C]123.489087301587[/C][C]-10.4890873015873[/C][/ROW]
[ROW][C]17[/C][C]110[/C][C]119.989087301587[/C][C]-9.9890873015873[/C][/ROW]
[ROW][C]18[/C][C]107[/C][C]114.614087301587[/C][C]-7.6140873015873[/C][/ROW]
[ROW][C]19[/C][C]103[/C][C]110.864087301587[/C][C]-7.8640873015873[/C][/ROW]
[ROW][C]20[/C][C]98[/C][C]105.114087301587[/C][C]-7.1140873015873[/C][/ROW]
[ROW][C]21[/C][C]98[/C][C]105.864087301587[/C][C]-7.86408730158731[/C][/ROW]
[ROW][C]22[/C][C]137[/C][C]140.239087301587[/C][C]-3.23908730158729[/C][/ROW]
[ROW][C]23[/C][C]148[/C][C]148.864087301587[/C][C]-0.864087301587299[/C][/ROW]
[ROW][C]24[/C][C]147[/C][C]147.364087301587[/C][C]-0.364087301587306[/C][/ROW]
[ROW][C]25[/C][C]139[/C][C]137.364087301587[/C][C]1.63591269841271[/C][/ROW]
[ROW][C]26[/C][C]130[/C][C]127.318452380952[/C][C]2.68154761904762[/C][/ROW]
[ROW][C]27[/C][C]128[/C][C]123.943452380952[/C][C]4.05654761904762[/C][/ROW]
[ROW][C]28[/C][C]127[/C][C]122.193452380952[/C][C]4.80654761904763[/C][/ROW]
[ROW][C]29[/C][C]123[/C][C]118.693452380952[/C][C]4.30654761904762[/C][/ROW]
[ROW][C]30[/C][C]118[/C][C]113.318452380952[/C][C]4.68154761904762[/C][/ROW]
[ROW][C]31[/C][C]114[/C][C]109.568452380952[/C][C]4.43154761904762[/C][/ROW]
[ROW][C]32[/C][C]108[/C][C]103.818452380952[/C][C]4.18154761904762[/C][/ROW]
[ROW][C]33[/C][C]111[/C][C]104.568452380952[/C][C]6.4315476190476[/C][/ROW]
[ROW][C]34[/C][C]151[/C][C]138.943452380952[/C][C]12.0565476190476[/C][/ROW]
[ROW][C]35[/C][C]159[/C][C]147.568452380952[/C][C]11.4315476190476[/C][/ROW]
[ROW][C]36[/C][C]158[/C][C]146.068452380952[/C][C]11.9315476190476[/C][/ROW]
[ROW][C]37[/C][C]148[/C][C]136.068452380952[/C][C]11.9315476190476[/C][/ROW]
[ROW][C]38[/C][C]138[/C][C]126.022817460317[/C][C]11.9771825396825[/C][/ROW]
[ROW][C]39[/C][C]137[/C][C]122.647817460317[/C][C]14.3521825396825[/C][/ROW]
[ROW][C]40[/C][C]136[/C][C]120.897817460317[/C][C]15.1021825396826[/C][/ROW]
[ROW][C]41[/C][C]133[/C][C]117.397817460317[/C][C]15.6021825396825[/C][/ROW]
[ROW][C]42[/C][C]126[/C][C]112.022817460317[/C][C]13.9771825396825[/C][/ROW]
[ROW][C]43[/C][C]120[/C][C]108.272817460317[/C][C]11.7271825396825[/C][/ROW]
[ROW][C]44[/C][C]114[/C][C]102.522817460317[/C][C]11.4771825396825[/C][/ROW]
[ROW][C]45[/C][C]116[/C][C]103.272817460317[/C][C]12.7271825396825[/C][/ROW]
[ROW][C]46[/C][C]153[/C][C]137.647817460317[/C][C]15.3521825396826[/C][/ROW]
[ROW][C]47[/C][C]162[/C][C]146.272817460317[/C][C]15.7271825396825[/C][/ROW]
[ROW][C]48[/C][C]161[/C][C]144.772817460317[/C][C]16.2271825396825[/C][/ROW]
[ROW][C]49[/C][C]149[/C][C]134.772817460317[/C][C]14.2271825396826[/C][/ROW]
[ROW][C]50[/C][C]139[/C][C]124.727182539683[/C][C]14.2728174603175[/C][/ROW]
[ROW][C]51[/C][C]135[/C][C]121.352182539683[/C][C]13.6478174603175[/C][/ROW]
[ROW][C]52[/C][C]130[/C][C]119.602182539683[/C][C]10.3978174603175[/C][/ROW]
[ROW][C]53[/C][C]127[/C][C]116.102182539683[/C][C]10.8978174603175[/C][/ROW]
[ROW][C]54[/C][C]122[/C][C]110.727182539683[/C][C]11.2728174603175[/C][/ROW]
[ROW][C]55[/C][C]117[/C][C]106.977182539683[/C][C]10.0228174603175[/C][/ROW]
[ROW][C]56[/C][C]112[/C][C]101.227182539683[/C][C]10.7728174603175[/C][/ROW]
[ROW][C]57[/C][C]113[/C][C]101.977182539683[/C][C]11.0228174603174[/C][/ROW]
[ROW][C]58[/C][C]149[/C][C]136.352182539683[/C][C]12.6478174603175[/C][/ROW]
[ROW][C]59[/C][C]157[/C][C]144.977182539683[/C][C]12.0228174603175[/C][/ROW]
[ROW][C]60[/C][C]157[/C][C]143.477182539683[/C][C]13.5228174603175[/C][/ROW]
[ROW][C]61[/C][C]147[/C][C]133.477182539683[/C][C]13.5228174603175[/C][/ROW]
[ROW][C]62[/C][C]137[/C][C]123.431547619048[/C][C]13.5684523809524[/C][/ROW]
[ROW][C]63[/C][C]132[/C][C]120.056547619048[/C][C]11.9434523809524[/C][/ROW]
[ROW][C]64[/C][C]125[/C][C]118.306547619048[/C][C]6.69345238095239[/C][/ROW]
[ROW][C]65[/C][C]123[/C][C]114.806547619048[/C][C]8.19345238095238[/C][/ROW]
[ROW][C]66[/C][C]117[/C][C]109.431547619048[/C][C]7.56845238095238[/C][/ROW]
[ROW][C]67[/C][C]114[/C][C]105.681547619048[/C][C]8.31845238095238[/C][/ROW]
[ROW][C]68[/C][C]111[/C][C]99.9315476190476[/C][C]11.0684523809524[/C][/ROW]
[ROW][C]69[/C][C]112[/C][C]100.681547619048[/C][C]11.3184523809524[/C][/ROW]
[ROW][C]70[/C][C]144[/C][C]135.056547619048[/C][C]8.94345238095239[/C][/ROW]
[ROW][C]71[/C][C]150[/C][C]143.681547619048[/C][C]6.31845238095238[/C][/ROW]
[ROW][C]72[/C][C]149[/C][C]142.181547619048[/C][C]6.81845238095237[/C][/ROW]
[ROW][C]73[/C][C]134[/C][C]132.181547619048[/C][C]1.81845238095239[/C][/ROW]
[ROW][C]74[/C][C]123[/C][C]122.135912698413[/C][C]0.864087301587304[/C][/ROW]
[ROW][C]75[/C][C]116[/C][C]118.760912698413[/C][C]-2.7609126984127[/C][/ROW]
[ROW][C]76[/C][C]117[/C][C]117.010912698413[/C][C]-0.0109126984126943[/C][/ROW]
[ROW][C]77[/C][C]111[/C][C]113.510912698413[/C][C]-2.5109126984127[/C][/ROW]
[ROW][C]78[/C][C]105[/C][C]108.135912698413[/C][C]-3.1359126984127[/C][/ROW]
[ROW][C]79[/C][C]102[/C][C]104.385912698413[/C][C]-2.3859126984127[/C][/ROW]
[ROW][C]80[/C][C]95[/C][C]98.6359126984127[/C][C]-3.6359126984127[/C][/ROW]
[ROW][C]81[/C][C]93[/C][C]99.3859126984127[/C][C]-6.38591269841271[/C][/ROW]
[ROW][C]82[/C][C]124[/C][C]133.760912698413[/C][C]-9.76091269841268[/C][/ROW]
[ROW][C]83[/C][C]130[/C][C]142.385912698413[/C][C]-12.3859126984127[/C][/ROW]
[ROW][C]84[/C][C]124[/C][C]140.885912698413[/C][C]-16.8859126984127[/C][/ROW]
[ROW][C]85[/C][C]115[/C][C]130.885912698413[/C][C]-15.8859126984127[/C][/ROW]
[ROW][C]86[/C][C]106[/C][C]120.840277777778[/C][C]-14.8402777777778[/C][/ROW]
[ROW][C]87[/C][C]105[/C][C]117.465277777778[/C][C]-12.4652777777778[/C][/ROW]
[ROW][C]88[/C][C]105[/C][C]115.715277777778[/C][C]-10.7152777777778[/C][/ROW]
[ROW][C]89[/C][C]101[/C][C]112.215277777778[/C][C]-11.2152777777778[/C][/ROW]
[ROW][C]90[/C][C]95[/C][C]106.840277777778[/C][C]-11.8402777777778[/C][/ROW]
[ROW][C]91[/C][C]93[/C][C]103.090277777778[/C][C]-10.0902777777778[/C][/ROW]
[ROW][C]92[/C][C]84[/C][C]97.3402777777778[/C][C]-13.3402777777778[/C][/ROW]
[ROW][C]93[/C][C]87[/C][C]98.0902777777778[/C][C]-11.0902777777778[/C][/ROW]
[ROW][C]94[/C][C]116[/C][C]132.465277777778[/C][C]-16.4652777777778[/C][/ROW]
[ROW][C]95[/C][C]120[/C][C]141.090277777778[/C][C]-21.0902777777778[/C][/ROW]
[ROW][C]96[/C][C]117[/C][C]139.590277777778[/C][C]-22.5902777777778[/C][/ROW]
[ROW][C]97[/C][C]109[/C][C]129.590277777778[/C][C]-20.5902777777778[/C][/ROW]
[/TABLE]
Source: https://freestatistics.org/blog/index.php?pk=25577&T=4

Globally Unique Identifier (entire table): ba.freestatistics.org/blog/index.php?pk=25577&T=4

As an alternative you can also use a QR Code:  

The GUIDs for individual cells are displayed in the table below:

Multiple Linear Regression - Actuals, Interpolation, and Residuals
Time or IndexActualsInterpolationForecastResidualsPrediction Error
1124124-8.43769498715119e-15
2113129.909722222222-16.9097222222223
3109126.534722222222-17.5347222222222
4109124.784722222222-15.7847222222223
5106121.284722222222-15.2847222222222
6101115.909722222222-14.9097222222222
798112.159722222222-14.1597222222222
893106.409722222222-13.4097222222223
991107.159722222222-16.1597222222222
10122141.534722222222-19.5347222222223
11139150.159722222222-11.1597222222222
12140148.659722222222-8.65972222222222
13132138.659722222222-6.65972222222221
14117128.614087301587-11.6140873015873
15114125.239087301587-11.2390873015873
16113123.489087301587-10.4890873015873
17110119.989087301587-9.9890873015873
18107114.614087301587-7.6140873015873
19103110.864087301587-7.8640873015873
2098105.114087301587-7.1140873015873
2198105.864087301587-7.86408730158731
22137140.239087301587-3.23908730158729
23148148.864087301587-0.864087301587299
24147147.364087301587-0.364087301587306
25139137.3640873015871.63591269841271
26130127.3184523809522.68154761904762
27128123.9434523809524.05654761904762
28127122.1934523809524.80654761904763
29123118.6934523809524.30654761904762
30118113.3184523809524.68154761904762
31114109.5684523809524.43154761904762
32108103.8184523809524.18154761904762
33111104.5684523809526.4315476190476
34151138.94345238095212.0565476190476
35159147.56845238095211.4315476190476
36158146.06845238095211.9315476190476
37148136.06845238095211.9315476190476
38138126.02281746031711.9771825396825
39137122.64781746031714.3521825396825
40136120.89781746031715.1021825396826
41133117.39781746031715.6021825396825
42126112.02281746031713.9771825396825
43120108.27281746031711.7271825396825
44114102.52281746031711.4771825396825
45116103.27281746031712.7271825396825
46153137.64781746031715.3521825396826
47162146.27281746031715.7271825396825
48161144.77281746031716.2271825396825
49149134.77281746031714.2271825396826
50139124.72718253968314.2728174603175
51135121.35218253968313.6478174603175
52130119.60218253968310.3978174603175
53127116.10218253968310.8978174603175
54122110.72718253968311.2728174603175
55117106.97718253968310.0228174603175
56112101.22718253968310.7728174603175
57113101.97718253968311.0228174603174
58149136.35218253968312.6478174603175
59157144.97718253968312.0228174603175
60157143.47718253968313.5228174603175
61147133.47718253968313.5228174603175
62137123.43154761904813.5684523809524
63132120.05654761904811.9434523809524
64125118.3065476190486.69345238095239
65123114.8065476190488.19345238095238
66117109.4315476190487.56845238095238
67114105.6815476190488.31845238095238
6811199.931547619047611.0684523809524
69112100.68154761904811.3184523809524
70144135.0565476190488.94345238095239
71150143.6815476190486.31845238095238
72149142.1815476190486.81845238095237
73134132.1815476190481.81845238095239
74123122.1359126984130.864087301587304
75116118.760912698413-2.7609126984127
76117117.010912698413-0.0109126984126943
77111113.510912698413-2.5109126984127
78105108.135912698413-3.1359126984127
79102104.385912698413-2.3859126984127
809598.6359126984127-3.6359126984127
819399.3859126984127-6.38591269841271
82124133.760912698413-9.76091269841268
83130142.385912698413-12.3859126984127
84124140.885912698413-16.8859126984127
85115130.885912698413-15.8859126984127
86106120.840277777778-14.8402777777778
87105117.465277777778-12.4652777777778
88105115.715277777778-10.7152777777778
89101112.215277777778-11.2152777777778
9095106.840277777778-11.8402777777778
9193103.090277777778-10.0902777777778
928497.3402777777778-13.3402777777778
938798.0902777777778-11.0902777777778
94116132.465277777778-16.4652777777778
95120141.090277777778-21.0902777777778
96117139.590277777778-22.5902777777778
97109129.590277777778-20.5902777777778


Goldfeld-Quandt test for Heteroskedasticity
p-valuesAlternative Hypothesis
breakpoint indexgreater2-sidedless
176.2641703918555e-050.000125283407837110.999937358296081
183.70343312513454e-057.40686625026908e-050.999962965668749
192.72705157862402e-065.45410315724804e-060.999997272948421
202.02094521616298e-074.04189043232596e-070.999999797905478
212.95669508954081e-075.91339017908162e-070.999999704330491
220.0005299576497851770.001059915299570350.999470042350215
230.0002536804099338420.0005073608198676850.999746319590066
249.58513692382124e-050.0001917027384764250.999904148630762
253.49499462636003e-056.98998925272007e-050.999965050053736
265.34025932889695e-050.0001068051865779390.99994659740671
279.42438345116769e-050.0001884876690233540.999905756165488
289.49460059119289e-050.0001898920118238580.999905053994088
297.48265972426933e-050.0001496531944853870.999925173402757
305.29004494029706e-050.0001058008988059410.999947099550597
314.37694205656377e-058.75388411312754e-050.999956230579434
324.7032167318997e-059.4064334637994e-050.99995296783268
339.84162002795716e-050.0001968324005591430.99990158379972
340.0007917337355231880.001583467471046380.999208266264477
350.000637622920838290.001275245841676580.999362377079162
360.00046885286215420.00093770572430840.999531147137846
370.0003708591116395140.0007417182232790280.99962914088836
380.0003359321741586290.0006718643483172580.999664067825841
390.0002551753374965140.0005103506749930280.999744824662503
400.0001658735544715830.0003317471089431660.999834126445528
410.0001068729892031180.0002137459784062360.999893127010797
428.33535612173559e-050.0001667071224347120.999916646438783
430.0001752267893177480.0003504535786354960.999824773210682
440.0005112382311763560.001022476462352710.999488761768824
450.0009738938196778250.001947787639355650.999026106180322
460.0008800850385817750.001760170077163550.999119914961418
470.001105501342012180.002211002684024370.998894498657988
480.001386081329148800.002772162658297610.998613918670851
490.004901548240659840.009803096481319690.99509845175934
500.00943700960949110.01887401921898220.99056299039051
510.02002063230499940.04004126460999870.979979367695
520.1025540156964990.2051080313929980.897445984303501
530.2347022899171810.4694045798343620.765297710082819
540.3752591443654920.7505182887309830.624740855634508
550.6206139541800370.7587720916399260.379386045819963
560.7969290712008160.4061418575983680.203070928799184
570.9219514715167820.1560970569664350.0780485284832175
580.9425186566026660.1149626867946670.0574813433973337
590.9570657045262330.08586859094753440.0429342954737672
600.9595476124627740.08090477507445230.0404523875372262
610.961436424707130.07712715058574070.0385635752928704
620.9604296456952360.07914070860952730.0395703543047637
630.960073797162990.0798524056740210.0399262028370105
640.9785891135071440.04282177298571270.0214108864928564
650.9799202710893430.04015945782131330.0200797289106567
660.9806830580249620.03863388395007600.0193169419750380
670.9795267432733750.04094651345325010.0204732567266251
680.9706866679732190.05862666405356180.0293133320267809
690.9588542498992250.08229150020155070.0411457501007753
700.959417275910160.08116544817967980.0405827240898399
710.9739825716559410.05203485668811770.0260174283440589
720.9984610539555780.003077892088843930.00153894604442197
730.9997012375753060.0005975248493881260.000298762424694063
740.999982054105413.58917891795488e-051.79458945897744e-05
750.9999627935664857.44128670306412e-053.72064335153206e-05
760.9999500087791089.99824417840524e-054.99912208920262e-05
770.9998262129713730.0003475740572541150.000173787028627058
780.9993887014896580.001222597020684770.000611298510342383
790.9970697594017630.005860481196474410.00293024059823721
800.9945816902025650.01083661959486950.00541830979743475

\begin{tabular}{lllllllll}
\hline
Goldfeld-Quandt test for Heteroskedasticity \tabularnewline
p-values & Alternative Hypothesis \tabularnewline
breakpoint index & greater & 2-sided & less \tabularnewline
17 & 6.2641703918555e-05 & 0.00012528340783711 & 0.999937358296081 \tabularnewline
18 & 3.70343312513454e-05 & 7.40686625026908e-05 & 0.999962965668749 \tabularnewline
19 & 2.72705157862402e-06 & 5.45410315724804e-06 & 0.999997272948421 \tabularnewline
20 & 2.02094521616298e-07 & 4.04189043232596e-07 & 0.999999797905478 \tabularnewline
21 & 2.95669508954081e-07 & 5.91339017908162e-07 & 0.999999704330491 \tabularnewline
22 & 0.000529957649785177 & 0.00105991529957035 & 0.999470042350215 \tabularnewline
23 & 0.000253680409933842 & 0.000507360819867685 & 0.999746319590066 \tabularnewline
24 & 9.58513692382124e-05 & 0.000191702738476425 & 0.999904148630762 \tabularnewline
25 & 3.49499462636003e-05 & 6.98998925272007e-05 & 0.999965050053736 \tabularnewline
26 & 5.34025932889695e-05 & 0.000106805186577939 & 0.99994659740671 \tabularnewline
27 & 9.42438345116769e-05 & 0.000188487669023354 & 0.999905756165488 \tabularnewline
28 & 9.49460059119289e-05 & 0.000189892011823858 & 0.999905053994088 \tabularnewline
29 & 7.48265972426933e-05 & 0.000149653194485387 & 0.999925173402757 \tabularnewline
30 & 5.29004494029706e-05 & 0.000105800898805941 & 0.999947099550597 \tabularnewline
31 & 4.37694205656377e-05 & 8.75388411312754e-05 & 0.999956230579434 \tabularnewline
32 & 4.7032167318997e-05 & 9.4064334637994e-05 & 0.99995296783268 \tabularnewline
33 & 9.84162002795716e-05 & 0.000196832400559143 & 0.99990158379972 \tabularnewline
34 & 0.000791733735523188 & 0.00158346747104638 & 0.999208266264477 \tabularnewline
35 & 0.00063762292083829 & 0.00127524584167658 & 0.999362377079162 \tabularnewline
36 & 0.0004688528621542 & 0.0009377057243084 & 0.999531147137846 \tabularnewline
37 & 0.000370859111639514 & 0.000741718223279028 & 0.99962914088836 \tabularnewline
38 & 0.000335932174158629 & 0.000671864348317258 & 0.999664067825841 \tabularnewline
39 & 0.000255175337496514 & 0.000510350674993028 & 0.999744824662503 \tabularnewline
40 & 0.000165873554471583 & 0.000331747108943166 & 0.999834126445528 \tabularnewline
41 & 0.000106872989203118 & 0.000213745978406236 & 0.999893127010797 \tabularnewline
42 & 8.33535612173559e-05 & 0.000166707122434712 & 0.999916646438783 \tabularnewline
43 & 0.000175226789317748 & 0.000350453578635496 & 0.999824773210682 \tabularnewline
44 & 0.000511238231176356 & 0.00102247646235271 & 0.999488761768824 \tabularnewline
45 & 0.000973893819677825 & 0.00194778763935565 & 0.999026106180322 \tabularnewline
46 & 0.000880085038581775 & 0.00176017007716355 & 0.999119914961418 \tabularnewline
47 & 0.00110550134201218 & 0.00221100268402437 & 0.998894498657988 \tabularnewline
48 & 0.00138608132914880 & 0.00277216265829761 & 0.998613918670851 \tabularnewline
49 & 0.00490154824065984 & 0.00980309648131969 & 0.99509845175934 \tabularnewline
50 & 0.0094370096094911 & 0.0188740192189822 & 0.99056299039051 \tabularnewline
51 & 0.0200206323049994 & 0.0400412646099987 & 0.979979367695 \tabularnewline
52 & 0.102554015696499 & 0.205108031392998 & 0.897445984303501 \tabularnewline
53 & 0.234702289917181 & 0.469404579834362 & 0.765297710082819 \tabularnewline
54 & 0.375259144365492 & 0.750518288730983 & 0.624740855634508 \tabularnewline
55 & 0.620613954180037 & 0.758772091639926 & 0.379386045819963 \tabularnewline
56 & 0.796929071200816 & 0.406141857598368 & 0.203070928799184 \tabularnewline
57 & 0.921951471516782 & 0.156097056966435 & 0.0780485284832175 \tabularnewline
58 & 0.942518656602666 & 0.114962686794667 & 0.0574813433973337 \tabularnewline
59 & 0.957065704526233 & 0.0858685909475344 & 0.0429342954737672 \tabularnewline
60 & 0.959547612462774 & 0.0809047750744523 & 0.0404523875372262 \tabularnewline
61 & 0.96143642470713 & 0.0771271505857407 & 0.0385635752928704 \tabularnewline
62 & 0.960429645695236 & 0.0791407086095273 & 0.0395703543047637 \tabularnewline
63 & 0.96007379716299 & 0.079852405674021 & 0.0399262028370105 \tabularnewline
64 & 0.978589113507144 & 0.0428217729857127 & 0.0214108864928564 \tabularnewline
65 & 0.979920271089343 & 0.0401594578213133 & 0.0200797289106567 \tabularnewline
66 & 0.980683058024962 & 0.0386338839500760 & 0.0193169419750380 \tabularnewline
67 & 0.979526743273375 & 0.0409465134532501 & 0.0204732567266251 \tabularnewline
68 & 0.970686667973219 & 0.0586266640535618 & 0.0293133320267809 \tabularnewline
69 & 0.958854249899225 & 0.0822915002015507 & 0.0411457501007753 \tabularnewline
70 & 0.95941727591016 & 0.0811654481796798 & 0.0405827240898399 \tabularnewline
71 & 0.973982571655941 & 0.0520348566881177 & 0.0260174283440589 \tabularnewline
72 & 0.998461053955578 & 0.00307789208884393 & 0.00153894604442197 \tabularnewline
73 & 0.999701237575306 & 0.000597524849388126 & 0.000298762424694063 \tabularnewline
74 & 0.99998205410541 & 3.58917891795488e-05 & 1.79458945897744e-05 \tabularnewline
75 & 0.999962793566485 & 7.44128670306412e-05 & 3.72064335153206e-05 \tabularnewline
76 & 0.999950008779108 & 9.99824417840524e-05 & 4.99912208920262e-05 \tabularnewline
77 & 0.999826212971373 & 0.000347574057254115 & 0.000173787028627058 \tabularnewline
78 & 0.999388701489658 & 0.00122259702068477 & 0.000611298510342383 \tabularnewline
79 & 0.997069759401763 & 0.00586048119647441 & 0.00293024059823721 \tabularnewline
80 & 0.994581690202565 & 0.0108366195948695 & 0.00541830979743475 \tabularnewline
\hline
\end{tabular}
%Source: https://freestatistics.org/blog/index.php?pk=25577&T=5

[TABLE]
[ROW][C]Goldfeld-Quandt test for Heteroskedasticity[/C][/ROW]
[ROW][C]p-values[/C][C]Alternative Hypothesis[/C][/ROW]
[ROW][C]breakpoint index[/C][C]greater[/C][C]2-sided[/C][C]less[/C][/ROW]
[ROW][C]17[/C][C]6.2641703918555e-05[/C][C]0.00012528340783711[/C][C]0.999937358296081[/C][/ROW]
[ROW][C]18[/C][C]3.70343312513454e-05[/C][C]7.40686625026908e-05[/C][C]0.999962965668749[/C][/ROW]
[ROW][C]19[/C][C]2.72705157862402e-06[/C][C]5.45410315724804e-06[/C][C]0.999997272948421[/C][/ROW]
[ROW][C]20[/C][C]2.02094521616298e-07[/C][C]4.04189043232596e-07[/C][C]0.999999797905478[/C][/ROW]
[ROW][C]21[/C][C]2.95669508954081e-07[/C][C]5.91339017908162e-07[/C][C]0.999999704330491[/C][/ROW]
[ROW][C]22[/C][C]0.000529957649785177[/C][C]0.00105991529957035[/C][C]0.999470042350215[/C][/ROW]
[ROW][C]23[/C][C]0.000253680409933842[/C][C]0.000507360819867685[/C][C]0.999746319590066[/C][/ROW]
[ROW][C]24[/C][C]9.58513692382124e-05[/C][C]0.000191702738476425[/C][C]0.999904148630762[/C][/ROW]
[ROW][C]25[/C][C]3.49499462636003e-05[/C][C]6.98998925272007e-05[/C][C]0.999965050053736[/C][/ROW]
[ROW][C]26[/C][C]5.34025932889695e-05[/C][C]0.000106805186577939[/C][C]0.99994659740671[/C][/ROW]
[ROW][C]27[/C][C]9.42438345116769e-05[/C][C]0.000188487669023354[/C][C]0.999905756165488[/C][/ROW]
[ROW][C]28[/C][C]9.49460059119289e-05[/C][C]0.000189892011823858[/C][C]0.999905053994088[/C][/ROW]
[ROW][C]29[/C][C]7.48265972426933e-05[/C][C]0.000149653194485387[/C][C]0.999925173402757[/C][/ROW]
[ROW][C]30[/C][C]5.29004494029706e-05[/C][C]0.000105800898805941[/C][C]0.999947099550597[/C][/ROW]
[ROW][C]31[/C][C]4.37694205656377e-05[/C][C]8.75388411312754e-05[/C][C]0.999956230579434[/C][/ROW]
[ROW][C]32[/C][C]4.7032167318997e-05[/C][C]9.4064334637994e-05[/C][C]0.99995296783268[/C][/ROW]
[ROW][C]33[/C][C]9.84162002795716e-05[/C][C]0.000196832400559143[/C][C]0.99990158379972[/C][/ROW]
[ROW][C]34[/C][C]0.000791733735523188[/C][C]0.00158346747104638[/C][C]0.999208266264477[/C][/ROW]
[ROW][C]35[/C][C]0.00063762292083829[/C][C]0.00127524584167658[/C][C]0.999362377079162[/C][/ROW]
[ROW][C]36[/C][C]0.0004688528621542[/C][C]0.0009377057243084[/C][C]0.999531147137846[/C][/ROW]
[ROW][C]37[/C][C]0.000370859111639514[/C][C]0.000741718223279028[/C][C]0.99962914088836[/C][/ROW]
[ROW][C]38[/C][C]0.000335932174158629[/C][C]0.000671864348317258[/C][C]0.999664067825841[/C][/ROW]
[ROW][C]39[/C][C]0.000255175337496514[/C][C]0.000510350674993028[/C][C]0.999744824662503[/C][/ROW]
[ROW][C]40[/C][C]0.000165873554471583[/C][C]0.000331747108943166[/C][C]0.999834126445528[/C][/ROW]
[ROW][C]41[/C][C]0.000106872989203118[/C][C]0.000213745978406236[/C][C]0.999893127010797[/C][/ROW]
[ROW][C]42[/C][C]8.33535612173559e-05[/C][C]0.000166707122434712[/C][C]0.999916646438783[/C][/ROW]
[ROW][C]43[/C][C]0.000175226789317748[/C][C]0.000350453578635496[/C][C]0.999824773210682[/C][/ROW]
[ROW][C]44[/C][C]0.000511238231176356[/C][C]0.00102247646235271[/C][C]0.999488761768824[/C][/ROW]
[ROW][C]45[/C][C]0.000973893819677825[/C][C]0.00194778763935565[/C][C]0.999026106180322[/C][/ROW]
[ROW][C]46[/C][C]0.000880085038581775[/C][C]0.00176017007716355[/C][C]0.999119914961418[/C][/ROW]
[ROW][C]47[/C][C]0.00110550134201218[/C][C]0.00221100268402437[/C][C]0.998894498657988[/C][/ROW]
[ROW][C]48[/C][C]0.00138608132914880[/C][C]0.00277216265829761[/C][C]0.998613918670851[/C][/ROW]
[ROW][C]49[/C][C]0.00490154824065984[/C][C]0.00980309648131969[/C][C]0.99509845175934[/C][/ROW]
[ROW][C]50[/C][C]0.0094370096094911[/C][C]0.0188740192189822[/C][C]0.99056299039051[/C][/ROW]
[ROW][C]51[/C][C]0.0200206323049994[/C][C]0.0400412646099987[/C][C]0.979979367695[/C][/ROW]
[ROW][C]52[/C][C]0.102554015696499[/C][C]0.205108031392998[/C][C]0.897445984303501[/C][/ROW]
[ROW][C]53[/C][C]0.234702289917181[/C][C]0.469404579834362[/C][C]0.765297710082819[/C][/ROW]
[ROW][C]54[/C][C]0.375259144365492[/C][C]0.750518288730983[/C][C]0.624740855634508[/C][/ROW]
[ROW][C]55[/C][C]0.620613954180037[/C][C]0.758772091639926[/C][C]0.379386045819963[/C][/ROW]
[ROW][C]56[/C][C]0.796929071200816[/C][C]0.406141857598368[/C][C]0.203070928799184[/C][/ROW]
[ROW][C]57[/C][C]0.921951471516782[/C][C]0.156097056966435[/C][C]0.0780485284832175[/C][/ROW]
[ROW][C]58[/C][C]0.942518656602666[/C][C]0.114962686794667[/C][C]0.0574813433973337[/C][/ROW]
[ROW][C]59[/C][C]0.957065704526233[/C][C]0.0858685909475344[/C][C]0.0429342954737672[/C][/ROW]
[ROW][C]60[/C][C]0.959547612462774[/C][C]0.0809047750744523[/C][C]0.0404523875372262[/C][/ROW]
[ROW][C]61[/C][C]0.96143642470713[/C][C]0.0771271505857407[/C][C]0.0385635752928704[/C][/ROW]
[ROW][C]62[/C][C]0.960429645695236[/C][C]0.0791407086095273[/C][C]0.0395703543047637[/C][/ROW]
[ROW][C]63[/C][C]0.96007379716299[/C][C]0.079852405674021[/C][C]0.0399262028370105[/C][/ROW]
[ROW][C]64[/C][C]0.978589113507144[/C][C]0.0428217729857127[/C][C]0.0214108864928564[/C][/ROW]
[ROW][C]65[/C][C]0.979920271089343[/C][C]0.0401594578213133[/C][C]0.0200797289106567[/C][/ROW]
[ROW][C]66[/C][C]0.980683058024962[/C][C]0.0386338839500760[/C][C]0.0193169419750380[/C][/ROW]
[ROW][C]67[/C][C]0.979526743273375[/C][C]0.0409465134532501[/C][C]0.0204732567266251[/C][/ROW]
[ROW][C]68[/C][C]0.970686667973219[/C][C]0.0586266640535618[/C][C]0.0293133320267809[/C][/ROW]
[ROW][C]69[/C][C]0.958854249899225[/C][C]0.0822915002015507[/C][C]0.0411457501007753[/C][/ROW]
[ROW][C]70[/C][C]0.95941727591016[/C][C]0.0811654481796798[/C][C]0.0405827240898399[/C][/ROW]
[ROW][C]71[/C][C]0.973982571655941[/C][C]0.0520348566881177[/C][C]0.0260174283440589[/C][/ROW]
[ROW][C]72[/C][C]0.998461053955578[/C][C]0.00307789208884393[/C][C]0.00153894604442197[/C][/ROW]
[ROW][C]73[/C][C]0.999701237575306[/C][C]0.000597524849388126[/C][C]0.000298762424694063[/C][/ROW]
[ROW][C]74[/C][C]0.99998205410541[/C][C]3.58917891795488e-05[/C][C]1.79458945897744e-05[/C][/ROW]
[ROW][C]75[/C][C]0.999962793566485[/C][C]7.44128670306412e-05[/C][C]3.72064335153206e-05[/C][/ROW]
[ROW][C]76[/C][C]0.999950008779108[/C][C]9.99824417840524e-05[/C][C]4.99912208920262e-05[/C][/ROW]
[ROW][C]77[/C][C]0.999826212971373[/C][C]0.000347574057254115[/C][C]0.000173787028627058[/C][/ROW]
[ROW][C]78[/C][C]0.999388701489658[/C][C]0.00122259702068477[/C][C]0.000611298510342383[/C][/ROW]
[ROW][C]79[/C][C]0.997069759401763[/C][C]0.00586048119647441[/C][C]0.00293024059823721[/C][/ROW]
[ROW][C]80[/C][C]0.994581690202565[/C][C]0.0108366195948695[/C][C]0.00541830979743475[/C][/ROW]
[/TABLE]
Source: https://freestatistics.org/blog/index.php?pk=25577&T=5

Globally Unique Identifier (entire table): ba.freestatistics.org/blog/index.php?pk=25577&T=5

As an alternative you can also use a QR Code:  

The GUIDs for individual cells are displayed in the table below:

Goldfeld-Quandt test for Heteroskedasticity
p-valuesAlternative Hypothesis
breakpoint indexgreater2-sidedless
176.2641703918555e-050.000125283407837110.999937358296081
183.70343312513454e-057.40686625026908e-050.999962965668749
192.72705157862402e-065.45410315724804e-060.999997272948421
202.02094521616298e-074.04189043232596e-070.999999797905478
212.95669508954081e-075.91339017908162e-070.999999704330491
220.0005299576497851770.001059915299570350.999470042350215
230.0002536804099338420.0005073608198676850.999746319590066
249.58513692382124e-050.0001917027384764250.999904148630762
253.49499462636003e-056.98998925272007e-050.999965050053736
265.34025932889695e-050.0001068051865779390.99994659740671
279.42438345116769e-050.0001884876690233540.999905756165488
289.49460059119289e-050.0001898920118238580.999905053994088
297.48265972426933e-050.0001496531944853870.999925173402757
305.29004494029706e-050.0001058008988059410.999947099550597
314.37694205656377e-058.75388411312754e-050.999956230579434
324.7032167318997e-059.4064334637994e-050.99995296783268
339.84162002795716e-050.0001968324005591430.99990158379972
340.0007917337355231880.001583467471046380.999208266264477
350.000637622920838290.001275245841676580.999362377079162
360.00046885286215420.00093770572430840.999531147137846
370.0003708591116395140.0007417182232790280.99962914088836
380.0003359321741586290.0006718643483172580.999664067825841
390.0002551753374965140.0005103506749930280.999744824662503
400.0001658735544715830.0003317471089431660.999834126445528
410.0001068729892031180.0002137459784062360.999893127010797
428.33535612173559e-050.0001667071224347120.999916646438783
430.0001752267893177480.0003504535786354960.999824773210682
440.0005112382311763560.001022476462352710.999488761768824
450.0009738938196778250.001947787639355650.999026106180322
460.0008800850385817750.001760170077163550.999119914961418
470.001105501342012180.002211002684024370.998894498657988
480.001386081329148800.002772162658297610.998613918670851
490.004901548240659840.009803096481319690.99509845175934
500.00943700960949110.01887401921898220.99056299039051
510.02002063230499940.04004126460999870.979979367695
520.1025540156964990.2051080313929980.897445984303501
530.2347022899171810.4694045798343620.765297710082819
540.3752591443654920.7505182887309830.624740855634508
550.6206139541800370.7587720916399260.379386045819963
560.7969290712008160.4061418575983680.203070928799184
570.9219514715167820.1560970569664350.0780485284832175
580.9425186566026660.1149626867946670.0574813433973337
590.9570657045262330.08586859094753440.0429342954737672
600.9595476124627740.08090477507445230.0404523875372262
610.961436424707130.07712715058574070.0385635752928704
620.9604296456952360.07914070860952730.0395703543047637
630.960073797162990.0798524056740210.0399262028370105
640.9785891135071440.04282177298571270.0214108864928564
650.9799202710893430.04015945782131330.0200797289106567
660.9806830580249620.03863388395007600.0193169419750380
670.9795267432733750.04094651345325010.0204732567266251
680.9706866679732190.05862666405356180.0293133320267809
690.9588542498992250.08229150020155070.0411457501007753
700.959417275910160.08116544817967980.0405827240898399
710.9739825716559410.05203485668811770.0260174283440589
720.9984610539555780.003077892088843930.00153894604442197
730.9997012375753060.0005975248493881260.000298762424694063
740.999982054105413.58917891795488e-051.79458945897744e-05
750.9999627935664857.44128670306412e-053.72064335153206e-05
760.9999500087791089.99824417840524e-054.99912208920262e-05
770.9998262129713730.0003475740572541150.000173787028627058
780.9993887014896580.001222597020684770.000611298510342383
790.9970697594017630.005860481196474410.00293024059823721
800.9945816902025650.01083661959486950.00541830979743475


Meta Analysis of Goldfeld-Quandt test for Heteroskedasticity
Description# significant tests% significant testsOK/NOK
1% type I error level410.640625NOK
5% type I error level480.75NOK
10% type I error level570.890625NOK

\begin{tabular}{lllllllll}
\hline
Meta Analysis of Goldfeld-Quandt test for Heteroskedasticity \tabularnewline
Description & # significant tests & % significant tests & OK/NOK \tabularnewline
1% type I error level & 41 & 0.640625 & NOK \tabularnewline
5% type I error level & 48 & 0.75 & NOK \tabularnewline
10% type I error level & 57 & 0.890625 & NOK \tabularnewline
\hline
\end{tabular}
%Source: https://freestatistics.org/blog/index.php?pk=25577&T=6

[TABLE]
[ROW][C]Meta Analysis of Goldfeld-Quandt test for Heteroskedasticity[/C][/ROW]
[ROW][C]Description[/C][C]# significant tests[/C][C]% significant tests[/C][C]OK/NOK[/C][/ROW]
[ROW][C]1% type I error level[/C][C]41[/C][C]0.640625[/C][C]NOK[/C][/ROW]
[ROW][C]5% type I error level[/C][C]48[/C][C]0.75[/C][C]NOK[/C][/ROW]
[ROW][C]10% type I error level[/C][C]57[/C][C]0.890625[/C][C]NOK[/C][/ROW]
[/TABLE]
Source: https://freestatistics.org/blog/index.php?pk=25577&T=6

Globally Unique Identifier (entire table): ba.freestatistics.org/blog/index.php?pk=25577&T=6

As an alternative you can also use a QR Code:  

The GUIDs for individual cells are displayed in the table below:

Meta Analysis of Goldfeld-Quandt test for Heteroskedasticity
Description# significant tests% significant testsOK/NOK
1% type I error level410.640625NOK
5% type I error level480.75NOK
10% type I error level570.890625NOK


Parameters (Session):
par1 = 1 ; par2 = Include Monthly Dummies ; par3 = Linear Trend ;
Parameters (R input):
par1 = 1 ; par2 = Include Monthly Dummies ; par3 = Linear Trend ;
R code (references can be found in the software module):
library(lattice)
library(lmtest)
n25 <- 25 #minimum number of obs. for Goldfeld-Quandt test
par1 <- as.numeric(par1)
x <- t(y)
k <- length(x[1,])
n <- length(x[,1])
x1 <- cbind(x[,par1], x[,1:k!=par1])
mycolnames <- c(colnames(x)[par1], colnames(x)[1:k!=par1])
colnames(x1) <- mycolnames #colnames(x)[par1]
x <- x1
if (par3 == 'First Differences'){
x2 <- array(0, dim=c(n-1,k), dimnames=list(1:(n-1), paste('(1-B)',colnames(x),sep='')))
for (i in 1:n-1) {
for (j in 1:k) {
x2[i,j] <- x[i+1,j] - x[i,j]
}
}
x <- x2
}
if (par2 == 'Include Monthly Dummies'){
x2 <- array(0, dim=c(n,11), dimnames=list(1:n, paste('M', seq(1:11), sep ='')))
for (i in 1:11){
x2[seq(i,n,12),i] <- 1
}
x <- cbind(x, x2)
}
if (par2 == 'Include Quarterly Dummies'){
x2 <- array(0, dim=c(n,3), dimnames=list(1:n, paste('Q', seq(1:3), sep ='')))
for (i in 1:3){
x2[seq(i,n,4),i] <- 1
}
x <- cbind(x, x2)
}
k <- length(x[1,])
if (par3 == 'Linear Trend'){
x <- cbind(x, c(1:n))
colnames(x)[k+1] <- 't'
}
x
k <- length(x[1,])
df <- as.data.frame(x)
(mylm <- lm(df))
(mysum <- summary(mylm))
if (n > n25) {
kp3 <- k + 3
nmkm3 <- n - k - 3
gqarr <- array(NA, dim=c(nmkm3-kp3+1,3))
numgqtests <- 0
numsignificant1 <- 0
numsignificant5 <- 0
numsignificant10 <- 0
for (mypoint in kp3:nmkm3) {
j <- 0
numgqtests <- numgqtests + 1
for (myalt in c('greater', 'two.sided', 'less')) {
j <- j + 1
gqarr[mypoint-kp3+1,j] <- gqtest(mylm, point=mypoint, alternative=myalt)$p.value
}
if (gqarr[mypoint-kp3+1,2] < 0.01) numsignificant1 <- numsignificant1 + 1
if (gqarr[mypoint-kp3+1,2] < 0.05) numsignificant5 <- numsignificant5 + 1
if (gqarr[mypoint-kp3+1,2] < 0.10) numsignificant10 <- numsignificant10 + 1
}
gqarr
}
bitmap(file='test0.png')
plot(x[,1], type='l', main='Actuals and Interpolation', ylab='value of Actuals and Interpolation (dots)', xlab='time or index')
points(x[,1]-mysum$resid)
grid()
dev.off()
bitmap(file='test1.png')
plot(mysum$resid, type='b', pch=19, main='Residuals', ylab='value of Residuals', xlab='time or index')
grid()
dev.off()
bitmap(file='test2.png')
hist(mysum$resid, main='Residual Histogram', xlab='values of Residuals')
grid()
dev.off()
bitmap(file='test3.png')
densityplot(~mysum$resid,col='black',main='Residual Density Plot', xlab='values of Residuals')
dev.off()
bitmap(file='test4.png')
qqnorm(mysum$resid, main='Residual Normal Q-Q Plot')
qqline(mysum$resid)
grid()
dev.off()
(myerror <- as.ts(mysum$resid))
bitmap(file='test5.png')
dum <- cbind(lag(myerror,k=1),myerror)
dum
dum1 <- dum[2:length(myerror),]
dum1
z <- as.data.frame(dum1)
z
plot(z,main=paste('Residual Lag plot, lowess, and regression line'), ylab='values of Residuals', xlab='lagged values of Residuals')
lines(lowess(z))
abline(lm(z))
grid()
dev.off()
bitmap(file='test6.png')
acf(mysum$resid, lag.max=length(mysum$resid)/2, main='Residual Autocorrelation Function')
grid()
dev.off()
bitmap(file='test7.png')
pacf(mysum$resid, lag.max=length(mysum$resid)/2, main='Residual Partial Autocorrelation Function')
grid()
dev.off()
bitmap(file='test8.png')
opar <- par(mfrow = c(2,2), oma = c(0, 0, 1.1, 0))
plot(mylm, las = 1, sub='Residual Diagnostics')
par(opar)
dev.off()
if (n > n25) {
bitmap(file='test9.png')
plot(kp3:nmkm3,gqarr[,2], main='Goldfeld-Quandt test',ylab='2-sided p-value',xlab='breakpoint')
grid()
dev.off()
}
load(file='createtable')
a<-table.start()
a<-table.row.start(a)
a<-table.element(a, 'Multiple Linear Regression - Estimated Regression Equation', 1, TRUE)
a<-table.row.end(a)
myeq <- colnames(x)[1]
myeq <- paste(myeq, '[t] = ', sep='')
for (i in 1:k){
if (mysum$coefficients[i,1] > 0) myeq <- paste(myeq, '+', '')
myeq <- paste(myeq, mysum$coefficients[i,1], sep=' ')
if (rownames(mysum$coefficients)[i] != '(Intercept)') {
myeq <- paste(myeq, rownames(mysum$coefficients)[i], sep='')
if (rownames(mysum$coefficients)[i] != 't') myeq <- paste(myeq, '[t]', sep='')
}
}
myeq <- paste(myeq, ' + e[t]')
a<-table.row.start(a)
a<-table.element(a, myeq)
a<-table.row.end(a)
a<-table.end(a)
table.save(a,file='mytable1.tab')
a<-table.start()
a<-table.row.start(a)
a<-table.element(a,hyperlink('ols1.htm','Multiple Linear Regression - Ordinary Least Squares',''), 6, TRUE)
a<-table.row.end(a)
a<-table.row.start(a)
a<-table.element(a,'Variable',header=TRUE)
a<-table.element(a,'Parameter',header=TRUE)
a<-table.element(a,'S.D.',header=TRUE)
a<-table.element(a,'T-STAT
H0: parameter = 0',header=TRUE)
a<-table.element(a,'2-tail p-value',header=TRUE)
a<-table.element(a,'1-tail p-value',header=TRUE)
a<-table.row.end(a)
for (i in 1:k){
a<-table.row.start(a)
a<-table.element(a,rownames(mysum$coefficients)[i],header=TRUE)
a<-table.element(a,mysum$coefficients[i,1])
a<-table.element(a, round(mysum$coefficients[i,2],6))
a<-table.element(a, round(mysum$coefficients[i,3],4))
a<-table.element(a, round(mysum$coefficients[i,4],6))
a<-table.element(a, round(mysum$coefficients[i,4]/2,6))
a<-table.row.end(a)
}
a<-table.end(a)
table.save(a,file='mytable2.tab')
a<-table.start()
a<-table.row.start(a)
a<-table.element(a, 'Multiple Linear Regression - Regression Statistics', 2, TRUE)
a<-table.row.end(a)
a<-table.row.start(a)
a<-table.element(a, 'Multiple R',1,TRUE)
a<-table.element(a, sqrt(mysum$r.squared))
a<-table.row.end(a)
a<-table.row.start(a)
a<-table.element(a, 'R-squared',1,TRUE)
a<-table.element(a, mysum$r.squared)
a<-table.row.end(a)
a<-table.row.start(a)
a<-table.element(a, 'Adjusted R-squared',1,TRUE)
a<-table.element(a, mysum$adj.r.squared)
a<-table.row.end(a)
a<-table.row.start(a)
a<-table.element(a, 'F-TEST (value)',1,TRUE)
a<-table.element(a, mysum$fstatistic[1])
a<-table.row.end(a)
a<-table.row.start(a)
a<-table.element(a, 'F-TEST (DF numerator)',1,TRUE)
a<-table.element(a, mysum$fstatistic[2])
a<-table.row.end(a)
a<-table.row.start(a)
a<-table.element(a, 'F-TEST (DF denominator)',1,TRUE)
a<-table.element(a, mysum$fstatistic[3])
a<-table.row.end(a)
a<-table.row.start(a)
a<-table.element(a, 'p-value',1,TRUE)
a<-table.element(a, 1-pf(mysum$fstatistic[1],mysum$fstatistic[2],mysum$fstatistic[3]))
a<-table.row.end(a)
a<-table.row.start(a)
a<-table.element(a, 'Multiple Linear Regression - Residual Statistics', 2, TRUE)
a<-table.row.end(a)
a<-table.row.start(a)
a<-table.element(a, 'Residual Standard Deviation',1,TRUE)
a<-table.element(a, mysum$sigma)
a<-table.row.end(a)
a<-table.row.start(a)
a<-table.element(a, 'Sum Squared Residuals',1,TRUE)
a<-table.element(a, sum(myerror*myerror))
a<-table.row.end(a)
a<-table.end(a)
table.save(a,file='mytable3.tab')
a<-table.start()
a<-table.row.start(a)
a<-table.element(a, 'Multiple Linear Regression - Actuals, Interpolation, and Residuals', 4, TRUE)
a<-table.row.end(a)
a<-table.row.start(a)
a<-table.element(a, 'Time or Index', 1, TRUE)
a<-table.element(a, 'Actuals', 1, TRUE)
a<-table.element(a, 'Interpolation
Forecast', 1, TRUE)
a<-table.element(a, 'Residuals
Prediction Error', 1, TRUE)
a<-table.row.end(a)
for (i in 1:n) {
a<-table.row.start(a)
a<-table.element(a,i, 1, TRUE)
a<-table.element(a,x[i])
a<-table.element(a,x[i]-mysum$resid[i])
a<-table.element(a,mysum$resid[i])
a<-table.row.end(a)
}
a<-table.end(a)
table.save(a,file='mytable4.tab')
if (n > n25) {
a<-table.start()
a<-table.row.start(a)
a<-table.element(a,'Goldfeld-Quandt test for Heteroskedasticity',4,TRUE)
a<-table.row.end(a)
a<-table.row.start(a)
a<-table.element(a,'p-values',header=TRUE)
a<-table.element(a,'Alternative Hypothesis',3,header=TRUE)
a<-table.row.end(a)
a<-table.row.start(a)
a<-table.element(a,'breakpoint index',header=TRUE)
a<-table.element(a,'greater',header=TRUE)
a<-table.element(a,'2-sided',header=TRUE)
a<-table.element(a,'less',header=TRUE)
a<-table.row.end(a)
for (mypoint in kp3:nmkm3) {
a<-table.row.start(a)
a<-table.element(a,mypoint,header=TRUE)
a<-table.element(a,gqarr[mypoint-kp3+1,1])
a<-table.element(a,gqarr[mypoint-kp3+1,2])
a<-table.element(a,gqarr[mypoint-kp3+1,3])
a<-table.row.end(a)
}
a<-table.end(a)
table.save(a,file='mytable5.tab')
a<-table.start()
a<-table.row.start(a)
a<-table.element(a,'Meta Analysis of Goldfeld-Quandt test for Heteroskedasticity',4,TRUE)
a<-table.row.end(a)
a<-table.row.start(a)
a<-table.element(a,'Description',header=TRUE)
a<-table.element(a,'# significant tests',header=TRUE)
a<-table.element(a,'% significant tests',header=TRUE)
a<-table.element(a,'OK/NOK',header=TRUE)
a<-table.row.end(a)
a<-table.row.start(a)
a<-table.element(a,'1% type I error level',header=TRUE)
a<-table.element(a,numsignificant1)
a<-table.element(a,numsignificant1/numgqtests)
if (numsignificant1/numgqtests < 0.01) dum <- 'OK' else dum <- 'NOK'
a<-table.element(a,dum)
a<-table.row.end(a)
a<-table.row.start(a)
a<-table.element(a,'5% type I error level',header=TRUE)
a<-table.element(a,numsignificant5)
a<-table.element(a,numsignificant5/numgqtests)
if (numsignificant5/numgqtests < 0.05) dum <- 'OK' else dum <- 'NOK'
a<-table.element(a,dum)
a<-table.row.end(a)
a<-table.row.start(a)
a<-table.element(a,'10% type I error level',header=TRUE)
a<-table.element(a,numsignificant10)
a<-table.element(a,numsignificant10/numgqtests)
if (numsignificant10/numgqtests < 0.1) dum <- 'OK' else dum <- 'NOK'
a<-table.element(a,dum)
a<-table.row.end(a)
a<-table.end(a)
table.save(a,file='mytable6.tab')
}