Free Statistics

of Irreproducible Research!

Author's title

Author*The author of this computation has been verified*
R Software Modulerwasp_multipleregression.wasp
Title produced by softwareMultiple Regression
Date of computationTue, 25 Nov 2008 00:21:29 -0700
Cite this page as followsStatistical Computations at FreeStatistics.org, Office for Research Development and Education, URL https://freestatistics.org/blog/index.php?v=date/2008/Nov/25/t1227597734cc5v2s6od7y9sqv.htm/, Retrieved Thu, 09 May 2024 13:06:14 +0000
Statistical Computations at FreeStatistics.org, Office for Research Development and Education, URL https://freestatistics.org/blog/index.php?pk=25568, Retrieved Thu, 09 May 2024 13:06:14 +0000
QR Codes:

Original text written by user:
IsPrivate?No (this computation is public)
User-defined keywordsmultiple linear regression
Estimated Impact215
Family? (F = Feedback message, R = changed R code, M = changed R Module, P = changed Parameters, D = changed Data)
F       [Multiple Regression] [Tijdreeksen uitvoer] [2008-11-25 07:21:29] [8da7502cfecb272886bc60b3f290b8b8] [Current]
Feedback Forum
2008-11-30 10:16:09 [An De Koninck] [reply
Ook hier, met mijn eigen tijdsreeksen, heb ik verkeerde gegevens ingevoerd waardoor ik een verkeerde output heb.Ook heb ik geen conclusies getrokken dus kan ik mijn antwoorden niet beoordelen.

Post a new message
Dataseries X:
11178,4	1190,8	-1,3
9516,4	728,8	-1,4
12102,8	995,6	-1,3
12989,0	1260,3	-1
11610,2	994	-0,8
10205,5	957,3	-0,7
11356,2	975,6	-0,6
11307,1	884,9	-0,8
12648,6	908,4	-0,9
11947,2	1022,8	-1
11714,1	958,6	-1,2
12192,5	825,1	-1,3
11268,8	1116,6	-1,3
9097,4	724,2	-1,4
12639,8	1004,5	-1,4
13040,1	1058,9	-1,8
11687,3	854,7	-1,9
11191,7	943,4	-2
11391,9	792,4	-2,4
11793,1	873,2	-2,5
13933,2	1101,4	-2,5
12778,1	987,1	-2,3
11810,3	1038,8	-1,7
13698,4	1060,7	-1,1
11956,6	1047,7	-0,7
10723,8	840	-0,2
13938,9	1044	0,3
13979,8	1097,4	1,1
13807,4	987,5	1,6
12973,9	934	2,2
12509,8	977	3
12934,1	881,1	3,8
14908,3	1083,3	4,6
13772,1	1074,7	5,1
13012,6	1182,2	5,3
14049,9	1117,5	5,5
11816,5	1117,4	5,7
11593,2	936,2	5,9
14466,2	1246,3	6,1
13615,9	1175,1	6,1
14733,9	1177,7	6,3
13880,7	1035,8	6,5
13527,5	1091,6	6,7
13584,0	998,7	6,6
16170,2	1247,9	6,5
13260,6	1034,7	6,4
14741,9	1287,7	6,3
15486,5	994,0	6,3
13154,5	1122,8	6,3
12621,2	1017,3	6,2
15031,6	1106,0	6
15452,4	1191,8	5,6
15428	1030,1	5,3
13105,9	989,4	5,1
14716,8	979,6	4,5
14180,0	1088,0	4
16202,2	1389,2	3,5
14392,4	1043,9	3,5
15140,6	1182,1	3,3
15960,1	1109,6	3,1
14351,3	1463,3	2,9
13230,2	1276,2	2,5
15202,1	1082,4	2,6
17157,3	1360,4	2,8
16159,1	1130,2	2,8
13405,7	1019,6	2,9
17224,7	1077,0	3,1
17338,4	958,8	3,3
17370,6	959,6	3,5
18817,8	907,2	3,4
16593,2	880,8	3,5
17979,5	759,6	3,7
17015,2	1137,2	3,8


Summary of computational transaction
Raw Inputview raw input (R code)
Raw Outputview raw output of R engine
Computing time4 seconds
R Server'Gwilym Jenkins' @ 72.249.127.135

\begin{tabular}{lllllllll}
\hline
Summary of computational transaction \tabularnewline
Raw Input & view raw input (R code)  \tabularnewline
Raw Output & view raw output of R engine  \tabularnewline
Computing time & 4 seconds \tabularnewline
R Server & 'Gwilym Jenkins' @ 72.249.127.135 \tabularnewline
\hline
\end{tabular}
%Source: https://freestatistics.org/blog/index.php?pk=25568&T=0

[TABLE]
[ROW][C]Summary of computational transaction[/C][/ROW]
[ROW][C]Raw Input[/C][C]view raw input (R code) [/C][/ROW]
[ROW][C]Raw Output[/C][C]view raw output of R engine [/C][/ROW]
[ROW][C]Computing time[/C][C]4 seconds[/C][/ROW]
[ROW][C]R Server[/C][C]'Gwilym Jenkins' @ 72.249.127.135[/C][/ROW]
[/TABLE]
Source: https://freestatistics.org/blog/index.php?pk=25568&T=0

Globally Unique Identifier (entire table): ba.freestatistics.org/blog/index.php?pk=25568&T=0

As an alternative you can also use a QR Code:  

The GUIDs for individual cells are displayed in the table below:

Summary of computational transaction
Raw Inputview raw input (R code)
Raw Outputview raw output of R engine
Computing time4 seconds
R Server'Gwilym Jenkins' @ 72.249.127.135


Multiple Linear Regression - Estimated Regression Equation
EU[t] = + 11681.0078496593 -0.121106302339442VS[t] -41.7372997987009Price[t] -1518.85729897612M1[t] -2982.91706376903M2[t] -274.229848568124M3[t] + 136.175800976025M4[t] -430.032646657245M5[t] -1956.87539195070M6[t] -1042.60909329050M7[t] -1059.83567468688M8[t] + 563.25808866321M9[t] -572.625391015120M10[t] -968.492550445997M11[t] + 82.0137590534028t + e[t]

\begin{tabular}{lllllllll}
\hline
Multiple Linear Regression - Estimated Regression Equation \tabularnewline
EU[t] =  +  11681.0078496593 -0.121106302339442VS[t] -41.7372997987009Price[t] -1518.85729897612M1[t] -2982.91706376903M2[t] -274.229848568124M3[t] +  136.175800976025M4[t] -430.032646657245M5[t] -1956.87539195070M6[t] -1042.60909329050M7[t] -1059.83567468688M8[t] +  563.25808866321M9[t] -572.625391015120M10[t] -968.492550445997M11[t] +  82.0137590534028t  + e[t] \tabularnewline
\hline
\end{tabular}
%Source: https://freestatistics.org/blog/index.php?pk=25568&T=1

[TABLE]
[ROW][C]Multiple Linear Regression - Estimated Regression Equation[/C][/ROW]
[ROW][C]EU[t] =  +  11681.0078496593 -0.121106302339442VS[t] -41.7372997987009Price[t] -1518.85729897612M1[t] -2982.91706376903M2[t] -274.229848568124M3[t] +  136.175800976025M4[t] -430.032646657245M5[t] -1956.87539195070M6[t] -1042.60909329050M7[t] -1059.83567468688M8[t] +  563.25808866321M9[t] -572.625391015120M10[t] -968.492550445997M11[t] +  82.0137590534028t  + e[t][/C][/ROW]
[/TABLE]
Source: https://freestatistics.org/blog/index.php?pk=25568&T=1

Globally Unique Identifier (entire table): ba.freestatistics.org/blog/index.php?pk=25568&T=1

As an alternative you can also use a QR Code:  

The GUIDs for individual cells are displayed in the table below:

Multiple Linear Regression - Estimated Regression Equation
EU[t] = + 11681.0078496593 -0.121106302339442VS[t] -41.7372997987009Price[t] -1518.85729897612M1[t] -2982.91706376903M2[t] -274.229848568124M3[t] + 136.175800976025M4[t] -430.032646657245M5[t] -1956.87539195070M6[t] -1042.60909329050M7[t] -1059.83567468688M8[t] + 563.25808866321M9[t] -572.625391015120M10[t] -968.492550445997M11[t] + 82.0137590534028t + e[t]


Multiple Linear Regression - Ordinary Least Squares
VariableParameterS.D.T-STATH0: parameter = 02-tail p-value1-tail p-value
(Intercept)11681.0078496593842.52478513.864300
VS-0.1211063023394420.842108-0.14380.8861460.443073
Price-41.737299798700941.216606-1.01260.3154410.157721
M1-1518.85729897612447.764477-3.39210.0012550.000627
M2-2982.91706376903431.888596-6.906700
M3-274.229848568124441.655291-0.62090.5370890.268544
M4136.175800976025470.5483550.28940.7733090.386654
M5-430.032646657245432.929775-0.99330.3246860.162343
M6-1956.87539195070429.479744-4.55642.7e-051.4e-05
M7-1042.60909329050429.233787-2.4290.018260.00913
M8-1059.83567468688429.306606-2.46870.0165280.008264
M9563.25808866321445.3278531.26480.2109960.105498
M10-572.625391015120429.810963-1.33230.1879820.093991
M11-968.492550445997438.997474-2.20610.0313490.015674
t82.01375905340285.80424914.1300

\begin{tabular}{lllllllll}
\hline
Multiple Linear Regression - Ordinary Least Squares \tabularnewline
Variable & Parameter & S.D. & T-STATH0: parameter = 0 & 2-tail p-value & 1-tail p-value \tabularnewline
(Intercept) & 11681.0078496593 & 842.524785 & 13.8643 & 0 & 0 \tabularnewline
VS & -0.121106302339442 & 0.842108 & -0.1438 & 0.886146 & 0.443073 \tabularnewline
Price & -41.7372997987009 & 41.216606 & -1.0126 & 0.315441 & 0.157721 \tabularnewline
M1 & -1518.85729897612 & 447.764477 & -3.3921 & 0.001255 & 0.000627 \tabularnewline
M2 & -2982.91706376903 & 431.888596 & -6.9067 & 0 & 0 \tabularnewline
M3 & -274.229848568124 & 441.655291 & -0.6209 & 0.537089 & 0.268544 \tabularnewline
M4 & 136.175800976025 & 470.548355 & 0.2894 & 0.773309 & 0.386654 \tabularnewline
M5 & -430.032646657245 & 432.929775 & -0.9933 & 0.324686 & 0.162343 \tabularnewline
M6 & -1956.87539195070 & 429.479744 & -4.5564 & 2.7e-05 & 1.4e-05 \tabularnewline
M7 & -1042.60909329050 & 429.233787 & -2.429 & 0.01826 & 0.00913 \tabularnewline
M8 & -1059.83567468688 & 429.306606 & -2.4687 & 0.016528 & 0.008264 \tabularnewline
M9 & 563.25808866321 & 445.327853 & 1.2648 & 0.210996 & 0.105498 \tabularnewline
M10 & -572.625391015120 & 429.810963 & -1.3323 & 0.187982 & 0.093991 \tabularnewline
M11 & -968.492550445997 & 438.997474 & -2.2061 & 0.031349 & 0.015674 \tabularnewline
t & 82.0137590534028 & 5.804249 & 14.13 & 0 & 0 \tabularnewline
\hline
\end{tabular}
%Source: https://freestatistics.org/blog/index.php?pk=25568&T=2

[TABLE]
[ROW][C]Multiple Linear Regression - Ordinary Least Squares[/C][/ROW]
[ROW][C]Variable[/C][C]Parameter[/C][C]S.D.[/C][C]T-STATH0: parameter = 0[/C][C]2-tail p-value[/C][C]1-tail p-value[/C][/ROW]
[ROW][C](Intercept)[/C][C]11681.0078496593[/C][C]842.524785[/C][C]13.8643[/C][C]0[/C][C]0[/C][/ROW]
[ROW][C]VS[/C][C]-0.121106302339442[/C][C]0.842108[/C][C]-0.1438[/C][C]0.886146[/C][C]0.443073[/C][/ROW]
[ROW][C]Price[/C][C]-41.7372997987009[/C][C]41.216606[/C][C]-1.0126[/C][C]0.315441[/C][C]0.157721[/C][/ROW]
[ROW][C]M1[/C][C]-1518.85729897612[/C][C]447.764477[/C][C]-3.3921[/C][C]0.001255[/C][C]0.000627[/C][/ROW]
[ROW][C]M2[/C][C]-2982.91706376903[/C][C]431.888596[/C][C]-6.9067[/C][C]0[/C][C]0[/C][/ROW]
[ROW][C]M3[/C][C]-274.229848568124[/C][C]441.655291[/C][C]-0.6209[/C][C]0.537089[/C][C]0.268544[/C][/ROW]
[ROW][C]M4[/C][C]136.175800976025[/C][C]470.548355[/C][C]0.2894[/C][C]0.773309[/C][C]0.386654[/C][/ROW]
[ROW][C]M5[/C][C]-430.032646657245[/C][C]432.929775[/C][C]-0.9933[/C][C]0.324686[/C][C]0.162343[/C][/ROW]
[ROW][C]M6[/C][C]-1956.87539195070[/C][C]429.479744[/C][C]-4.5564[/C][C]2.7e-05[/C][C]1.4e-05[/C][/ROW]
[ROW][C]M7[/C][C]-1042.60909329050[/C][C]429.233787[/C][C]-2.429[/C][C]0.01826[/C][C]0.00913[/C][/ROW]
[ROW][C]M8[/C][C]-1059.83567468688[/C][C]429.306606[/C][C]-2.4687[/C][C]0.016528[/C][C]0.008264[/C][/ROW]
[ROW][C]M9[/C][C]563.25808866321[/C][C]445.327853[/C][C]1.2648[/C][C]0.210996[/C][C]0.105498[/C][/ROW]
[ROW][C]M10[/C][C]-572.625391015120[/C][C]429.810963[/C][C]-1.3323[/C][C]0.187982[/C][C]0.093991[/C][/ROW]
[ROW][C]M11[/C][C]-968.492550445997[/C][C]438.997474[/C][C]-2.2061[/C][C]0.031349[/C][C]0.015674[/C][/ROW]
[ROW][C]t[/C][C]82.0137590534028[/C][C]5.804249[/C][C]14.13[/C][C]0[/C][C]0[/C][/ROW]
[/TABLE]
Source: https://freestatistics.org/blog/index.php?pk=25568&T=2

Globally Unique Identifier (entire table): ba.freestatistics.org/blog/index.php?pk=25568&T=2

As an alternative you can also use a QR Code:  

The GUIDs for individual cells are displayed in the table below:

Multiple Linear Regression - Ordinary Least Squares
VariableParameterS.D.T-STATH0: parameter = 02-tail p-value1-tail p-value
(Intercept)11681.0078496593842.52478513.864300
VS-0.1211063023394420.842108-0.14380.8861460.443073
Price-41.737299798700941.216606-1.01260.3154410.157721
M1-1518.85729897612447.764477-3.39210.0012550.000627
M2-2982.91706376903431.888596-6.906700
M3-274.229848568124441.655291-0.62090.5370890.268544
M4136.175800976025470.5483550.28940.7733090.386654
M5-430.032646657245432.929775-0.99330.3246860.162343
M6-1956.87539195070429.479744-4.55642.7e-051.4e-05
M7-1042.60909329050429.233787-2.4290.018260.00913
M8-1059.83567468688429.306606-2.46870.0165280.008264
M9563.25808866321445.3278531.26480.2109960.105498
M10-572.625391015120429.810963-1.33230.1879820.093991
M11-968.492550445997438.997474-2.20610.0313490.015674
t82.01375905340285.80424914.1300


Multiple Linear Regression - Regression Statistics
Multiple R0.945812309989402
R-squared0.894560925727488
Adjusted R-squared0.869110114696192
F-TEST (value)35.1486215754571
F-TEST (DF numerator)14
F-TEST (DF denominator)58
p-value0
Multiple Linear Regression - Residual Statistics
Residual Standard Deviation742.230790716727
Sum Squared Residuals31952579.7079027

\begin{tabular}{lllllllll}
\hline
Multiple Linear Regression - Regression Statistics \tabularnewline
Multiple R & 0.945812309989402 \tabularnewline
R-squared & 0.894560925727488 \tabularnewline
Adjusted R-squared & 0.869110114696192 \tabularnewline
F-TEST (value) & 35.1486215754571 \tabularnewline
F-TEST (DF numerator) & 14 \tabularnewline
F-TEST (DF denominator) & 58 \tabularnewline
p-value & 0 \tabularnewline
Multiple Linear Regression - Residual Statistics \tabularnewline
Residual Standard Deviation & 742.230790716727 \tabularnewline
Sum Squared Residuals & 31952579.7079027 \tabularnewline
\hline
\end{tabular}
%Source: https://freestatistics.org/blog/index.php?pk=25568&T=3

[TABLE]
[ROW][C]Multiple Linear Regression - Regression Statistics[/C][/ROW]
[ROW][C]Multiple R[/C][C]0.945812309989402[/C][/ROW]
[ROW][C]R-squared[/C][C]0.894560925727488[/C][/ROW]
[ROW][C]Adjusted R-squared[/C][C]0.869110114696192[/C][/ROW]
[ROW][C]F-TEST (value)[/C][C]35.1486215754571[/C][/ROW]
[ROW][C]F-TEST (DF numerator)[/C][C]14[/C][/ROW]
[ROW][C]F-TEST (DF denominator)[/C][C]58[/C][/ROW]
[ROW][C]p-value[/C][C]0[/C][/ROW]
[ROW][C]Multiple Linear Regression - Residual Statistics[/C][/ROW]
[ROW][C]Residual Standard Deviation[/C][C]742.230790716727[/C][/ROW]
[ROW][C]Sum Squared Residuals[/C][C]31952579.7079027[/C][/ROW]
[/TABLE]
Source: https://freestatistics.org/blog/index.php?pk=25568&T=3

Globally Unique Identifier (entire table): ba.freestatistics.org/blog/index.php?pk=25568&T=3

As an alternative you can also use a QR Code:  

The GUIDs for individual cells are displayed in the table below:

Multiple Linear Regression - Regression Statistics
Multiple R0.945812309989402
R-squared0.894560925727488
Adjusted R-squared0.869110114696192
F-TEST (value)35.1486215754571
F-TEST (DF numerator)14
F-TEST (DF denominator)58
p-value0
Multiple Linear Regression - Residual Statistics
Residual Standard Deviation742.230790716727
Sum Squared Residuals31952579.7079027


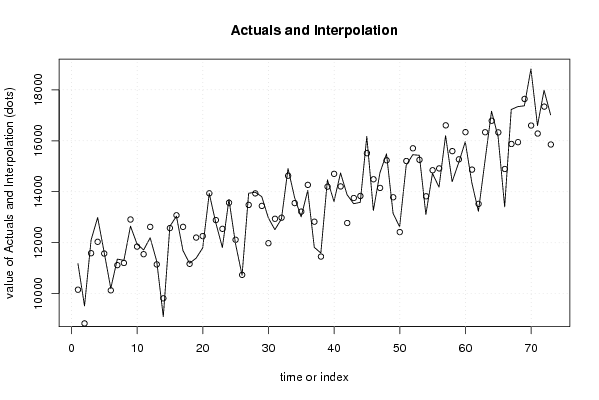
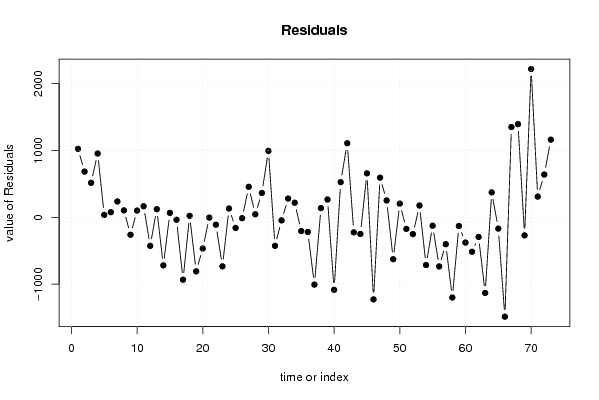
Multiple Linear Regression - Actuals, Interpolation, and Residuals
Time or IndexActualsInterpolationForecastResidualsPrediction Error
111178.410154.20941464911024.19058535093
29516.48832.28825057027684.111749429731
312102.811586.5043333805516.295666619454
41298912034.3457138092954.654286190765
511610.211574.054173582636.1458264173805
610205.510129.496058658676.0039413414454
711356.211119.3861410595236.81385894052
811307.111203.5051202984103.594879701576
912648.612909.9403745768-261.340374576814
1011947.211846.3898229441100.810177055877
1111714.111548.6589071366165.441092863419
1212192.512619.5066379782-427.006637978169
1311268.811147.3606109235121.439389076490
149097.49817.01044820187-719.610448201868
1512639.812573.765325910466.034674089567
1613040.113076.2914715802-36.1914715801941
1711687.312621.0004199179-933.700419917911
1811191.711169.603034640222.0969653597856
1911391.912200.8650639266-808.965063926562
2011793.112260.0405823344-466.940582334421
2113933.213937.5116465441-4.31164654405717
2212778.112889.1369163168-111.036916316787
2311810.312543.9799402291-733.679940229145
2413698.413566.7916418281131.608358171910
2511956.612114.8275639163-158.227563916310
2610723.810737.0666872734-13.2666872733547
2713938.913482.1933259511456.706674048939
2813979.813934.755818164745.0441818352726
2913807.413443.0020623126364.397937687386
3012973.911979.6098833685994.290116631504
3112509.812937.2925302426-427.49253024255
3212934.112980.3039624550-46.2039624549565
3314908.314627.5339506865280.766049313541
3413772.113553.8370943623218.262905637702
3513012.613218.6173065236-206.017306523594
3614049.914268.6117338246-218.711733824616
3711816.512823.4328445724-1006.93284457240
3811593.211454.9838408571138.216159142944
3914466.214199.7822907962266.417709203841
4013615.914700.8244681203-1084.92446812028
4114733.914207.9674431946525.932556805409
4213880.712771.97598129681108.72401870324
4313527.513753.1508473801-225.650847380089
441358413833.3625305043-249.36253050431
4516170.215512.4640923447657.735907655313
4613260.614488.5879653584-1227.98796535840
4714741.914148.2684004689593.631599531083
4815486.515234.3436309654252.15636903459
4913154.513781.9015993014-627.401599301378
5012621.212416.8060384386204.393961561448
5115031.615205.1123436351-173.512343635087
5215452.415703.8357514114-251.435751411397
531542815251.7451418594176.254858140573
5413105.913820.1926420843-714.292642084326
5514716.814842.7019214401-125.901921440083
561418014915.2298258229-735.229825822855
5716202.216604.7287798611-402.528779861063
5814392.415592.6770654339-1200.27706543394
5915140.615270.4342340329-129.834234032898
6015960.116338.0682104116-377.968210411649
6114351.314866.7368313112-515.436831311219
6213230.213524.0447346589-293.8447346589
6315202.116334.0423803267-1131.94238032671
6417157.316784.4467769142372.853223085834
6516159.116328.1307591328-169.030759132836
6613405.714892.5223999516-1486.82239995165
6717224.715873.50349595121351.19650404876
6817338.415944.25797858501394.14202141497
6917370.617640.9211559869-270.321155986921
7018817.816597.57113558452220.22886441555
7116593.216282.7412116089310.458788391136
7217979.517339.5781449921639.921855007934
7317015.215852.83113532611162.36886467389

\begin{tabular}{lllllllll}
\hline
Multiple Linear Regression - Actuals, Interpolation, and Residuals \tabularnewline
Time or Index & Actuals & InterpolationForecast & ResidualsPrediction Error \tabularnewline
1 & 11178.4 & 10154.2094146491 & 1024.19058535093 \tabularnewline
2 & 9516.4 & 8832.28825057027 & 684.111749429731 \tabularnewline
3 & 12102.8 & 11586.5043333805 & 516.295666619454 \tabularnewline
4 & 12989 & 12034.3457138092 & 954.654286190765 \tabularnewline
5 & 11610.2 & 11574.0541735826 & 36.1458264173805 \tabularnewline
6 & 10205.5 & 10129.4960586586 & 76.0039413414454 \tabularnewline
7 & 11356.2 & 11119.3861410595 & 236.81385894052 \tabularnewline
8 & 11307.1 & 11203.5051202984 & 103.594879701576 \tabularnewline
9 & 12648.6 & 12909.9403745768 & -261.340374576814 \tabularnewline
10 & 11947.2 & 11846.3898229441 & 100.810177055877 \tabularnewline
11 & 11714.1 & 11548.6589071366 & 165.441092863419 \tabularnewline
12 & 12192.5 & 12619.5066379782 & -427.006637978169 \tabularnewline
13 & 11268.8 & 11147.3606109235 & 121.439389076490 \tabularnewline
14 & 9097.4 & 9817.01044820187 & -719.610448201868 \tabularnewline
15 & 12639.8 & 12573.7653259104 & 66.034674089567 \tabularnewline
16 & 13040.1 & 13076.2914715802 & -36.1914715801941 \tabularnewline
17 & 11687.3 & 12621.0004199179 & -933.700419917911 \tabularnewline
18 & 11191.7 & 11169.6030346402 & 22.0969653597856 \tabularnewline
19 & 11391.9 & 12200.8650639266 & -808.965063926562 \tabularnewline
20 & 11793.1 & 12260.0405823344 & -466.940582334421 \tabularnewline
21 & 13933.2 & 13937.5116465441 & -4.31164654405717 \tabularnewline
22 & 12778.1 & 12889.1369163168 & -111.036916316787 \tabularnewline
23 & 11810.3 & 12543.9799402291 & -733.679940229145 \tabularnewline
24 & 13698.4 & 13566.7916418281 & 131.608358171910 \tabularnewline
25 & 11956.6 & 12114.8275639163 & -158.227563916310 \tabularnewline
26 & 10723.8 & 10737.0666872734 & -13.2666872733547 \tabularnewline
27 & 13938.9 & 13482.1933259511 & 456.706674048939 \tabularnewline
28 & 13979.8 & 13934.7558181647 & 45.0441818352726 \tabularnewline
29 & 13807.4 & 13443.0020623126 & 364.397937687386 \tabularnewline
30 & 12973.9 & 11979.6098833685 & 994.290116631504 \tabularnewline
31 & 12509.8 & 12937.2925302426 & -427.49253024255 \tabularnewline
32 & 12934.1 & 12980.3039624550 & -46.2039624549565 \tabularnewline
33 & 14908.3 & 14627.5339506865 & 280.766049313541 \tabularnewline
34 & 13772.1 & 13553.8370943623 & 218.262905637702 \tabularnewline
35 & 13012.6 & 13218.6173065236 & -206.017306523594 \tabularnewline
36 & 14049.9 & 14268.6117338246 & -218.711733824616 \tabularnewline
37 & 11816.5 & 12823.4328445724 & -1006.93284457240 \tabularnewline
38 & 11593.2 & 11454.9838408571 & 138.216159142944 \tabularnewline
39 & 14466.2 & 14199.7822907962 & 266.417709203841 \tabularnewline
40 & 13615.9 & 14700.8244681203 & -1084.92446812028 \tabularnewline
41 & 14733.9 & 14207.9674431946 & 525.932556805409 \tabularnewline
42 & 13880.7 & 12771.9759812968 & 1108.72401870324 \tabularnewline
43 & 13527.5 & 13753.1508473801 & -225.650847380089 \tabularnewline
44 & 13584 & 13833.3625305043 & -249.36253050431 \tabularnewline
45 & 16170.2 & 15512.4640923447 & 657.735907655313 \tabularnewline
46 & 13260.6 & 14488.5879653584 & -1227.98796535840 \tabularnewline
47 & 14741.9 & 14148.2684004689 & 593.631599531083 \tabularnewline
48 & 15486.5 & 15234.3436309654 & 252.15636903459 \tabularnewline
49 & 13154.5 & 13781.9015993014 & -627.401599301378 \tabularnewline
50 & 12621.2 & 12416.8060384386 & 204.393961561448 \tabularnewline
51 & 15031.6 & 15205.1123436351 & -173.512343635087 \tabularnewline
52 & 15452.4 & 15703.8357514114 & -251.435751411397 \tabularnewline
53 & 15428 & 15251.7451418594 & 176.254858140573 \tabularnewline
54 & 13105.9 & 13820.1926420843 & -714.292642084326 \tabularnewline
55 & 14716.8 & 14842.7019214401 & -125.901921440083 \tabularnewline
56 & 14180 & 14915.2298258229 & -735.229825822855 \tabularnewline
57 & 16202.2 & 16604.7287798611 & -402.528779861063 \tabularnewline
58 & 14392.4 & 15592.6770654339 & -1200.27706543394 \tabularnewline
59 & 15140.6 & 15270.4342340329 & -129.834234032898 \tabularnewline
60 & 15960.1 & 16338.0682104116 & -377.968210411649 \tabularnewline
61 & 14351.3 & 14866.7368313112 & -515.436831311219 \tabularnewline
62 & 13230.2 & 13524.0447346589 & -293.8447346589 \tabularnewline
63 & 15202.1 & 16334.0423803267 & -1131.94238032671 \tabularnewline
64 & 17157.3 & 16784.4467769142 & 372.853223085834 \tabularnewline
65 & 16159.1 & 16328.1307591328 & -169.030759132836 \tabularnewline
66 & 13405.7 & 14892.5223999516 & -1486.82239995165 \tabularnewline
67 & 17224.7 & 15873.5034959512 & 1351.19650404876 \tabularnewline
68 & 17338.4 & 15944.2579785850 & 1394.14202141497 \tabularnewline
69 & 17370.6 & 17640.9211559869 & -270.321155986921 \tabularnewline
70 & 18817.8 & 16597.5711355845 & 2220.22886441555 \tabularnewline
71 & 16593.2 & 16282.7412116089 & 310.458788391136 \tabularnewline
72 & 17979.5 & 17339.5781449921 & 639.921855007934 \tabularnewline
73 & 17015.2 & 15852.8311353261 & 1162.36886467389 \tabularnewline
\hline
\end{tabular}
%Source: https://freestatistics.org/blog/index.php?pk=25568&T=4

[TABLE]
[ROW][C]Multiple Linear Regression - Actuals, Interpolation, and Residuals[/C][/ROW]
[ROW][C]Time or Index[/C][C]Actuals[/C][C]InterpolationForecast[/C][C]ResidualsPrediction Error[/C][/ROW]
[ROW][C]1[/C][C]11178.4[/C][C]10154.2094146491[/C][C]1024.19058535093[/C][/ROW]
[ROW][C]2[/C][C]9516.4[/C][C]8832.28825057027[/C][C]684.111749429731[/C][/ROW]
[ROW][C]3[/C][C]12102.8[/C][C]11586.5043333805[/C][C]516.295666619454[/C][/ROW]
[ROW][C]4[/C][C]12989[/C][C]12034.3457138092[/C][C]954.654286190765[/C][/ROW]
[ROW][C]5[/C][C]11610.2[/C][C]11574.0541735826[/C][C]36.1458264173805[/C][/ROW]
[ROW][C]6[/C][C]10205.5[/C][C]10129.4960586586[/C][C]76.0039413414454[/C][/ROW]
[ROW][C]7[/C][C]11356.2[/C][C]11119.3861410595[/C][C]236.81385894052[/C][/ROW]
[ROW][C]8[/C][C]11307.1[/C][C]11203.5051202984[/C][C]103.594879701576[/C][/ROW]
[ROW][C]9[/C][C]12648.6[/C][C]12909.9403745768[/C][C]-261.340374576814[/C][/ROW]
[ROW][C]10[/C][C]11947.2[/C][C]11846.3898229441[/C][C]100.810177055877[/C][/ROW]
[ROW][C]11[/C][C]11714.1[/C][C]11548.6589071366[/C][C]165.441092863419[/C][/ROW]
[ROW][C]12[/C][C]12192.5[/C][C]12619.5066379782[/C][C]-427.006637978169[/C][/ROW]
[ROW][C]13[/C][C]11268.8[/C][C]11147.3606109235[/C][C]121.439389076490[/C][/ROW]
[ROW][C]14[/C][C]9097.4[/C][C]9817.01044820187[/C][C]-719.610448201868[/C][/ROW]
[ROW][C]15[/C][C]12639.8[/C][C]12573.7653259104[/C][C]66.034674089567[/C][/ROW]
[ROW][C]16[/C][C]13040.1[/C][C]13076.2914715802[/C][C]-36.1914715801941[/C][/ROW]
[ROW][C]17[/C][C]11687.3[/C][C]12621.0004199179[/C][C]-933.700419917911[/C][/ROW]
[ROW][C]18[/C][C]11191.7[/C][C]11169.6030346402[/C][C]22.0969653597856[/C][/ROW]
[ROW][C]19[/C][C]11391.9[/C][C]12200.8650639266[/C][C]-808.965063926562[/C][/ROW]
[ROW][C]20[/C][C]11793.1[/C][C]12260.0405823344[/C][C]-466.940582334421[/C][/ROW]
[ROW][C]21[/C][C]13933.2[/C][C]13937.5116465441[/C][C]-4.31164654405717[/C][/ROW]
[ROW][C]22[/C][C]12778.1[/C][C]12889.1369163168[/C][C]-111.036916316787[/C][/ROW]
[ROW][C]23[/C][C]11810.3[/C][C]12543.9799402291[/C][C]-733.679940229145[/C][/ROW]
[ROW][C]24[/C][C]13698.4[/C][C]13566.7916418281[/C][C]131.608358171910[/C][/ROW]
[ROW][C]25[/C][C]11956.6[/C][C]12114.8275639163[/C][C]-158.227563916310[/C][/ROW]
[ROW][C]26[/C][C]10723.8[/C][C]10737.0666872734[/C][C]-13.2666872733547[/C][/ROW]
[ROW][C]27[/C][C]13938.9[/C][C]13482.1933259511[/C][C]456.706674048939[/C][/ROW]
[ROW][C]28[/C][C]13979.8[/C][C]13934.7558181647[/C][C]45.0441818352726[/C][/ROW]
[ROW][C]29[/C][C]13807.4[/C][C]13443.0020623126[/C][C]364.397937687386[/C][/ROW]
[ROW][C]30[/C][C]12973.9[/C][C]11979.6098833685[/C][C]994.290116631504[/C][/ROW]
[ROW][C]31[/C][C]12509.8[/C][C]12937.2925302426[/C][C]-427.49253024255[/C][/ROW]
[ROW][C]32[/C][C]12934.1[/C][C]12980.3039624550[/C][C]-46.2039624549565[/C][/ROW]
[ROW][C]33[/C][C]14908.3[/C][C]14627.5339506865[/C][C]280.766049313541[/C][/ROW]
[ROW][C]34[/C][C]13772.1[/C][C]13553.8370943623[/C][C]218.262905637702[/C][/ROW]
[ROW][C]35[/C][C]13012.6[/C][C]13218.6173065236[/C][C]-206.017306523594[/C][/ROW]
[ROW][C]36[/C][C]14049.9[/C][C]14268.6117338246[/C][C]-218.711733824616[/C][/ROW]
[ROW][C]37[/C][C]11816.5[/C][C]12823.4328445724[/C][C]-1006.93284457240[/C][/ROW]
[ROW][C]38[/C][C]11593.2[/C][C]11454.9838408571[/C][C]138.216159142944[/C][/ROW]
[ROW][C]39[/C][C]14466.2[/C][C]14199.7822907962[/C][C]266.417709203841[/C][/ROW]
[ROW][C]40[/C][C]13615.9[/C][C]14700.8244681203[/C][C]-1084.92446812028[/C][/ROW]
[ROW][C]41[/C][C]14733.9[/C][C]14207.9674431946[/C][C]525.932556805409[/C][/ROW]
[ROW][C]42[/C][C]13880.7[/C][C]12771.9759812968[/C][C]1108.72401870324[/C][/ROW]
[ROW][C]43[/C][C]13527.5[/C][C]13753.1508473801[/C][C]-225.650847380089[/C][/ROW]
[ROW][C]44[/C][C]13584[/C][C]13833.3625305043[/C][C]-249.36253050431[/C][/ROW]
[ROW][C]45[/C][C]16170.2[/C][C]15512.4640923447[/C][C]657.735907655313[/C][/ROW]
[ROW][C]46[/C][C]13260.6[/C][C]14488.5879653584[/C][C]-1227.98796535840[/C][/ROW]
[ROW][C]47[/C][C]14741.9[/C][C]14148.2684004689[/C][C]593.631599531083[/C][/ROW]
[ROW][C]48[/C][C]15486.5[/C][C]15234.3436309654[/C][C]252.15636903459[/C][/ROW]
[ROW][C]49[/C][C]13154.5[/C][C]13781.9015993014[/C][C]-627.401599301378[/C][/ROW]
[ROW][C]50[/C][C]12621.2[/C][C]12416.8060384386[/C][C]204.393961561448[/C][/ROW]
[ROW][C]51[/C][C]15031.6[/C][C]15205.1123436351[/C][C]-173.512343635087[/C][/ROW]
[ROW][C]52[/C][C]15452.4[/C][C]15703.8357514114[/C][C]-251.435751411397[/C][/ROW]
[ROW][C]53[/C][C]15428[/C][C]15251.7451418594[/C][C]176.254858140573[/C][/ROW]
[ROW][C]54[/C][C]13105.9[/C][C]13820.1926420843[/C][C]-714.292642084326[/C][/ROW]
[ROW][C]55[/C][C]14716.8[/C][C]14842.7019214401[/C][C]-125.901921440083[/C][/ROW]
[ROW][C]56[/C][C]14180[/C][C]14915.2298258229[/C][C]-735.229825822855[/C][/ROW]
[ROW][C]57[/C][C]16202.2[/C][C]16604.7287798611[/C][C]-402.528779861063[/C][/ROW]
[ROW][C]58[/C][C]14392.4[/C][C]15592.6770654339[/C][C]-1200.27706543394[/C][/ROW]
[ROW][C]59[/C][C]15140.6[/C][C]15270.4342340329[/C][C]-129.834234032898[/C][/ROW]
[ROW][C]60[/C][C]15960.1[/C][C]16338.0682104116[/C][C]-377.968210411649[/C][/ROW]
[ROW][C]61[/C][C]14351.3[/C][C]14866.7368313112[/C][C]-515.436831311219[/C][/ROW]
[ROW][C]62[/C][C]13230.2[/C][C]13524.0447346589[/C][C]-293.8447346589[/C][/ROW]
[ROW][C]63[/C][C]15202.1[/C][C]16334.0423803267[/C][C]-1131.94238032671[/C][/ROW]
[ROW][C]64[/C][C]17157.3[/C][C]16784.4467769142[/C][C]372.853223085834[/C][/ROW]
[ROW][C]65[/C][C]16159.1[/C][C]16328.1307591328[/C][C]-169.030759132836[/C][/ROW]
[ROW][C]66[/C][C]13405.7[/C][C]14892.5223999516[/C][C]-1486.82239995165[/C][/ROW]
[ROW][C]67[/C][C]17224.7[/C][C]15873.5034959512[/C][C]1351.19650404876[/C][/ROW]
[ROW][C]68[/C][C]17338.4[/C][C]15944.2579785850[/C][C]1394.14202141497[/C][/ROW]
[ROW][C]69[/C][C]17370.6[/C][C]17640.9211559869[/C][C]-270.321155986921[/C][/ROW]
[ROW][C]70[/C][C]18817.8[/C][C]16597.5711355845[/C][C]2220.22886441555[/C][/ROW]
[ROW][C]71[/C][C]16593.2[/C][C]16282.7412116089[/C][C]310.458788391136[/C][/ROW]
[ROW][C]72[/C][C]17979.5[/C][C]17339.5781449921[/C][C]639.921855007934[/C][/ROW]
[ROW][C]73[/C][C]17015.2[/C][C]15852.8311353261[/C][C]1162.36886467389[/C][/ROW]
[/TABLE]
Source: https://freestatistics.org/blog/index.php?pk=25568&T=4

Globally Unique Identifier (entire table): ba.freestatistics.org/blog/index.php?pk=25568&T=4

As an alternative you can also use a QR Code:  

The GUIDs for individual cells are displayed in the table below:

Multiple Linear Regression - Actuals, Interpolation, and Residuals
Time or IndexActualsInterpolationForecastResidualsPrediction Error
111178.410154.20941464911024.19058535093
29516.48832.28825057027684.111749429731
312102.811586.5043333805516.295666619454
41298912034.3457138092954.654286190765
511610.211574.054173582636.1458264173805
610205.510129.496058658676.0039413414454
711356.211119.3861410595236.81385894052
811307.111203.5051202984103.594879701576
912648.612909.9403745768-261.340374576814
1011947.211846.3898229441100.810177055877
1111714.111548.6589071366165.441092863419
1212192.512619.5066379782-427.006637978169
1311268.811147.3606109235121.439389076490
149097.49817.01044820187-719.610448201868
1512639.812573.765325910466.034674089567
1613040.113076.2914715802-36.1914715801941
1711687.312621.0004199179-933.700419917911
1811191.711169.603034640222.0969653597856
1911391.912200.8650639266-808.965063926562
2011793.112260.0405823344-466.940582334421
2113933.213937.5116465441-4.31164654405717
2212778.112889.1369163168-111.036916316787
2311810.312543.9799402291-733.679940229145
2413698.413566.7916418281131.608358171910
2511956.612114.8275639163-158.227563916310
2610723.810737.0666872734-13.2666872733547
2713938.913482.1933259511456.706674048939
2813979.813934.755818164745.0441818352726
2913807.413443.0020623126364.397937687386
3012973.911979.6098833685994.290116631504
3112509.812937.2925302426-427.49253024255
3212934.112980.3039624550-46.2039624549565
3314908.314627.5339506865280.766049313541
3413772.113553.8370943623218.262905637702
3513012.613218.6173065236-206.017306523594
3614049.914268.6117338246-218.711733824616
3711816.512823.4328445724-1006.93284457240
3811593.211454.9838408571138.216159142944
3914466.214199.7822907962266.417709203841
4013615.914700.8244681203-1084.92446812028
4114733.914207.9674431946525.932556805409
4213880.712771.97598129681108.72401870324
4313527.513753.1508473801-225.650847380089
441358413833.3625305043-249.36253050431
4516170.215512.4640923447657.735907655313
4613260.614488.5879653584-1227.98796535840
4714741.914148.2684004689593.631599531083
4815486.515234.3436309654252.15636903459
4913154.513781.9015993014-627.401599301378
5012621.212416.8060384386204.393961561448
5115031.615205.1123436351-173.512343635087
5215452.415703.8357514114-251.435751411397
531542815251.7451418594176.254858140573
5413105.913820.1926420843-714.292642084326
5514716.814842.7019214401-125.901921440083
561418014915.2298258229-735.229825822855
5716202.216604.7287798611-402.528779861063
5814392.415592.6770654339-1200.27706543394
5915140.615270.4342340329-129.834234032898
6015960.116338.0682104116-377.968210411649
6114351.314866.7368313112-515.436831311219
6213230.213524.0447346589-293.8447346589
6315202.116334.0423803267-1131.94238032671
6417157.316784.4467769142372.853223085834
6516159.116328.1307591328-169.030759132836
6613405.714892.5223999516-1486.82239995165
6717224.715873.50349595121351.19650404876
6817338.415944.25797858501394.14202141497
6917370.617640.9211559869-270.321155986921
7018817.816597.57113558452220.22886441555
7116593.216282.7412116089310.458788391136
7217979.517339.5781449921639.921855007934
7317015.215852.83113532611162.36886467389


Goldfeld-Quandt test for Heteroskedasticity
p-valuesAlternative Hypothesis
breakpoint indexgreater2-sidedless
180.06131990389864780.1226398077972960.938680096101352
190.03006233840213780.06012467680427550.969937661597862
200.01177315998556830.02354631997113670.988226840014432
210.003408105519949130.006816211039898270.99659189448005
220.001334861035205700.002669722070411410.998665138964794
230.0008397431707795010.001679486341559000.99916025682922
240.0009156669485861630.001831333897172330.999084333051414
250.000870482972614530.001740965945229060.999129517027386
260.0004176104833276120.0008352209666552240.999582389516672
270.0003144513459830370.0006289026919660750.999685548654017
280.0001079582515123300.0002159165030246610.999892041748488
290.0001315778574906960.0002631557149813920.99986842214251
300.0003193857412313610.0006387714824627220.999680614258769
310.0005954814677926710.001190962935585340.999404518532207
320.0003076566152320480.0006153132304640970.999692343384768
330.0002097628840770330.0004195257681540660.999790237115923
340.0001859784531251820.0003719569062503630.999814021546875
350.0002138554717378890.0004277109434757780.999786144528262
360.0002173921310890390.0004347842621780780.99978260786891
370.0008322635299881210.001664527059976240.999167736470012
380.001059524735814150.002119049471628310.998940475264186
390.00140733011258020.00281466022516040.99859266988742
400.002752177336123030.005504354672246070.997247822663877
410.002553804884643460.005107609769286920.997446195115357
420.1014721160413040.2029442320826090.898527883958696
430.07953738775010260.1590747755002050.920462612249897
440.05128641439812030.1025728287962410.94871358560188
450.070069038119150.14013807623830.92993096188085
460.2346132900796050.4692265801592090.765386709920395
470.2039562033350310.4079124066700620.796043796664969
480.1900620518469440.3801241036938880.809937948153056
490.1556548010780180.3113096021560360.844345198921982
500.1047801581014670.2095603162029330.895219841898533
510.1370188134763630.2740376269527250.862981186523637
520.1106005486634210.2212010973268420.889399451336579
530.07371964953004330.1474392990600870.926280350469957
540.09136938196310280.1827387639262060.908630618036897
550.3941407176119570.7882814352239140.605859282388043

\begin{tabular}{lllllllll}
\hline
Goldfeld-Quandt test for Heteroskedasticity \tabularnewline
p-values & Alternative Hypothesis \tabularnewline
breakpoint index & greater & 2-sided & less \tabularnewline
18 & 0.0613199038986478 & 0.122639807797296 & 0.938680096101352 \tabularnewline
19 & 0.0300623384021378 & 0.0601246768042755 & 0.969937661597862 \tabularnewline
20 & 0.0117731599855683 & 0.0235463199711367 & 0.988226840014432 \tabularnewline
21 & 0.00340810551994913 & 0.00681621103989827 & 0.99659189448005 \tabularnewline
22 & 0.00133486103520570 & 0.00266972207041141 & 0.998665138964794 \tabularnewline
23 & 0.000839743170779501 & 0.00167948634155900 & 0.99916025682922 \tabularnewline
24 & 0.000915666948586163 & 0.00183133389717233 & 0.999084333051414 \tabularnewline
25 & 0.00087048297261453 & 0.00174096594522906 & 0.999129517027386 \tabularnewline
26 & 0.000417610483327612 & 0.000835220966655224 & 0.999582389516672 \tabularnewline
27 & 0.000314451345983037 & 0.000628902691966075 & 0.999685548654017 \tabularnewline
28 & 0.000107958251512330 & 0.000215916503024661 & 0.999892041748488 \tabularnewline
29 & 0.000131577857490696 & 0.000263155714981392 & 0.99986842214251 \tabularnewline
30 & 0.000319385741231361 & 0.000638771482462722 & 0.999680614258769 \tabularnewline
31 & 0.000595481467792671 & 0.00119096293558534 & 0.999404518532207 \tabularnewline
32 & 0.000307656615232048 & 0.000615313230464097 & 0.999692343384768 \tabularnewline
33 & 0.000209762884077033 & 0.000419525768154066 & 0.999790237115923 \tabularnewline
34 & 0.000185978453125182 & 0.000371956906250363 & 0.999814021546875 \tabularnewline
35 & 0.000213855471737889 & 0.000427710943475778 & 0.999786144528262 \tabularnewline
36 & 0.000217392131089039 & 0.000434784262178078 & 0.99978260786891 \tabularnewline
37 & 0.000832263529988121 & 0.00166452705997624 & 0.999167736470012 \tabularnewline
38 & 0.00105952473581415 & 0.00211904947162831 & 0.998940475264186 \tabularnewline
39 & 0.0014073301125802 & 0.0028146602251604 & 0.99859266988742 \tabularnewline
40 & 0.00275217733612303 & 0.00550435467224607 & 0.997247822663877 \tabularnewline
41 & 0.00255380488464346 & 0.00510760976928692 & 0.997446195115357 \tabularnewline
42 & 0.101472116041304 & 0.202944232082609 & 0.898527883958696 \tabularnewline
43 & 0.0795373877501026 & 0.159074775500205 & 0.920462612249897 \tabularnewline
44 & 0.0512864143981203 & 0.102572828796241 & 0.94871358560188 \tabularnewline
45 & 0.07006903811915 & 0.1401380762383 & 0.92993096188085 \tabularnewline
46 & 0.234613290079605 & 0.469226580159209 & 0.765386709920395 \tabularnewline
47 & 0.203956203335031 & 0.407912406670062 & 0.796043796664969 \tabularnewline
48 & 0.190062051846944 & 0.380124103693888 & 0.809937948153056 \tabularnewline
49 & 0.155654801078018 & 0.311309602156036 & 0.844345198921982 \tabularnewline
50 & 0.104780158101467 & 0.209560316202933 & 0.895219841898533 \tabularnewline
51 & 0.137018813476363 & 0.274037626952725 & 0.862981186523637 \tabularnewline
52 & 0.110600548663421 & 0.221201097326842 & 0.889399451336579 \tabularnewline
53 & 0.0737196495300433 & 0.147439299060087 & 0.926280350469957 \tabularnewline
54 & 0.0913693819631028 & 0.182738763926206 & 0.908630618036897 \tabularnewline
55 & 0.394140717611957 & 0.788281435223914 & 0.605859282388043 \tabularnewline
\hline
\end{tabular}
%Source: https://freestatistics.org/blog/index.php?pk=25568&T=5

[TABLE]
[ROW][C]Goldfeld-Quandt test for Heteroskedasticity[/C][/ROW]
[ROW][C]p-values[/C][C]Alternative Hypothesis[/C][/ROW]
[ROW][C]breakpoint index[/C][C]greater[/C][C]2-sided[/C][C]less[/C][/ROW]
[ROW][C]18[/C][C]0.0613199038986478[/C][C]0.122639807797296[/C][C]0.938680096101352[/C][/ROW]
[ROW][C]19[/C][C]0.0300623384021378[/C][C]0.0601246768042755[/C][C]0.969937661597862[/C][/ROW]
[ROW][C]20[/C][C]0.0117731599855683[/C][C]0.0235463199711367[/C][C]0.988226840014432[/C][/ROW]
[ROW][C]21[/C][C]0.00340810551994913[/C][C]0.00681621103989827[/C][C]0.99659189448005[/C][/ROW]
[ROW][C]22[/C][C]0.00133486103520570[/C][C]0.00266972207041141[/C][C]0.998665138964794[/C][/ROW]
[ROW][C]23[/C][C]0.000839743170779501[/C][C]0.00167948634155900[/C][C]0.99916025682922[/C][/ROW]
[ROW][C]24[/C][C]0.000915666948586163[/C][C]0.00183133389717233[/C][C]0.999084333051414[/C][/ROW]
[ROW][C]25[/C][C]0.00087048297261453[/C][C]0.00174096594522906[/C][C]0.999129517027386[/C][/ROW]
[ROW][C]26[/C][C]0.000417610483327612[/C][C]0.000835220966655224[/C][C]0.999582389516672[/C][/ROW]
[ROW][C]27[/C][C]0.000314451345983037[/C][C]0.000628902691966075[/C][C]0.999685548654017[/C][/ROW]
[ROW][C]28[/C][C]0.000107958251512330[/C][C]0.000215916503024661[/C][C]0.999892041748488[/C][/ROW]
[ROW][C]29[/C][C]0.000131577857490696[/C][C]0.000263155714981392[/C][C]0.99986842214251[/C][/ROW]
[ROW][C]30[/C][C]0.000319385741231361[/C][C]0.000638771482462722[/C][C]0.999680614258769[/C][/ROW]
[ROW][C]31[/C][C]0.000595481467792671[/C][C]0.00119096293558534[/C][C]0.999404518532207[/C][/ROW]
[ROW][C]32[/C][C]0.000307656615232048[/C][C]0.000615313230464097[/C][C]0.999692343384768[/C][/ROW]
[ROW][C]33[/C][C]0.000209762884077033[/C][C]0.000419525768154066[/C][C]0.999790237115923[/C][/ROW]
[ROW][C]34[/C][C]0.000185978453125182[/C][C]0.000371956906250363[/C][C]0.999814021546875[/C][/ROW]
[ROW][C]35[/C][C]0.000213855471737889[/C][C]0.000427710943475778[/C][C]0.999786144528262[/C][/ROW]
[ROW][C]36[/C][C]0.000217392131089039[/C][C]0.000434784262178078[/C][C]0.99978260786891[/C][/ROW]
[ROW][C]37[/C][C]0.000832263529988121[/C][C]0.00166452705997624[/C][C]0.999167736470012[/C][/ROW]
[ROW][C]38[/C][C]0.00105952473581415[/C][C]0.00211904947162831[/C][C]0.998940475264186[/C][/ROW]
[ROW][C]39[/C][C]0.0014073301125802[/C][C]0.0028146602251604[/C][C]0.99859266988742[/C][/ROW]
[ROW][C]40[/C][C]0.00275217733612303[/C][C]0.00550435467224607[/C][C]0.997247822663877[/C][/ROW]
[ROW][C]41[/C][C]0.00255380488464346[/C][C]0.00510760976928692[/C][C]0.997446195115357[/C][/ROW]
[ROW][C]42[/C][C]0.101472116041304[/C][C]0.202944232082609[/C][C]0.898527883958696[/C][/ROW]
[ROW][C]43[/C][C]0.0795373877501026[/C][C]0.159074775500205[/C][C]0.920462612249897[/C][/ROW]
[ROW][C]44[/C][C]0.0512864143981203[/C][C]0.102572828796241[/C][C]0.94871358560188[/C][/ROW]
[ROW][C]45[/C][C]0.07006903811915[/C][C]0.1401380762383[/C][C]0.92993096188085[/C][/ROW]
[ROW][C]46[/C][C]0.234613290079605[/C][C]0.469226580159209[/C][C]0.765386709920395[/C][/ROW]
[ROW][C]47[/C][C]0.203956203335031[/C][C]0.407912406670062[/C][C]0.796043796664969[/C][/ROW]
[ROW][C]48[/C][C]0.190062051846944[/C][C]0.380124103693888[/C][C]0.809937948153056[/C][/ROW]
[ROW][C]49[/C][C]0.155654801078018[/C][C]0.311309602156036[/C][C]0.844345198921982[/C][/ROW]
[ROW][C]50[/C][C]0.104780158101467[/C][C]0.209560316202933[/C][C]0.895219841898533[/C][/ROW]
[ROW][C]51[/C][C]0.137018813476363[/C][C]0.274037626952725[/C][C]0.862981186523637[/C][/ROW]
[ROW][C]52[/C][C]0.110600548663421[/C][C]0.221201097326842[/C][C]0.889399451336579[/C][/ROW]
[ROW][C]53[/C][C]0.0737196495300433[/C][C]0.147439299060087[/C][C]0.926280350469957[/C][/ROW]
[ROW][C]54[/C][C]0.0913693819631028[/C][C]0.182738763926206[/C][C]0.908630618036897[/C][/ROW]
[ROW][C]55[/C][C]0.394140717611957[/C][C]0.788281435223914[/C][C]0.605859282388043[/C][/ROW]
[/TABLE]
Source: https://freestatistics.org/blog/index.php?pk=25568&T=5

Globally Unique Identifier (entire table): ba.freestatistics.org/blog/index.php?pk=25568&T=5

As an alternative you can also use a QR Code:  

The GUIDs for individual cells are displayed in the table below:

Goldfeld-Quandt test for Heteroskedasticity
p-valuesAlternative Hypothesis
breakpoint indexgreater2-sidedless
180.06131990389864780.1226398077972960.938680096101352
190.03006233840213780.06012467680427550.969937661597862
200.01177315998556830.02354631997113670.988226840014432
210.003408105519949130.006816211039898270.99659189448005
220.001334861035205700.002669722070411410.998665138964794
230.0008397431707795010.001679486341559000.99916025682922
240.0009156669485861630.001831333897172330.999084333051414
250.000870482972614530.001740965945229060.999129517027386
260.0004176104833276120.0008352209666552240.999582389516672
270.0003144513459830370.0006289026919660750.999685548654017
280.0001079582515123300.0002159165030246610.999892041748488
290.0001315778574906960.0002631557149813920.99986842214251
300.0003193857412313610.0006387714824627220.999680614258769
310.0005954814677926710.001190962935585340.999404518532207
320.0003076566152320480.0006153132304640970.999692343384768
330.0002097628840770330.0004195257681540660.999790237115923
340.0001859784531251820.0003719569062503630.999814021546875
350.0002138554717378890.0004277109434757780.999786144528262
360.0002173921310890390.0004347842621780780.99978260786891
370.0008322635299881210.001664527059976240.999167736470012
380.001059524735814150.002119049471628310.998940475264186
390.00140733011258020.00281466022516040.99859266988742
400.002752177336123030.005504354672246070.997247822663877
410.002553804884643460.005107609769286920.997446195115357
420.1014721160413040.2029442320826090.898527883958696
430.07953738775010260.1590747755002050.920462612249897
440.05128641439812030.1025728287962410.94871358560188
450.070069038119150.14013807623830.92993096188085
460.2346132900796050.4692265801592090.765386709920395
470.2039562033350310.4079124066700620.796043796664969
480.1900620518469440.3801241036938880.809937948153056
490.1556548010780180.3113096021560360.844345198921982
500.1047801581014670.2095603162029330.895219841898533
510.1370188134763630.2740376269527250.862981186523637
520.1106005486634210.2212010973268420.889399451336579
530.07371964953004330.1474392990600870.926280350469957
540.09136938196310280.1827387639262060.908630618036897
550.3941407176119570.7882814352239140.605859282388043


Meta Analysis of Goldfeld-Quandt test for Heteroskedasticity
Description# significant tests% significant testsOK/NOK
1% type I error level210.552631578947368NOK
5% type I error level220.578947368421053NOK
10% type I error level230.605263157894737NOK

\begin{tabular}{lllllllll}
\hline
Meta Analysis of Goldfeld-Quandt test for Heteroskedasticity \tabularnewline
Description & # significant tests & % significant tests & OK/NOK \tabularnewline
1% type I error level & 21 & 0.552631578947368 & NOK \tabularnewline
5% type I error level & 22 & 0.578947368421053 & NOK \tabularnewline
10% type I error level & 23 & 0.605263157894737 & NOK \tabularnewline
\hline
\end{tabular}
%Source: https://freestatistics.org/blog/index.php?pk=25568&T=6

[TABLE]
[ROW][C]Meta Analysis of Goldfeld-Quandt test for Heteroskedasticity[/C][/ROW]
[ROW][C]Description[/C][C]# significant tests[/C][C]% significant tests[/C][C]OK/NOK[/C][/ROW]
[ROW][C]1% type I error level[/C][C]21[/C][C]0.552631578947368[/C][C]NOK[/C][/ROW]
[ROW][C]5% type I error level[/C][C]22[/C][C]0.578947368421053[/C][C]NOK[/C][/ROW]
[ROW][C]10% type I error level[/C][C]23[/C][C]0.605263157894737[/C][C]NOK[/C][/ROW]
[/TABLE]
Source: https://freestatistics.org/blog/index.php?pk=25568&T=6

Globally Unique Identifier (entire table): ba.freestatistics.org/blog/index.php?pk=25568&T=6

As an alternative you can also use a QR Code:  

The GUIDs for individual cells are displayed in the table below:

Meta Analysis of Goldfeld-Quandt test for Heteroskedasticity
Description# significant tests% significant testsOK/NOK
1% type I error level210.552631578947368NOK
5% type I error level220.578947368421053NOK
10% type I error level230.605263157894737NOK


Parameters (Session):
par1 = 1 ; par2 = Include Monthly Dummies ; par3 = Linear Trend ;
Parameters (R input):
par1 = 1 ; par2 = Include Monthly Dummies ; par3 = Linear Trend ;
R code (references can be found in the software module):
library(lattice)
library(lmtest)
n25 <- 25 #minimum number of obs. for Goldfeld-Quandt test
par1 <- as.numeric(par1)
x <- t(y)
k <- length(x[1,])
n <- length(x[,1])
x1 <- cbind(x[,par1], x[,1:k!=par1])
mycolnames <- c(colnames(x)[par1], colnames(x)[1:k!=par1])
colnames(x1) <- mycolnames #colnames(x)[par1]
x <- x1
if (par3 == 'First Differences'){
x2 <- array(0, dim=c(n-1,k), dimnames=list(1:(n-1), paste('(1-B)',colnames(x),sep='')))
for (i in 1:n-1) {
for (j in 1:k) {
x2[i,j] <- x[i+1,j] - x[i,j]
}
}
x <- x2
}
if (par2 == 'Include Monthly Dummies'){
x2 <- array(0, dim=c(n,11), dimnames=list(1:n, paste('M', seq(1:11), sep ='')))
for (i in 1:11){
x2[seq(i,n,12),i] <- 1
}
x <- cbind(x, x2)
}
if (par2 == 'Include Quarterly Dummies'){
x2 <- array(0, dim=c(n,3), dimnames=list(1:n, paste('Q', seq(1:3), sep ='')))
for (i in 1:3){
x2[seq(i,n,4),i] <- 1
}
x <- cbind(x, x2)
}
k <- length(x[1,])
if (par3 == 'Linear Trend'){
x <- cbind(x, c(1:n))
colnames(x)[k+1] <- 't'
}
x
k <- length(x[1,])
df <- as.data.frame(x)
(mylm <- lm(df))
(mysum <- summary(mylm))
if (n > n25) {
kp3 <- k + 3
nmkm3 <- n - k - 3
gqarr <- array(NA, dim=c(nmkm3-kp3+1,3))
numgqtests <- 0
numsignificant1 <- 0
numsignificant5 <- 0
numsignificant10 <- 0
for (mypoint in kp3:nmkm3) {
j <- 0
numgqtests <- numgqtests + 1
for (myalt in c('greater', 'two.sided', 'less')) {
j <- j + 1
gqarr[mypoint-kp3+1,j] <- gqtest(mylm, point=mypoint, alternative=myalt)$p.value
}
if (gqarr[mypoint-kp3+1,2] < 0.01) numsignificant1 <- numsignificant1 + 1
if (gqarr[mypoint-kp3+1,2] < 0.05) numsignificant5 <- numsignificant5 + 1
if (gqarr[mypoint-kp3+1,2] < 0.10) numsignificant10 <- numsignificant10 + 1
}
gqarr
}
bitmap(file='test0.png')
plot(x[,1], type='l', main='Actuals and Interpolation', ylab='value of Actuals and Interpolation (dots)', xlab='time or index')
points(x[,1]-mysum$resid)
grid()
dev.off()
bitmap(file='test1.png')
plot(mysum$resid, type='b', pch=19, main='Residuals', ylab='value of Residuals', xlab='time or index')
grid()
dev.off()
bitmap(file='test2.png')
hist(mysum$resid, main='Residual Histogram', xlab='values of Residuals')
grid()
dev.off()
bitmap(file='test3.png')
densityplot(~mysum$resid,col='black',main='Residual Density Plot', xlab='values of Residuals')
dev.off()
bitmap(file='test4.png')
qqnorm(mysum$resid, main='Residual Normal Q-Q Plot')
qqline(mysum$resid)
grid()
dev.off()
(myerror <- as.ts(mysum$resid))
bitmap(file='test5.png')
dum <- cbind(lag(myerror,k=1),myerror)
dum
dum1 <- dum[2:length(myerror),]
dum1
z <- as.data.frame(dum1)
z
plot(z,main=paste('Residual Lag plot, lowess, and regression line'), ylab='values of Residuals', xlab='lagged values of Residuals')
lines(lowess(z))
abline(lm(z))
grid()
dev.off()
bitmap(file='test6.png')
acf(mysum$resid, lag.max=length(mysum$resid)/2, main='Residual Autocorrelation Function')
grid()
dev.off()
bitmap(file='test7.png')
pacf(mysum$resid, lag.max=length(mysum$resid)/2, main='Residual Partial Autocorrelation Function')
grid()
dev.off()
bitmap(file='test8.png')
opar <- par(mfrow = c(2,2), oma = c(0, 0, 1.1, 0))
plot(mylm, las = 1, sub='Residual Diagnostics')
par(opar)
dev.off()
if (n > n25) {
bitmap(file='test9.png')
plot(kp3:nmkm3,gqarr[,2], main='Goldfeld-Quandt test',ylab='2-sided p-value',xlab='breakpoint')
grid()
dev.off()
}
load(file='createtable')
a<-table.start()
a<-table.row.start(a)
a<-table.element(a, 'Multiple Linear Regression - Estimated Regression Equation', 1, TRUE)
a<-table.row.end(a)
myeq <- colnames(x)[1]
myeq <- paste(myeq, '[t] = ', sep='')
for (i in 1:k){
if (mysum$coefficients[i,1] > 0) myeq <- paste(myeq, '+', '')
myeq <- paste(myeq, mysum$coefficients[i,1], sep=' ')
if (rownames(mysum$coefficients)[i] != '(Intercept)') {
myeq <- paste(myeq, rownames(mysum$coefficients)[i], sep='')
if (rownames(mysum$coefficients)[i] != 't') myeq <- paste(myeq, '[t]', sep='')
}
}
myeq <- paste(myeq, ' + e[t]')
a<-table.row.start(a)
a<-table.element(a, myeq)
a<-table.row.end(a)
a<-table.end(a)
table.save(a,file='mytable1.tab')
a<-table.start()
a<-table.row.start(a)
a<-table.element(a,hyperlink('ols1.htm','Multiple Linear Regression - Ordinary Least Squares',''), 6, TRUE)
a<-table.row.end(a)
a<-table.row.start(a)
a<-table.element(a,'Variable',header=TRUE)
a<-table.element(a,'Parameter',header=TRUE)
a<-table.element(a,'S.D.',header=TRUE)
a<-table.element(a,'T-STAT
H0: parameter = 0',header=TRUE)
a<-table.element(a,'2-tail p-value',header=TRUE)
a<-table.element(a,'1-tail p-value',header=TRUE)
a<-table.row.end(a)
for (i in 1:k){
a<-table.row.start(a)
a<-table.element(a,rownames(mysum$coefficients)[i],header=TRUE)
a<-table.element(a,mysum$coefficients[i,1])
a<-table.element(a, round(mysum$coefficients[i,2],6))
a<-table.element(a, round(mysum$coefficients[i,3],4))
a<-table.element(a, round(mysum$coefficients[i,4],6))
a<-table.element(a, round(mysum$coefficients[i,4]/2,6))
a<-table.row.end(a)
}
a<-table.end(a)
table.save(a,file='mytable2.tab')
a<-table.start()
a<-table.row.start(a)
a<-table.element(a, 'Multiple Linear Regression - Regression Statistics', 2, TRUE)
a<-table.row.end(a)
a<-table.row.start(a)
a<-table.element(a, 'Multiple R',1,TRUE)
a<-table.element(a, sqrt(mysum$r.squared))
a<-table.row.end(a)
a<-table.row.start(a)
a<-table.element(a, 'R-squared',1,TRUE)
a<-table.element(a, mysum$r.squared)
a<-table.row.end(a)
a<-table.row.start(a)
a<-table.element(a, 'Adjusted R-squared',1,TRUE)
a<-table.element(a, mysum$adj.r.squared)
a<-table.row.end(a)
a<-table.row.start(a)
a<-table.element(a, 'F-TEST (value)',1,TRUE)
a<-table.element(a, mysum$fstatistic[1])
a<-table.row.end(a)
a<-table.row.start(a)
a<-table.element(a, 'F-TEST (DF numerator)',1,TRUE)
a<-table.element(a, mysum$fstatistic[2])
a<-table.row.end(a)
a<-table.row.start(a)
a<-table.element(a, 'F-TEST (DF denominator)',1,TRUE)
a<-table.element(a, mysum$fstatistic[3])
a<-table.row.end(a)
a<-table.row.start(a)
a<-table.element(a, 'p-value',1,TRUE)
a<-table.element(a, 1-pf(mysum$fstatistic[1],mysum$fstatistic[2],mysum$fstatistic[3]))
a<-table.row.end(a)
a<-table.row.start(a)
a<-table.element(a, 'Multiple Linear Regression - Residual Statistics', 2, TRUE)
a<-table.row.end(a)
a<-table.row.start(a)
a<-table.element(a, 'Residual Standard Deviation',1,TRUE)
a<-table.element(a, mysum$sigma)
a<-table.row.end(a)
a<-table.row.start(a)
a<-table.element(a, 'Sum Squared Residuals',1,TRUE)
a<-table.element(a, sum(myerror*myerror))
a<-table.row.end(a)
a<-table.end(a)
table.save(a,file='mytable3.tab')
a<-table.start()
a<-table.row.start(a)
a<-table.element(a, 'Multiple Linear Regression - Actuals, Interpolation, and Residuals', 4, TRUE)
a<-table.row.end(a)
a<-table.row.start(a)
a<-table.element(a, 'Time or Index', 1, TRUE)
a<-table.element(a, 'Actuals', 1, TRUE)
a<-table.element(a, 'Interpolation
Forecast', 1, TRUE)
a<-table.element(a, 'Residuals
Prediction Error', 1, TRUE)
a<-table.row.end(a)
for (i in 1:n) {
a<-table.row.start(a)
a<-table.element(a,i, 1, TRUE)
a<-table.element(a,x[i])
a<-table.element(a,x[i]-mysum$resid[i])
a<-table.element(a,mysum$resid[i])
a<-table.row.end(a)
}
a<-table.end(a)
table.save(a,file='mytable4.tab')
if (n > n25) {
a<-table.start()
a<-table.row.start(a)
a<-table.element(a,'Goldfeld-Quandt test for Heteroskedasticity',4,TRUE)
a<-table.row.end(a)
a<-table.row.start(a)
a<-table.element(a,'p-values',header=TRUE)
a<-table.element(a,'Alternative Hypothesis',3,header=TRUE)
a<-table.row.end(a)
a<-table.row.start(a)
a<-table.element(a,'breakpoint index',header=TRUE)
a<-table.element(a,'greater',header=TRUE)
a<-table.element(a,'2-sided',header=TRUE)
a<-table.element(a,'less',header=TRUE)
a<-table.row.end(a)
for (mypoint in kp3:nmkm3) {
a<-table.row.start(a)
a<-table.element(a,mypoint,header=TRUE)
a<-table.element(a,gqarr[mypoint-kp3+1,1])
a<-table.element(a,gqarr[mypoint-kp3+1,2])
a<-table.element(a,gqarr[mypoint-kp3+1,3])
a<-table.row.end(a)
}
a<-table.end(a)
table.save(a,file='mytable5.tab')
a<-table.start()
a<-table.row.start(a)
a<-table.element(a,'Meta Analysis of Goldfeld-Quandt test for Heteroskedasticity',4,TRUE)
a<-table.row.end(a)
a<-table.row.start(a)
a<-table.element(a,'Description',header=TRUE)
a<-table.element(a,'# significant tests',header=TRUE)
a<-table.element(a,'% significant tests',header=TRUE)
a<-table.element(a,'OK/NOK',header=TRUE)
a<-table.row.end(a)
a<-table.row.start(a)
a<-table.element(a,'1% type I error level',header=TRUE)
a<-table.element(a,numsignificant1)
a<-table.element(a,numsignificant1/numgqtests)
if (numsignificant1/numgqtests < 0.01) dum <- 'OK' else dum <- 'NOK'
a<-table.element(a,dum)
a<-table.row.end(a)
a<-table.row.start(a)
a<-table.element(a,'5% type I error level',header=TRUE)
a<-table.element(a,numsignificant5)
a<-table.element(a,numsignificant5/numgqtests)
if (numsignificant5/numgqtests < 0.05) dum <- 'OK' else dum <- 'NOK'
a<-table.element(a,dum)
a<-table.row.end(a)
a<-table.row.start(a)
a<-table.element(a,'10% type I error level',header=TRUE)
a<-table.element(a,numsignificant10)
a<-table.element(a,numsignificant10/numgqtests)
if (numsignificant10/numgqtests < 0.1) dum <- 'OK' else dum <- 'NOK'
a<-table.element(a,dum)
a<-table.row.end(a)
a<-table.end(a)
table.save(a,file='mytable6.tab')
}