Free Statistics

of Irreproducible Research!

Author's title

Author*The author of this computation has been verified*
R Software Modulerwasp_multipleregression.wasp
Title produced by softwareMultiple Regression
Date of computationMon, 24 Nov 2008 17:19:35 -0700
Cite this page as followsStatistical Computations at FreeStatistics.org, Office for Research Development and Education, URL https://freestatistics.org/blog/index.php?v=date/2008/Nov/25/t1227572465kc1xfml8k61k1ld.htm/, Retrieved Thu, 09 May 2024 08:54:59 +0000
Statistical Computations at FreeStatistics.org, Office for Research Development and Education, URL https://freestatistics.org/blog/index.php?pk=25560, Retrieved Thu, 09 May 2024 08:54:59 +0000
QR Codes:

Original text written by user:
IsPrivate?No (this computation is public)
User-defined keywords
Estimated Impact210
Family? (F = Feedback message, R = changed R code, M = changed R Module, P = changed Parameters, D = changed Data)
-     [Multiple Regression] [Q1 The Seatbeltlaw] [2007-11-14 19:27:43] [8cd6641b921d30ebe00b648d1481bba0]
F    D  [Multiple Regression] [Seatbelt Law - Q1] [2008-11-19 12:45:01] [82970caad4b026be9dd352fdec547fe4]
-   P     [Multiple Regression] [Seatbelt Law - Q1...] [2008-11-19 12:54:40] [82970caad4b026be9dd352fdec547fe4]
F   P       [Multiple Regression] [Seatbelt Law - Q1...] [2008-11-19 13:00:05] [82970caad4b026be9dd352fdec547fe4]
-    D          [Multiple Regression] [dummy] [2008-11-25 00:19:35] [ba53780e6ef414874481f097d8d35fc7] [Current]
Feedback Forum

Post a new message
Dataseries X:
10.400	1
10.800	1
10.600	1
11.200	1
11.800	1
11.300	1
10.800	1
10.600	1
10.900	1
10.200	1
10.100	1
10.100	1
10.000	1
10.100	0
10.300	0
10.900	0
10.700	0
10.500	0
10.600	0
10.600	0
10.800	0
10.700	0
10.400	0
10.400	0
10.600	0
10.900	0
10.900	0
10.500	0
10.100	0
10.200	0
10.300	0
10.600	0
10.800	0
10.500	0
10.500	0
10.500	0
10.400	0
10.500	0
10.700	0
11.000	0
11.600	0
11.600	0
11.700	0
11.700	0
11.800	0
12.100	0
11.800	0
11.300	0
11.200	0
11.700	0
11.900	0
12.600	0
12.500	0
12.800	0
13.500	0
13.900	0
14.500	0
14.100	0
13.200	0
13.100	0
13.300	0
13.200	0
13.200	0
14.000	0
14.300	0
14.300	0
14.500	0
14.500	1
13.300	1
12.700	1
12.700	1
12.900	1
12.500	1
12.600	0
13.200	0
13.600	0
14.000	0
14.100	0
14.200	0
13.900	0
13.800	0
14.100	0
14.700	0
14.400	0
14.700	0
14.500	0
14.700	0
14.900	0
15.400	0
16.100	0
16.300	0


Summary of computational transaction
Raw Inputview raw input (R code)
Raw Outputview raw output of R engine
Computing time3 seconds
R Server'Gwilym Jenkins' @ 72.249.127.135

\begin{tabular}{lllllllll}
\hline
Summary of computational transaction \tabularnewline
Raw Input & view raw input (R code)  \tabularnewline
Raw Output & view raw output of R engine  \tabularnewline
Computing time & 3 seconds \tabularnewline
R Server & 'Gwilym Jenkins' @ 72.249.127.135 \tabularnewline
\hline
\end{tabular}
%Source: https://freestatistics.org/blog/index.php?pk=25560&T=0

[TABLE]
[ROW][C]Summary of computational transaction[/C][/ROW]
[ROW][C]Raw Input[/C][C]view raw input (R code) [/C][/ROW]
[ROW][C]Raw Output[/C][C]view raw output of R engine [/C][/ROW]
[ROW][C]Computing time[/C][C]3 seconds[/C][/ROW]
[ROW][C]R Server[/C][C]'Gwilym Jenkins' @ 72.249.127.135[/C][/ROW]
[/TABLE]
Source: https://freestatistics.org/blog/index.php?pk=25560&T=0

Globally Unique Identifier (entire table): ba.freestatistics.org/blog/index.php?pk=25560&T=0

As an alternative you can also use a QR Code:  

The GUIDs for individual cells are displayed in the table below:

Summary of computational transaction
Raw Inputview raw input (R code)
Raw Outputview raw output of R engine
Computing time3 seconds
R Server'Gwilym Jenkins' @ 72.249.127.135


Multiple Linear Regression - Estimated Regression Equation
Y[t] = + 12.3555555555556 -0.91345029239766D[t] + e[t]

\begin{tabular}{lllllllll}
\hline
Multiple Linear Regression - Estimated Regression Equation \tabularnewline
Y[t] =  +  12.3555555555556 -0.91345029239766D[t]  + e[t] \tabularnewline
\hline
\end{tabular}
%Source: https://freestatistics.org/blog/index.php?pk=25560&T=1

[TABLE]
[ROW][C]Multiple Linear Regression - Estimated Regression Equation[/C][/ROW]
[ROW][C]Y[t] =  +  12.3555555555556 -0.91345029239766D[t]  + e[t][/C][/ROW]
[/TABLE]
Source: https://freestatistics.org/blog/index.php?pk=25560&T=1

Globally Unique Identifier (entire table): ba.freestatistics.org/blog/index.php?pk=25560&T=1

As an alternative you can also use a QR Code:  

The GUIDs for individual cells are displayed in the table below:

Multiple Linear Regression - Estimated Regression Equation
Y[t] = + 12.3555555555556 -0.91345029239766D[t] + e[t]


Multiple Linear Regression - Ordinary Least Squares
VariableParameterS.D.T-STATH0: parameter = 02-tail p-value1-tail p-value
(Intercept)12.35555555555560.195463.232200
D-0.913450292397660.42763-2.13610.0354180.017709

\begin{tabular}{lllllllll}
\hline
Multiple Linear Regression - Ordinary Least Squares \tabularnewline
Variable & Parameter & S.D. & T-STATH0: parameter = 0 & 2-tail p-value & 1-tail p-value \tabularnewline
(Intercept) & 12.3555555555556 & 0.1954 & 63.2322 & 0 & 0 \tabularnewline
D & -0.91345029239766 & 0.42763 & -2.1361 & 0.035418 & 0.017709 \tabularnewline
\hline
\end{tabular}
%Source: https://freestatistics.org/blog/index.php?pk=25560&T=2

[TABLE]
[ROW][C]Multiple Linear Regression - Ordinary Least Squares[/C][/ROW]
[ROW][C]Variable[/C][C]Parameter[/C][C]S.D.[/C][C]T-STATH0: parameter = 0[/C][C]2-tail p-value[/C][C]1-tail p-value[/C][/ROW]
[ROW][C](Intercept)[/C][C]12.3555555555556[/C][C]0.1954[/C][C]63.2322[/C][C]0[/C][C]0[/C][/ROW]
[ROW][C]D[/C][C]-0.91345029239766[/C][C]0.42763[/C][C]-2.1361[/C][C]0.035418[/C][C]0.017709[/C][/ROW]
[/TABLE]
Source: https://freestatistics.org/blog/index.php?pk=25560&T=2

Globally Unique Identifier (entire table): ba.freestatistics.org/blog/index.php?pk=25560&T=2

As an alternative you can also use a QR Code:  

The GUIDs for individual cells are displayed in the table below:

Multiple Linear Regression - Ordinary Least Squares
VariableParameterS.D.T-STATH0: parameter = 02-tail p-value1-tail p-value
(Intercept)12.35555555555560.195463.232200
D-0.913450292397660.42763-2.13610.0354180.017709


Multiple Linear Regression - Regression Statistics
Multiple R0.220833767021393
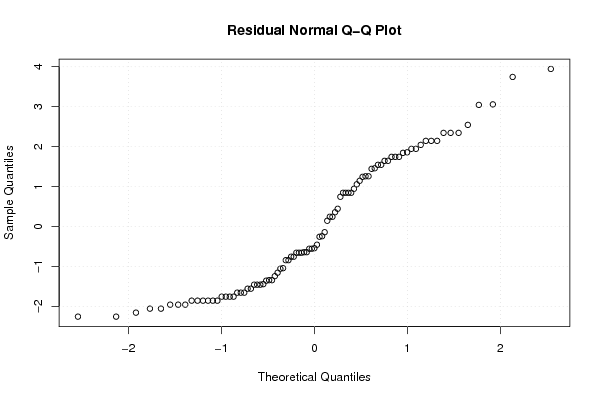
R-squared0.0487675526568587
Adjusted R-squared0.0380795476305312
F-TEST (value)4.56283025098988
F-TEST (DF numerator)1
F-TEST (DF denominator)89
p-value0.0354183230423479
Multiple Linear Regression - Residual Statistics
Residual Standard Deviation1.65802133857879
Sum Squared Residuals244.664093567251

\begin{tabular}{lllllllll}
\hline
Multiple Linear Regression - Regression Statistics \tabularnewline
Multiple R & 0.220833767021393 \tabularnewline
R-squared & 0.0487675526568587 \tabularnewline
Adjusted R-squared & 0.0380795476305312 \tabularnewline
F-TEST (value) & 4.56283025098988 \tabularnewline
F-TEST (DF numerator) & 1 \tabularnewline
F-TEST (DF denominator) & 89 \tabularnewline
p-value & 0.0354183230423479 \tabularnewline
Multiple Linear Regression - Residual Statistics \tabularnewline
Residual Standard Deviation & 1.65802133857879 \tabularnewline
Sum Squared Residuals & 244.664093567251 \tabularnewline
\hline
\end{tabular}
%Source: https://freestatistics.org/blog/index.php?pk=25560&T=3

[TABLE]
[ROW][C]Multiple Linear Regression - Regression Statistics[/C][/ROW]
[ROW][C]Multiple R[/C][C]0.220833767021393[/C][/ROW]
[ROW][C]R-squared[/C][C]0.0487675526568587[/C][/ROW]
[ROW][C]Adjusted R-squared[/C][C]0.0380795476305312[/C][/ROW]
[ROW][C]F-TEST (value)[/C][C]4.56283025098988[/C][/ROW]
[ROW][C]F-TEST (DF numerator)[/C][C]1[/C][/ROW]
[ROW][C]F-TEST (DF denominator)[/C][C]89[/C][/ROW]
[ROW][C]p-value[/C][C]0.0354183230423479[/C][/ROW]
[ROW][C]Multiple Linear Regression - Residual Statistics[/C][/ROW]
[ROW][C]Residual Standard Deviation[/C][C]1.65802133857879[/C][/ROW]
[ROW][C]Sum Squared Residuals[/C][C]244.664093567251[/C][/ROW]
[/TABLE]
Source: https://freestatistics.org/blog/index.php?pk=25560&T=3

Globally Unique Identifier (entire table): ba.freestatistics.org/blog/index.php?pk=25560&T=3

As an alternative you can also use a QR Code:  

The GUIDs for individual cells are displayed in the table below:

Multiple Linear Regression - Regression Statistics
Multiple R0.220833767021393
R-squared0.0487675526568587
Adjusted R-squared0.0380795476305312
F-TEST (value)4.56283025098988
F-TEST (DF numerator)1
F-TEST (DF denominator)89
p-value0.0354183230423479
Multiple Linear Regression - Residual Statistics
Residual Standard Deviation1.65802133857879
Sum Squared Residuals244.664093567251


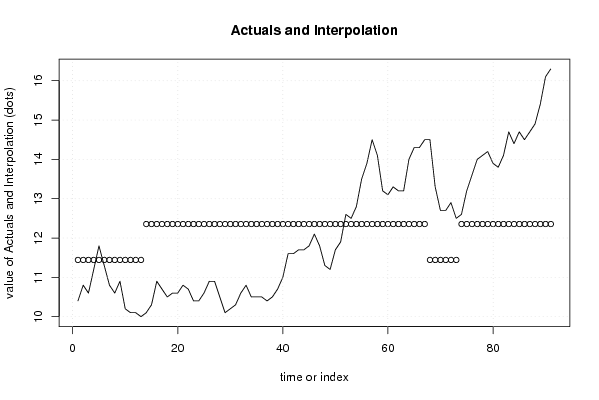
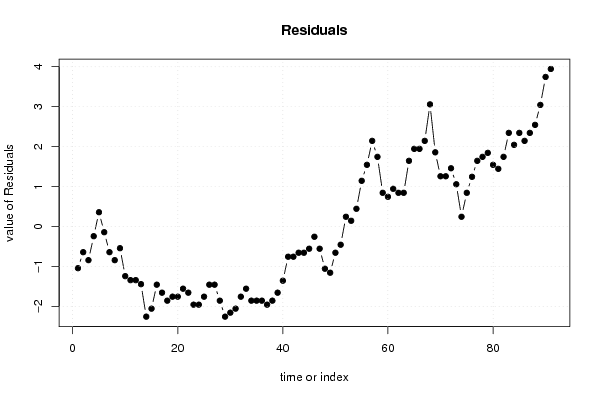
Multiple Linear Regression - Actuals, Interpolation, and Residuals
Time or IndexActualsInterpolationForecastResidualsPrediction Error
110.411.4421052631579-1.04210526315786
210.811.4421052631579-0.642105263157902
310.611.4421052631579-0.842105263157897
411.211.4421052631579-0.242105263157898
511.811.44210526315790.357894736842104
611.311.4421052631579-0.142105263157896
710.811.4421052631579-0.642105263157896
810.611.4421052631579-0.842105263157897
910.911.4421052631579-0.542105263157896
1010.211.4421052631579-1.24210526315790
1110.111.4421052631579-1.34210526315790
1210.111.4421052631579-1.34210526315790
131011.4421052631579-1.44210526315790
1410.112.3555555555556-2.25555555555556
1510.312.3555555555556-2.05555555555555
1610.912.3555555555556-1.45555555555556
1710.712.3555555555556-1.65555555555556
1810.512.3555555555556-1.85555555555556
1910.612.3555555555556-1.75555555555556
2010.612.3555555555556-1.75555555555556
2110.812.3555555555556-1.55555555555555
2210.712.3555555555556-1.65555555555556
2310.412.3555555555556-1.95555555555556
2410.412.3555555555556-1.95555555555556
2510.612.3555555555556-1.75555555555556
2610.912.3555555555556-1.45555555555556
2710.912.3555555555556-1.45555555555556
2810.512.3555555555556-1.85555555555556
2910.112.3555555555556-2.25555555555556
3010.212.3555555555556-2.15555555555556
3110.312.3555555555556-2.05555555555555
3210.612.3555555555556-1.75555555555556
3310.812.3555555555556-1.55555555555555
3410.512.3555555555556-1.85555555555556
3510.512.3555555555556-1.85555555555556
3610.512.3555555555556-1.85555555555556
3710.412.3555555555556-1.95555555555556
3810.512.3555555555556-1.85555555555556
3910.712.3555555555556-1.65555555555556
401112.3555555555556-1.35555555555556
4111.612.3555555555556-0.755555555555556
4211.612.3555555555556-0.755555555555556
4311.712.3555555555556-0.655555555555556
4411.712.3555555555556-0.655555555555556
4511.812.3555555555556-0.555555555555555
4612.112.3555555555556-0.255555555555556
4711.812.3555555555556-0.555555555555555
4811.312.3555555555556-1.05555555555555
4911.212.3555555555556-1.15555555555556
5011.712.3555555555556-0.655555555555556
5111.912.3555555555556-0.455555555555555
5212.612.35555555555560.244444444444444
5312.512.35555555555560.144444444444445
5412.812.35555555555560.444444444444445
5513.512.35555555555561.14444444444444
5613.912.35555555555561.54444444444444
5714.512.35555555555562.14444444444444
5814.112.35555555555561.74444444444444
5913.212.35555555555560.844444444444444
6013.112.35555555555560.744444444444444
6113.312.35555555555560.944444444444445
6213.212.35555555555560.844444444444444
6313.212.35555555555560.844444444444444
641412.35555555555561.64444444444444
6514.312.35555555555561.94444444444444
6614.312.35555555555561.94444444444444
6714.512.35555555555562.14444444444444
6814.511.44210526315793.0578947368421
6913.311.44210526315791.85789473684210
7012.711.44210526315791.25789473684210
7112.711.44210526315791.25789473684210
7212.911.44210526315791.45789473684210
7312.511.44210526315791.05789473684210
7412.612.35555555555560.244444444444444
7513.212.35555555555560.844444444444444
7613.612.35555555555561.24444444444444
771412.35555555555561.64444444444444
7814.112.35555555555561.74444444444444
7914.212.35555555555561.84444444444444
8013.912.35555555555561.54444444444444
8113.812.35555555555561.44444444444445
8214.112.35555555555561.74444444444444
8314.712.35555555555562.34444444444444
8414.412.35555555555562.04444444444444
8514.712.35555555555562.34444444444444
8614.512.35555555555562.14444444444444
8714.712.35555555555562.34444444444444
8814.912.35555555555562.54444444444444
8915.412.35555555555563.04444444444444
9016.112.35555555555563.74444444444445
9116.312.35555555555563.94444444444445

\begin{tabular}{lllllllll}
\hline
Multiple Linear Regression - Actuals, Interpolation, and Residuals \tabularnewline
Time or Index & Actuals & InterpolationForecast & ResidualsPrediction Error \tabularnewline
1 & 10.4 & 11.4421052631579 & -1.04210526315786 \tabularnewline
2 & 10.8 & 11.4421052631579 & -0.642105263157902 \tabularnewline
3 & 10.6 & 11.4421052631579 & -0.842105263157897 \tabularnewline
4 & 11.2 & 11.4421052631579 & -0.242105263157898 \tabularnewline
5 & 11.8 & 11.4421052631579 & 0.357894736842104 \tabularnewline
6 & 11.3 & 11.4421052631579 & -0.142105263157896 \tabularnewline
7 & 10.8 & 11.4421052631579 & -0.642105263157896 \tabularnewline
8 & 10.6 & 11.4421052631579 & -0.842105263157897 \tabularnewline
9 & 10.9 & 11.4421052631579 & -0.542105263157896 \tabularnewline
10 & 10.2 & 11.4421052631579 & -1.24210526315790 \tabularnewline
11 & 10.1 & 11.4421052631579 & -1.34210526315790 \tabularnewline
12 & 10.1 & 11.4421052631579 & -1.34210526315790 \tabularnewline
13 & 10 & 11.4421052631579 & -1.44210526315790 \tabularnewline
14 & 10.1 & 12.3555555555556 & -2.25555555555556 \tabularnewline
15 & 10.3 & 12.3555555555556 & -2.05555555555555 \tabularnewline
16 & 10.9 & 12.3555555555556 & -1.45555555555556 \tabularnewline
17 & 10.7 & 12.3555555555556 & -1.65555555555556 \tabularnewline
18 & 10.5 & 12.3555555555556 & -1.85555555555556 \tabularnewline
19 & 10.6 & 12.3555555555556 & -1.75555555555556 \tabularnewline
20 & 10.6 & 12.3555555555556 & -1.75555555555556 \tabularnewline
21 & 10.8 & 12.3555555555556 & -1.55555555555555 \tabularnewline
22 & 10.7 & 12.3555555555556 & -1.65555555555556 \tabularnewline
23 & 10.4 & 12.3555555555556 & -1.95555555555556 \tabularnewline
24 & 10.4 & 12.3555555555556 & -1.95555555555556 \tabularnewline
25 & 10.6 & 12.3555555555556 & -1.75555555555556 \tabularnewline
26 & 10.9 & 12.3555555555556 & -1.45555555555556 \tabularnewline
27 & 10.9 & 12.3555555555556 & -1.45555555555556 \tabularnewline
28 & 10.5 & 12.3555555555556 & -1.85555555555556 \tabularnewline
29 & 10.1 & 12.3555555555556 & -2.25555555555556 \tabularnewline
30 & 10.2 & 12.3555555555556 & -2.15555555555556 \tabularnewline
31 & 10.3 & 12.3555555555556 & -2.05555555555555 \tabularnewline
32 & 10.6 & 12.3555555555556 & -1.75555555555556 \tabularnewline
33 & 10.8 & 12.3555555555556 & -1.55555555555555 \tabularnewline
34 & 10.5 & 12.3555555555556 & -1.85555555555556 \tabularnewline
35 & 10.5 & 12.3555555555556 & -1.85555555555556 \tabularnewline
36 & 10.5 & 12.3555555555556 & -1.85555555555556 \tabularnewline
37 & 10.4 & 12.3555555555556 & -1.95555555555556 \tabularnewline
38 & 10.5 & 12.3555555555556 & -1.85555555555556 \tabularnewline
39 & 10.7 & 12.3555555555556 & -1.65555555555556 \tabularnewline
40 & 11 & 12.3555555555556 & -1.35555555555556 \tabularnewline
41 & 11.6 & 12.3555555555556 & -0.755555555555556 \tabularnewline
42 & 11.6 & 12.3555555555556 & -0.755555555555556 \tabularnewline
43 & 11.7 & 12.3555555555556 & -0.655555555555556 \tabularnewline
44 & 11.7 & 12.3555555555556 & -0.655555555555556 \tabularnewline
45 & 11.8 & 12.3555555555556 & -0.555555555555555 \tabularnewline
46 & 12.1 & 12.3555555555556 & -0.255555555555556 \tabularnewline
47 & 11.8 & 12.3555555555556 & -0.555555555555555 \tabularnewline
48 & 11.3 & 12.3555555555556 & -1.05555555555555 \tabularnewline
49 & 11.2 & 12.3555555555556 & -1.15555555555556 \tabularnewline
50 & 11.7 & 12.3555555555556 & -0.655555555555556 \tabularnewline
51 & 11.9 & 12.3555555555556 & -0.455555555555555 \tabularnewline
52 & 12.6 & 12.3555555555556 & 0.244444444444444 \tabularnewline
53 & 12.5 & 12.3555555555556 & 0.144444444444445 \tabularnewline
54 & 12.8 & 12.3555555555556 & 0.444444444444445 \tabularnewline
55 & 13.5 & 12.3555555555556 & 1.14444444444444 \tabularnewline
56 & 13.9 & 12.3555555555556 & 1.54444444444444 \tabularnewline
57 & 14.5 & 12.3555555555556 & 2.14444444444444 \tabularnewline
58 & 14.1 & 12.3555555555556 & 1.74444444444444 \tabularnewline
59 & 13.2 & 12.3555555555556 & 0.844444444444444 \tabularnewline
60 & 13.1 & 12.3555555555556 & 0.744444444444444 \tabularnewline
61 & 13.3 & 12.3555555555556 & 0.944444444444445 \tabularnewline
62 & 13.2 & 12.3555555555556 & 0.844444444444444 \tabularnewline
63 & 13.2 & 12.3555555555556 & 0.844444444444444 \tabularnewline
64 & 14 & 12.3555555555556 & 1.64444444444444 \tabularnewline
65 & 14.3 & 12.3555555555556 & 1.94444444444444 \tabularnewline
66 & 14.3 & 12.3555555555556 & 1.94444444444444 \tabularnewline
67 & 14.5 & 12.3555555555556 & 2.14444444444444 \tabularnewline
68 & 14.5 & 11.4421052631579 & 3.0578947368421 \tabularnewline
69 & 13.3 & 11.4421052631579 & 1.85789473684210 \tabularnewline
70 & 12.7 & 11.4421052631579 & 1.25789473684210 \tabularnewline
71 & 12.7 & 11.4421052631579 & 1.25789473684210 \tabularnewline
72 & 12.9 & 11.4421052631579 & 1.45789473684210 \tabularnewline
73 & 12.5 & 11.4421052631579 & 1.05789473684210 \tabularnewline
74 & 12.6 & 12.3555555555556 & 0.244444444444444 \tabularnewline
75 & 13.2 & 12.3555555555556 & 0.844444444444444 \tabularnewline
76 & 13.6 & 12.3555555555556 & 1.24444444444444 \tabularnewline
77 & 14 & 12.3555555555556 & 1.64444444444444 \tabularnewline
78 & 14.1 & 12.3555555555556 & 1.74444444444444 \tabularnewline
79 & 14.2 & 12.3555555555556 & 1.84444444444444 \tabularnewline
80 & 13.9 & 12.3555555555556 & 1.54444444444444 \tabularnewline
81 & 13.8 & 12.3555555555556 & 1.44444444444445 \tabularnewline
82 & 14.1 & 12.3555555555556 & 1.74444444444444 \tabularnewline
83 & 14.7 & 12.3555555555556 & 2.34444444444444 \tabularnewline
84 & 14.4 & 12.3555555555556 & 2.04444444444444 \tabularnewline
85 & 14.7 & 12.3555555555556 & 2.34444444444444 \tabularnewline
86 & 14.5 & 12.3555555555556 & 2.14444444444444 \tabularnewline
87 & 14.7 & 12.3555555555556 & 2.34444444444444 \tabularnewline
88 & 14.9 & 12.3555555555556 & 2.54444444444444 \tabularnewline
89 & 15.4 & 12.3555555555556 & 3.04444444444444 \tabularnewline
90 & 16.1 & 12.3555555555556 & 3.74444444444445 \tabularnewline
91 & 16.3 & 12.3555555555556 & 3.94444444444445 \tabularnewline
\hline
\end{tabular}
%Source: https://freestatistics.org/blog/index.php?pk=25560&T=4

[TABLE]
[ROW][C]Multiple Linear Regression - Actuals, Interpolation, and Residuals[/C][/ROW]
[ROW][C]Time or Index[/C][C]Actuals[/C][C]InterpolationForecast[/C][C]ResidualsPrediction Error[/C][/ROW]
[ROW][C]1[/C][C]10.4[/C][C]11.4421052631579[/C][C]-1.04210526315786[/C][/ROW]
[ROW][C]2[/C][C]10.8[/C][C]11.4421052631579[/C][C]-0.642105263157902[/C][/ROW]
[ROW][C]3[/C][C]10.6[/C][C]11.4421052631579[/C][C]-0.842105263157897[/C][/ROW]
[ROW][C]4[/C][C]11.2[/C][C]11.4421052631579[/C][C]-0.242105263157898[/C][/ROW]
[ROW][C]5[/C][C]11.8[/C][C]11.4421052631579[/C][C]0.357894736842104[/C][/ROW]
[ROW][C]6[/C][C]11.3[/C][C]11.4421052631579[/C][C]-0.142105263157896[/C][/ROW]
[ROW][C]7[/C][C]10.8[/C][C]11.4421052631579[/C][C]-0.642105263157896[/C][/ROW]
[ROW][C]8[/C][C]10.6[/C][C]11.4421052631579[/C][C]-0.842105263157897[/C][/ROW]
[ROW][C]9[/C][C]10.9[/C][C]11.4421052631579[/C][C]-0.542105263157896[/C][/ROW]
[ROW][C]10[/C][C]10.2[/C][C]11.4421052631579[/C][C]-1.24210526315790[/C][/ROW]
[ROW][C]11[/C][C]10.1[/C][C]11.4421052631579[/C][C]-1.34210526315790[/C][/ROW]
[ROW][C]12[/C][C]10.1[/C][C]11.4421052631579[/C][C]-1.34210526315790[/C][/ROW]
[ROW][C]13[/C][C]10[/C][C]11.4421052631579[/C][C]-1.44210526315790[/C][/ROW]
[ROW][C]14[/C][C]10.1[/C][C]12.3555555555556[/C][C]-2.25555555555556[/C][/ROW]
[ROW][C]15[/C][C]10.3[/C][C]12.3555555555556[/C][C]-2.05555555555555[/C][/ROW]
[ROW][C]16[/C][C]10.9[/C][C]12.3555555555556[/C][C]-1.45555555555556[/C][/ROW]
[ROW][C]17[/C][C]10.7[/C][C]12.3555555555556[/C][C]-1.65555555555556[/C][/ROW]
[ROW][C]18[/C][C]10.5[/C][C]12.3555555555556[/C][C]-1.85555555555556[/C][/ROW]
[ROW][C]19[/C][C]10.6[/C][C]12.3555555555556[/C][C]-1.75555555555556[/C][/ROW]
[ROW][C]20[/C][C]10.6[/C][C]12.3555555555556[/C][C]-1.75555555555556[/C][/ROW]
[ROW][C]21[/C][C]10.8[/C][C]12.3555555555556[/C][C]-1.55555555555555[/C][/ROW]
[ROW][C]22[/C][C]10.7[/C][C]12.3555555555556[/C][C]-1.65555555555556[/C][/ROW]
[ROW][C]23[/C][C]10.4[/C][C]12.3555555555556[/C][C]-1.95555555555556[/C][/ROW]
[ROW][C]24[/C][C]10.4[/C][C]12.3555555555556[/C][C]-1.95555555555556[/C][/ROW]
[ROW][C]25[/C][C]10.6[/C][C]12.3555555555556[/C][C]-1.75555555555556[/C][/ROW]
[ROW][C]26[/C][C]10.9[/C][C]12.3555555555556[/C][C]-1.45555555555556[/C][/ROW]
[ROW][C]27[/C][C]10.9[/C][C]12.3555555555556[/C][C]-1.45555555555556[/C][/ROW]
[ROW][C]28[/C][C]10.5[/C][C]12.3555555555556[/C][C]-1.85555555555556[/C][/ROW]
[ROW][C]29[/C][C]10.1[/C][C]12.3555555555556[/C][C]-2.25555555555556[/C][/ROW]
[ROW][C]30[/C][C]10.2[/C][C]12.3555555555556[/C][C]-2.15555555555556[/C][/ROW]
[ROW][C]31[/C][C]10.3[/C][C]12.3555555555556[/C][C]-2.05555555555555[/C][/ROW]
[ROW][C]32[/C][C]10.6[/C][C]12.3555555555556[/C][C]-1.75555555555556[/C][/ROW]
[ROW][C]33[/C][C]10.8[/C][C]12.3555555555556[/C][C]-1.55555555555555[/C][/ROW]
[ROW][C]34[/C][C]10.5[/C][C]12.3555555555556[/C][C]-1.85555555555556[/C][/ROW]
[ROW][C]35[/C][C]10.5[/C][C]12.3555555555556[/C][C]-1.85555555555556[/C][/ROW]
[ROW][C]36[/C][C]10.5[/C][C]12.3555555555556[/C][C]-1.85555555555556[/C][/ROW]
[ROW][C]37[/C][C]10.4[/C][C]12.3555555555556[/C][C]-1.95555555555556[/C][/ROW]
[ROW][C]38[/C][C]10.5[/C][C]12.3555555555556[/C][C]-1.85555555555556[/C][/ROW]
[ROW][C]39[/C][C]10.7[/C][C]12.3555555555556[/C][C]-1.65555555555556[/C][/ROW]
[ROW][C]40[/C][C]11[/C][C]12.3555555555556[/C][C]-1.35555555555556[/C][/ROW]
[ROW][C]41[/C][C]11.6[/C][C]12.3555555555556[/C][C]-0.755555555555556[/C][/ROW]
[ROW][C]42[/C][C]11.6[/C][C]12.3555555555556[/C][C]-0.755555555555556[/C][/ROW]
[ROW][C]43[/C][C]11.7[/C][C]12.3555555555556[/C][C]-0.655555555555556[/C][/ROW]
[ROW][C]44[/C][C]11.7[/C][C]12.3555555555556[/C][C]-0.655555555555556[/C][/ROW]
[ROW][C]45[/C][C]11.8[/C][C]12.3555555555556[/C][C]-0.555555555555555[/C][/ROW]
[ROW][C]46[/C][C]12.1[/C][C]12.3555555555556[/C][C]-0.255555555555556[/C][/ROW]
[ROW][C]47[/C][C]11.8[/C][C]12.3555555555556[/C][C]-0.555555555555555[/C][/ROW]
[ROW][C]48[/C][C]11.3[/C][C]12.3555555555556[/C][C]-1.05555555555555[/C][/ROW]
[ROW][C]49[/C][C]11.2[/C][C]12.3555555555556[/C][C]-1.15555555555556[/C][/ROW]
[ROW][C]50[/C][C]11.7[/C][C]12.3555555555556[/C][C]-0.655555555555556[/C][/ROW]
[ROW][C]51[/C][C]11.9[/C][C]12.3555555555556[/C][C]-0.455555555555555[/C][/ROW]
[ROW][C]52[/C][C]12.6[/C][C]12.3555555555556[/C][C]0.244444444444444[/C][/ROW]
[ROW][C]53[/C][C]12.5[/C][C]12.3555555555556[/C][C]0.144444444444445[/C][/ROW]
[ROW][C]54[/C][C]12.8[/C][C]12.3555555555556[/C][C]0.444444444444445[/C][/ROW]
[ROW][C]55[/C][C]13.5[/C][C]12.3555555555556[/C][C]1.14444444444444[/C][/ROW]
[ROW][C]56[/C][C]13.9[/C][C]12.3555555555556[/C][C]1.54444444444444[/C][/ROW]
[ROW][C]57[/C][C]14.5[/C][C]12.3555555555556[/C][C]2.14444444444444[/C][/ROW]
[ROW][C]58[/C][C]14.1[/C][C]12.3555555555556[/C][C]1.74444444444444[/C][/ROW]
[ROW][C]59[/C][C]13.2[/C][C]12.3555555555556[/C][C]0.844444444444444[/C][/ROW]
[ROW][C]60[/C][C]13.1[/C][C]12.3555555555556[/C][C]0.744444444444444[/C][/ROW]
[ROW][C]61[/C][C]13.3[/C][C]12.3555555555556[/C][C]0.944444444444445[/C][/ROW]
[ROW][C]62[/C][C]13.2[/C][C]12.3555555555556[/C][C]0.844444444444444[/C][/ROW]
[ROW][C]63[/C][C]13.2[/C][C]12.3555555555556[/C][C]0.844444444444444[/C][/ROW]
[ROW][C]64[/C][C]14[/C][C]12.3555555555556[/C][C]1.64444444444444[/C][/ROW]
[ROW][C]65[/C][C]14.3[/C][C]12.3555555555556[/C][C]1.94444444444444[/C][/ROW]
[ROW][C]66[/C][C]14.3[/C][C]12.3555555555556[/C][C]1.94444444444444[/C][/ROW]
[ROW][C]67[/C][C]14.5[/C][C]12.3555555555556[/C][C]2.14444444444444[/C][/ROW]
[ROW][C]68[/C][C]14.5[/C][C]11.4421052631579[/C][C]3.0578947368421[/C][/ROW]
[ROW][C]69[/C][C]13.3[/C][C]11.4421052631579[/C][C]1.85789473684210[/C][/ROW]
[ROW][C]70[/C][C]12.7[/C][C]11.4421052631579[/C][C]1.25789473684210[/C][/ROW]
[ROW][C]71[/C][C]12.7[/C][C]11.4421052631579[/C][C]1.25789473684210[/C][/ROW]
[ROW][C]72[/C][C]12.9[/C][C]11.4421052631579[/C][C]1.45789473684210[/C][/ROW]
[ROW][C]73[/C][C]12.5[/C][C]11.4421052631579[/C][C]1.05789473684210[/C][/ROW]
[ROW][C]74[/C][C]12.6[/C][C]12.3555555555556[/C][C]0.244444444444444[/C][/ROW]
[ROW][C]75[/C][C]13.2[/C][C]12.3555555555556[/C][C]0.844444444444444[/C][/ROW]
[ROW][C]76[/C][C]13.6[/C][C]12.3555555555556[/C][C]1.24444444444444[/C][/ROW]
[ROW][C]77[/C][C]14[/C][C]12.3555555555556[/C][C]1.64444444444444[/C][/ROW]
[ROW][C]78[/C][C]14.1[/C][C]12.3555555555556[/C][C]1.74444444444444[/C][/ROW]
[ROW][C]79[/C][C]14.2[/C][C]12.3555555555556[/C][C]1.84444444444444[/C][/ROW]
[ROW][C]80[/C][C]13.9[/C][C]12.3555555555556[/C][C]1.54444444444444[/C][/ROW]
[ROW][C]81[/C][C]13.8[/C][C]12.3555555555556[/C][C]1.44444444444445[/C][/ROW]
[ROW][C]82[/C][C]14.1[/C][C]12.3555555555556[/C][C]1.74444444444444[/C][/ROW]
[ROW][C]83[/C][C]14.7[/C][C]12.3555555555556[/C][C]2.34444444444444[/C][/ROW]
[ROW][C]84[/C][C]14.4[/C][C]12.3555555555556[/C][C]2.04444444444444[/C][/ROW]
[ROW][C]85[/C][C]14.7[/C][C]12.3555555555556[/C][C]2.34444444444444[/C][/ROW]
[ROW][C]86[/C][C]14.5[/C][C]12.3555555555556[/C][C]2.14444444444444[/C][/ROW]
[ROW][C]87[/C][C]14.7[/C][C]12.3555555555556[/C][C]2.34444444444444[/C][/ROW]
[ROW][C]88[/C][C]14.9[/C][C]12.3555555555556[/C][C]2.54444444444444[/C][/ROW]
[ROW][C]89[/C][C]15.4[/C][C]12.3555555555556[/C][C]3.04444444444444[/C][/ROW]
[ROW][C]90[/C][C]16.1[/C][C]12.3555555555556[/C][C]3.74444444444445[/C][/ROW]
[ROW][C]91[/C][C]16.3[/C][C]12.3555555555556[/C][C]3.94444444444445[/C][/ROW]
[/TABLE]
Source: https://freestatistics.org/blog/index.php?pk=25560&T=4

Globally Unique Identifier (entire table): ba.freestatistics.org/blog/index.php?pk=25560&T=4

As an alternative you can also use a QR Code:  

The GUIDs for individual cells are displayed in the table below:

Multiple Linear Regression - Actuals, Interpolation, and Residuals
Time or IndexActualsInterpolationForecastResidualsPrediction Error
110.411.4421052631579-1.04210526315786
210.811.4421052631579-0.642105263157902
310.611.4421052631579-0.842105263157897
411.211.4421052631579-0.242105263157898
511.811.44210526315790.357894736842104
611.311.4421052631579-0.142105263157896
710.811.4421052631579-0.642105263157896
810.611.4421052631579-0.842105263157897
910.911.4421052631579-0.542105263157896
1010.211.4421052631579-1.24210526315790
1110.111.4421052631579-1.34210526315790
1210.111.4421052631579-1.34210526315790
131011.4421052631579-1.44210526315790
1410.112.3555555555556-2.25555555555556
1510.312.3555555555556-2.05555555555555
1610.912.3555555555556-1.45555555555556
1710.712.3555555555556-1.65555555555556
1810.512.3555555555556-1.85555555555556
1910.612.3555555555556-1.75555555555556
2010.612.3555555555556-1.75555555555556
2110.812.3555555555556-1.55555555555555
2210.712.3555555555556-1.65555555555556
2310.412.3555555555556-1.95555555555556
2410.412.3555555555556-1.95555555555556
2510.612.3555555555556-1.75555555555556
2610.912.3555555555556-1.45555555555556
2710.912.3555555555556-1.45555555555556
2810.512.3555555555556-1.85555555555556
2910.112.3555555555556-2.25555555555556
3010.212.3555555555556-2.15555555555556
3110.312.3555555555556-2.05555555555555
3210.612.3555555555556-1.75555555555556
3310.812.3555555555556-1.55555555555555
3410.512.3555555555556-1.85555555555556
3510.512.3555555555556-1.85555555555556
3610.512.3555555555556-1.85555555555556
3710.412.3555555555556-1.95555555555556
3810.512.3555555555556-1.85555555555556
3910.712.3555555555556-1.65555555555556
401112.3555555555556-1.35555555555556
4111.612.3555555555556-0.755555555555556
4211.612.3555555555556-0.755555555555556
4311.712.3555555555556-0.655555555555556
4411.712.3555555555556-0.655555555555556
4511.812.3555555555556-0.555555555555555
4612.112.3555555555556-0.255555555555556
4711.812.3555555555556-0.555555555555555
4811.312.3555555555556-1.05555555555555
4911.212.3555555555556-1.15555555555556
5011.712.3555555555556-0.655555555555556
5111.912.3555555555556-0.455555555555555
5212.612.35555555555560.244444444444444
5312.512.35555555555560.144444444444445
5412.812.35555555555560.444444444444445
5513.512.35555555555561.14444444444444
5613.912.35555555555561.54444444444444
5714.512.35555555555562.14444444444444
5814.112.35555555555561.74444444444444
5913.212.35555555555560.844444444444444
6013.112.35555555555560.744444444444444
6113.312.35555555555560.944444444444445
6213.212.35555555555560.844444444444444
6313.212.35555555555560.844444444444444
641412.35555555555561.64444444444444
6514.312.35555555555561.94444444444444
6614.312.35555555555561.94444444444444
6714.512.35555555555562.14444444444444
6814.511.44210526315793.0578947368421
6913.311.44210526315791.85789473684210
7012.711.44210526315791.25789473684210
7112.711.44210526315791.25789473684210
7212.911.44210526315791.45789473684210
7312.511.44210526315791.05789473684210
7412.612.35555555555560.244444444444444
7513.212.35555555555560.844444444444444
7613.612.35555555555561.24444444444444
771412.35555555555561.64444444444444
7814.112.35555555555561.74444444444444
7914.212.35555555555561.84444444444444
8013.912.35555555555561.54444444444444
8113.812.35555555555561.44444444444445
8214.112.35555555555561.74444444444444
8314.712.35555555555562.34444444444444
8414.412.35555555555562.04444444444444
8514.712.35555555555562.34444444444444
8614.512.35555555555562.14444444444444
8714.712.35555555555562.34444444444444
8814.912.35555555555562.54444444444444
8915.412.35555555555563.04444444444444
9016.112.35555555555563.74444444444445
9116.312.35555555555563.94444444444445


Parameters (Session):
par1 = 1 ; par2 = Do not include Seasonal Dummies ; par3 = No Linear Trend ;
Parameters (R input):
par1 = 1 ; par2 = Do not include Seasonal Dummies ; par3 = No Linear Trend ;
R code (references can be found in the software module):
library(lattice)
par1 <- as.numeric(par1)
x <- t(y)
k <- length(x[1,])
n <- length(x[,1])
x1 <- cbind(x[,par1], x[,1:k!=par1])
mycolnames <- c(colnames(x)[par1], colnames(x)[1:k!=par1])
colnames(x1) <- mycolnames #colnames(x)[par1]
x <- x1
if (par3 == 'First Differences'){
x2 <- array(0, dim=c(n-1,k), dimnames=list(1:(n-1), paste('(1-B)',colnames(x),sep='')))
for (i in 1:n-1) {
for (j in 1:k) {
x2[i,j] <- x[i+1,j] - x[i,j]
}
}
x <- x2
}
if (par2 == 'Include Monthly Dummies'){
x2 <- array(0, dim=c(n,11), dimnames=list(1:n, paste('M', seq(1:11), sep ='')))
for (i in 1:11){
x2[seq(i,n,12),i] <- 1
}
x <- cbind(x, x2)
}
if (par2 == 'Include Quarterly Dummies'){
x2 <- array(0, dim=c(n,3), dimnames=list(1:n, paste('Q', seq(1:3), sep ='')))
for (i in 1:3){
x2[seq(i,n,4),i] <- 1
}
x <- cbind(x, x2)
}
k <- length(x[1,])
if (par3 == 'Linear Trend'){
x <- cbind(x, c(1:n))
colnames(x)[k+1] <- 't'
}
x
k <- length(x[1,])
df <- as.data.frame(x)
(mylm <- lm(df))
(mysum <- summary(mylm))
bitmap(file='test0.png')
plot(x[,1], type='l', main='Actuals and Interpolation', ylab='value of Actuals and Interpolation (dots)', xlab='time or index')
points(x[,1]-mysum$resid)
grid()
dev.off()
bitmap(file='test1.png')
plot(mysum$resid, type='b', pch=19, main='Residuals', ylab='value of Residuals', xlab='time or index')
grid()
dev.off()
bitmap(file='test2.png')
hist(mysum$resid, main='Residual Histogram', xlab='values of Residuals')
grid()
dev.off()
bitmap(file='test3.png')
densityplot(~mysum$resid,col='black',main='Residual Density Plot', xlab='values of Residuals')
dev.off()
bitmap(file='test4.png')
qqnorm(mysum$resid, main='Residual Normal Q-Q Plot')
grid()
dev.off()
(myerror <- as.ts(mysum$resid))
bitmap(file='test5.png')
dum <- cbind(lag(myerror,k=1),myerror)
dum
dum1 <- dum[2:length(myerror),]
dum1
z <- as.data.frame(dum1)
z
plot(z,main=paste('Residual Lag plot, lowess, and regression line'), ylab='values of Residuals', xlab='lagged values of Residuals')
lines(lowess(z))
abline(lm(z))
grid()
dev.off()
bitmap(file='test6.png')
acf(mysum$resid, lag.max=length(mysum$resid)/2, main='Residual Autocorrelation Function')
grid()
dev.off()
bitmap(file='test7.png')
pacf(mysum$resid, lag.max=length(mysum$resid)/2, main='Residual Partial Autocorrelation Function')
grid()
dev.off()
bitmap(file='test8.png')
opar <- par(mfrow = c(2,2), oma = c(0, 0, 1.1, 0))
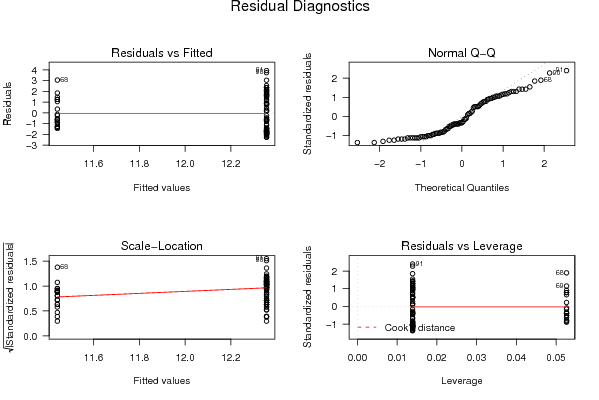
plot(mylm, las = 1, sub='Residual Diagnostics')
par(opar)
dev.off()
load(file='createtable')
a<-table.start()
a<-table.row.start(a)
a<-table.element(a, 'Multiple Linear Regression - Estimated Regression Equation', 1, TRUE)
a<-table.row.end(a)
myeq <- colnames(x)[1]
myeq <- paste(myeq, '[t] = ', sep='')
for (i in 1:k){
if (mysum$coefficients[i,1] > 0) myeq <- paste(myeq, '+', '')
myeq <- paste(myeq, mysum$coefficients[i,1], sep=' ')
if (rownames(mysum$coefficients)[i] != '(Intercept)') {
myeq <- paste(myeq, rownames(mysum$coefficients)[i], sep='')
if (rownames(mysum$coefficients)[i] != 't') myeq <- paste(myeq, '[t]', sep='')
}
}
myeq <- paste(myeq, ' + e[t]')
a<-table.row.start(a)
a<-table.element(a, myeq)
a<-table.row.end(a)
a<-table.end(a)
table.save(a,file='mytable1.tab')
a<-table.start()
a<-table.row.start(a)
a<-table.element(a,hyperlink('ols1.htm','Multiple Linear Regression - Ordinary Least Squares',''), 6, TRUE)
a<-table.row.end(a)
a<-table.row.start(a)
a<-table.element(a,'Variable',header=TRUE)
a<-table.element(a,'Parameter',header=TRUE)
a<-table.element(a,'S.D.',header=TRUE)
a<-table.element(a,'T-STAT
H0: parameter = 0',header=TRUE)
a<-table.element(a,'2-tail p-value',header=TRUE)
a<-table.element(a,'1-tail p-value',header=TRUE)
a<-table.row.end(a)
for (i in 1:k){
a<-table.row.start(a)
a<-table.element(a,rownames(mysum$coefficients)[i],header=TRUE)
a<-table.element(a,mysum$coefficients[i,1])
a<-table.element(a, round(mysum$coefficients[i,2],6))
a<-table.element(a, round(mysum$coefficients[i,3],4))
a<-table.element(a, round(mysum$coefficients[i,4],6))
a<-table.element(a, round(mysum$coefficients[i,4]/2,6))
a<-table.row.end(a)
}
a<-table.end(a)
table.save(a,file='mytable2.tab')
a<-table.start()
a<-table.row.start(a)
a<-table.element(a, 'Multiple Linear Regression - Regression Statistics', 2, TRUE)
a<-table.row.end(a)
a<-table.row.start(a)
a<-table.element(a, 'Multiple R',1,TRUE)
a<-table.element(a, sqrt(mysum$r.squared))
a<-table.row.end(a)
a<-table.row.start(a)
a<-table.element(a, 'R-squared',1,TRUE)
a<-table.element(a, mysum$r.squared)
a<-table.row.end(a)
a<-table.row.start(a)
a<-table.element(a, 'Adjusted R-squared',1,TRUE)
a<-table.element(a, mysum$adj.r.squared)
a<-table.row.end(a)
a<-table.row.start(a)
a<-table.element(a, 'F-TEST (value)',1,TRUE)
a<-table.element(a, mysum$fstatistic[1])
a<-table.row.end(a)
a<-table.row.start(a)
a<-table.element(a, 'F-TEST (DF numerator)',1,TRUE)
a<-table.element(a, mysum$fstatistic[2])
a<-table.row.end(a)
a<-table.row.start(a)
a<-table.element(a, 'F-TEST (DF denominator)',1,TRUE)
a<-table.element(a, mysum$fstatistic[3])
a<-table.row.end(a)
a<-table.row.start(a)
a<-table.element(a, 'p-value',1,TRUE)
a<-table.element(a, 1-pf(mysum$fstatistic[1],mysum$fstatistic[2],mysum$fstatistic[3]))
a<-table.row.end(a)
a<-table.row.start(a)
a<-table.element(a, 'Multiple Linear Regression - Residual Statistics', 2, TRUE)
a<-table.row.end(a)
a<-table.row.start(a)
a<-table.element(a, 'Residual Standard Deviation',1,TRUE)
a<-table.element(a, mysum$sigma)
a<-table.row.end(a)
a<-table.row.start(a)
a<-table.element(a, 'Sum Squared Residuals',1,TRUE)
a<-table.element(a, sum(myerror*myerror))
a<-table.row.end(a)
a<-table.end(a)
table.save(a,file='mytable3.tab')
a<-table.start()
a<-table.row.start(a)
a<-table.element(a, 'Multiple Linear Regression - Actuals, Interpolation, and Residuals', 4, TRUE)
a<-table.row.end(a)
a<-table.row.start(a)
a<-table.element(a, 'Time or Index', 1, TRUE)
a<-table.element(a, 'Actuals', 1, TRUE)
a<-table.element(a, 'Interpolation
Forecast', 1, TRUE)
a<-table.element(a, 'Residuals
Prediction Error', 1, TRUE)
a<-table.row.end(a)
for (i in 1:n) {
a<-table.row.start(a)
a<-table.element(a,i, 1, TRUE)
a<-table.element(a,x[i])
a<-table.element(a,x[i]-mysum$resid[i])
a<-table.element(a,mysum$resid[i])
a<-table.row.end(a)
}
a<-table.end(a)
table.save(a,file='mytable4.tab')