Free Statistics

of Irreproducible Research!

Author's title

Author*The author of this computation has been verified*
R Software Modulerwasp_multipleregression.wasp
Title produced by softwareMultiple Regression
Date of computationMon, 24 Nov 2008 15:21:37 -0700
Cite this page as followsStatistical Computations at FreeStatistics.org, Office for Research Development and Education, URL https://freestatistics.org/blog/index.php?v=date/2008/Nov/24/t1227565347wbtdkwhshnitu2u.htm/, Retrieved Tue, 14 May 2024 21:44:04 +0000
Statistical Computations at FreeStatistics.org, Office for Research Development and Education, URL https://freestatistics.org/blog/index.php?pk=25553, Retrieved Tue, 14 May 2024 21:44:04 +0000
QR Codes:

Original text written by user:
IsPrivate?No (this computation is public)
User-defined keywords
Estimated Impact170
Family? (F = Feedback message, R = changed R code, M = changed R Module, P = changed Parameters, D = changed Data)
F     [Multiple Regression] [Opdracht 6: Q1] [2008-11-23 12:33:28] [a7f04e0e73ce3683561193958d653479]
F    D    [Multiple Regression] [Opdracht 6 : Q3] [2008-11-24 22:21:37] [f1a30f1149cef3ef3ef69d586c6c3c1c] [Current]
Feedback Forum
2008-11-29 13:16:06 [Kevin Neelen] [reply
De getrokken conclusies van de studente in bijgevoegd Word-document betreffende de eerste tabel kloppen, maar er is geen enkele van de bijgevoegde grafieken in de compuation, besproken geweest wat wel spijtig is. De studente had ook eerste een model zonder dummies en lineaire trend kunnen berekenen om eventuele effecten hiervan te kunnen bestuderen.

Eerst en vooral kunnen we zien dat 20% van de schommelingen verklaard wordt. Dit is wel vrij significant aangezien de P-waarde klein is (2,79%), maar het model is zeker nog voor verbetering vatbaar.

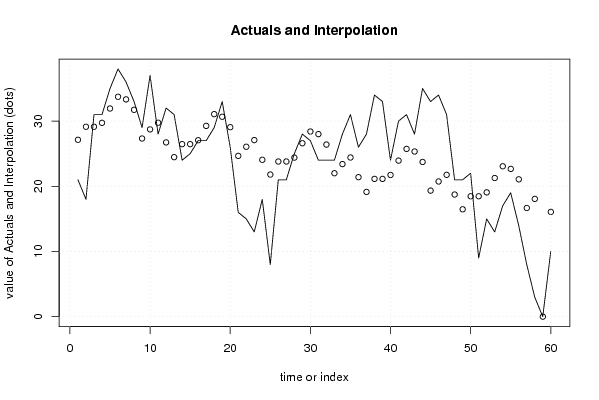
Bij de grafiek van Actuals and Interpolations zien we dat de grafiek vrij veel schommelingen kent maar over het algemeen een dalend verloop kent. Dit is logisch aangezien de economische situatie wereldwijd momenteel zeer slecht is (en dus dalend is).

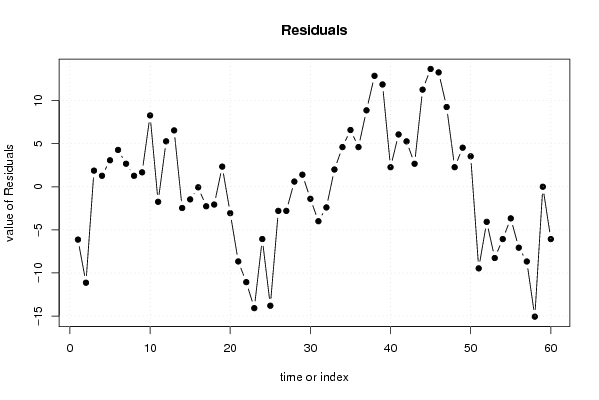
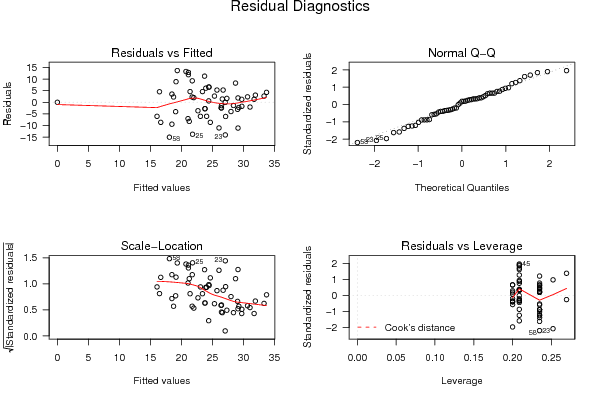
In de grafiek van de Residuals zien we dat de gemiddelde van die residuals niet direct 0 benaderen, wat eigelijk wil zeggen dat er geen sprake is van een fixed variation.

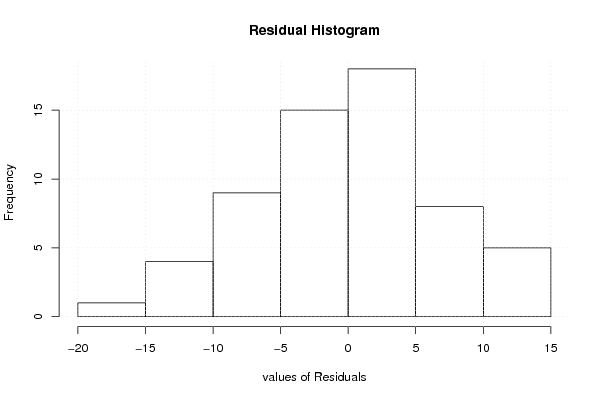
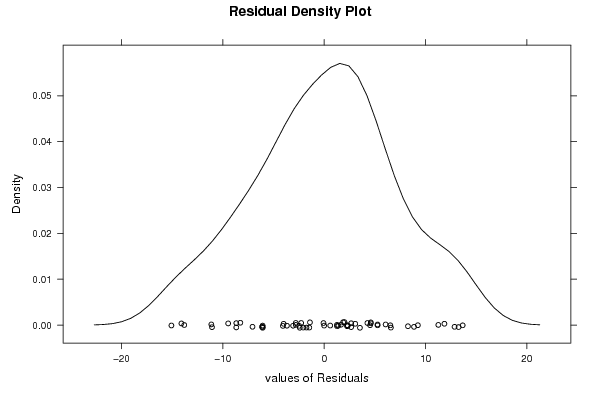
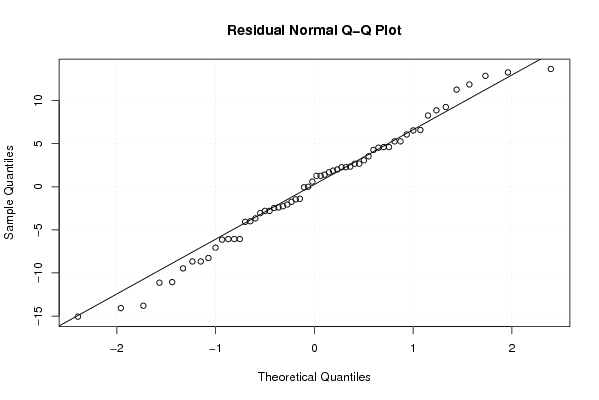
In het Residual Histogram, het Residual Density Plot en het Residual Normal QQ Plot zien we dat de gegevens bij benadering een normaalverdeling kennen.

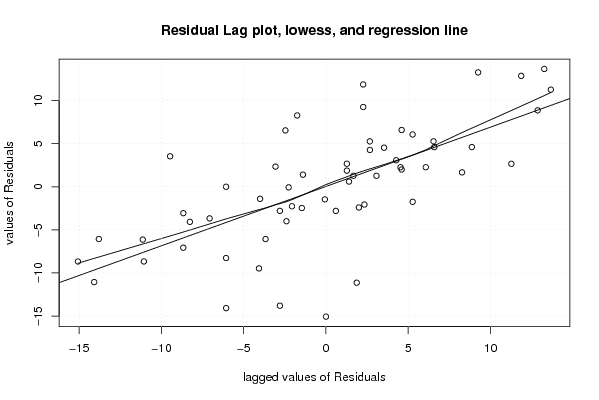
In het Residual Lag Plot kunnen we zien dat er een niet zo hoge correlatie tussen de voorspellingsfouten nu en de voorspellingsfout van de voorgaande maand voordoen.

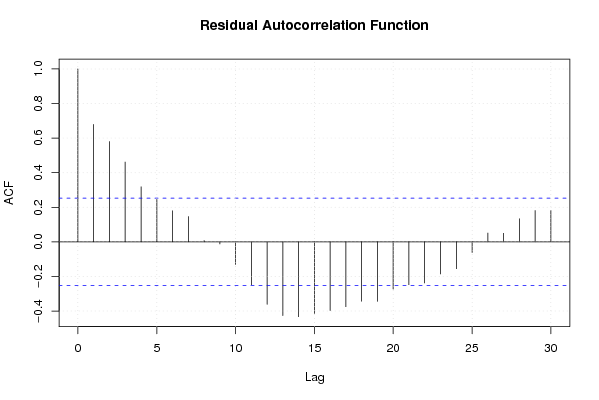
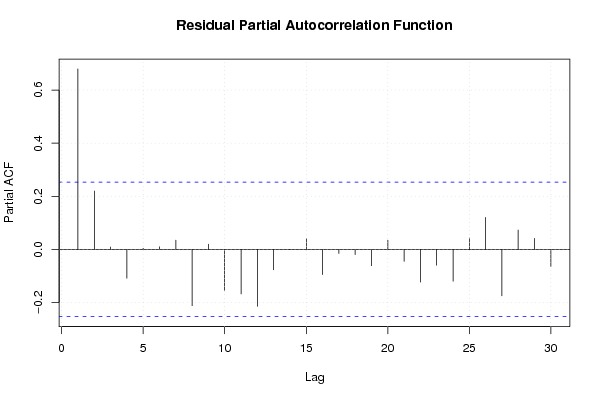
In het Residual Autocorrelation Function grafiek zien we de blauwe stippellijn. Dit stelt het 95% betrouwbaarheidsinterval voor. Alle verticale lijntjes buiten deze horizontale stippellijn zijn significant verschillend. Dit wil zeggen dat die voorspellingsfout waarschijnlijk geen toeval is. Bij een lag van 12 zien we dat de autocorrelatie buiten het interval valt, en dat er dus sprake kan zijn van toeval.
2008-11-30 23:13:19 [Isabel Wilms] [reply
De student hierboven heeft een correcte aanvulling gedaan van jouw werk. Ik zou alleen nog het besluit willen toevoegen, dit is dat niet aan alle assumpties is voldaan. En we daarom niet verder werken met dit model, het is nog aan verbetering toe. Of dit een erg spijtige zaak is, weet ik niet omdat er slechts 38% van de schommelingen kon verklaard worden aan de hand van dit model.
2008-12-01 21:02:19 [Yara Van Overstraeten] [reply
Ik had inderdaad nog een meer uitgebreidere analyse moeten maken van mijn eigen tijdreeksen. Dankjewel Kevin voor de uitgebreide feedback!

Post a new message
Dataseries X:
21	0
18	0
31	0
31	0
35	0
38	0
36	0
33	0
29	0
37	0
28	0
32	0
31	0
24	0
25	0
27	0
27	0
29	0
33	0
26	0
16	0
15	0
13	0
18	0
8	0
21	0
21	0
25	0
28	0
27	0
24	0
24	0
24	0
28	0
31	0
26	0
28	0
34	0
33	0
24	0
30	0
31	0
28	0
35	0
33	0
34	0
31	0
21	0
21	0
22	0
9	0
15	0
13	0
17	0
19	0
14	0
8	0
3	0
0	1
10	0


Summary of computational transaction
Raw Inputview raw input (R code)
Raw Outputview raw output of R engine
Computing time8 seconds
R Server'George Udny Yule' @ 72.249.76.132

\begin{tabular}{lllllllll}
\hline
Summary of computational transaction \tabularnewline
Raw Input & view raw input (R code)  \tabularnewline
Raw Output & view raw output of R engine  \tabularnewline
Computing time & 8 seconds \tabularnewline
R Server & 'George Udny Yule' @ 72.249.76.132 \tabularnewline
\hline
\end{tabular}
%Source: https://freestatistics.org/blog/index.php?pk=25553&T=0

[TABLE]
[ROW][C]Summary of computational transaction[/C][/ROW]
[ROW][C]Raw Input[/C][C]view raw input (R code) [/C][/ROW]
[ROW][C]Raw Output[/C][C]view raw output of R engine [/C][/ROW]
[ROW][C]Computing time[/C][C]8 seconds[/C][/ROW]
[ROW][C]R Server[/C][C]'George Udny Yule' @ 72.249.76.132[/C][/ROW]
[/TABLE]
Source: https://freestatistics.org/blog/index.php?pk=25553&T=0

Globally Unique Identifier (entire table): ba.freestatistics.org/blog/index.php?pk=25553&T=0

As an alternative you can also use a QR Code:  

The GUIDs for individual cells are displayed in the table below:

Summary of computational transaction
Raw Inputview raw input (R code)
Raw Outputview raw output of R engine
Computing time8 seconds
R Server'George Udny Yule' @ 72.249.76.132


Multiple Linear Regression - Estimated Regression Equation
FinSit[t] = + 29.3956521739130 -19.0869565217391OntslagYvesLeterme[t] -2.04311594202898M1[t] + 0.178985507246380M2[t] + 0.401086956521736M3[t] + 1.22318840579710M4[t] + 3.64528985507247M5[t] + 5.66739130434783M6[t] + 5.48949275362319M7[t] + 4.11159420289855M8[t] -0.0663043478260841M9[t] + 1.55579710144928M10[t] + 2.79528985507246M11[t] -0.222101449275362t + e[t]

\begin{tabular}{lllllllll}
\hline
Multiple Linear Regression - Estimated Regression Equation \tabularnewline
FinSit[t] =  +  29.3956521739130 -19.0869565217391OntslagYvesLeterme[t] -2.04311594202898M1[t] +  0.178985507246380M2[t] +  0.401086956521736M3[t] +  1.22318840579710M4[t] +  3.64528985507247M5[t] +  5.66739130434783M6[t] +  5.48949275362319M7[t] +  4.11159420289855M8[t] -0.0663043478260841M9[t] +  1.55579710144928M10[t] +  2.79528985507246M11[t] -0.222101449275362t  + e[t] \tabularnewline
\hline
\end{tabular}
%Source: https://freestatistics.org/blog/index.php?pk=25553&T=1

[TABLE]
[ROW][C]Multiple Linear Regression - Estimated Regression Equation[/C][/ROW]
[ROW][C]FinSit[t] =  +  29.3956521739130 -19.0869565217391OntslagYvesLeterme[t] -2.04311594202898M1[t] +  0.178985507246380M2[t] +  0.401086956521736M3[t] +  1.22318840579710M4[t] +  3.64528985507247M5[t] +  5.66739130434783M6[t] +  5.48949275362319M7[t] +  4.11159420289855M8[t] -0.0663043478260841M9[t] +  1.55579710144928M10[t] +  2.79528985507246M11[t] -0.222101449275362t  + e[t][/C][/ROW]
[/TABLE]
Source: https://freestatistics.org/blog/index.php?pk=25553&T=1

Globally Unique Identifier (entire table): ba.freestatistics.org/blog/index.php?pk=25553&T=1

As an alternative you can also use a QR Code:  

The GUIDs for individual cells are displayed in the table below:

Multiple Linear Regression - Estimated Regression Equation
FinSit[t] = + 29.3956521739130 -19.0869565217391OntslagYvesLeterme[t] -2.04311594202898M1[t] + 0.178985507246380M2[t] + 0.401086956521736M3[t] + 1.22318840579710M4[t] + 3.64528985507247M5[t] + 5.66739130434783M6[t] + 5.48949275362319M7[t] + 4.11159420289855M8[t] -0.0663043478260841M9[t] + 1.55579710144928M10[t] + 2.79528985507246M11[t] -0.222101449275362t + e[t]


Multiple Linear Regression - Ordinary Least Squares
VariableParameterS.D.T-STATH0: parameter = 02-tail p-value1-tail p-value
(Intercept)29.39565217391304.132747.112900
OntslagYvesLeterme-19.08695652173918.947644-2.13320.0382770.019138
M1-2.043115942028985.000032-0.40860.6847140.342357
M20.1789855072463804.9922420.03590.9715550.485777
M30.4010869565217364.9851840.08050.9362240.468112
M41.223188405797104.978860.24570.8070260.403513
M53.645289855072474.9732740.7330.4672920.233646
M65.667391304347834.9684271.14070.2599070.129953
M75.489492753623194.9643221.10580.2745680.137284
M84.111594202898554.9609610.82880.4115030.205752
M9-0.06630434782608414.958346-0.01340.9893890.494694
M101.555797101449284.9564770.31390.7550220.377511
M112.795289855072465.2728010.53010.5985690.299285
t-0.2221014492753620.060881-3.64810.0006720.000336

\begin{tabular}{lllllllll}
\hline
Multiple Linear Regression - Ordinary Least Squares \tabularnewline
Variable & Parameter & S.D. & T-STATH0: parameter = 0 & 2-tail p-value & 1-tail p-value \tabularnewline
(Intercept) & 29.3956521739130 & 4.13274 & 7.1129 & 0 & 0 \tabularnewline
OntslagYvesLeterme & -19.0869565217391 & 8.947644 & -2.1332 & 0.038277 & 0.019138 \tabularnewline
M1 & -2.04311594202898 & 5.000032 & -0.4086 & 0.684714 & 0.342357 \tabularnewline
M2 & 0.178985507246380 & 4.992242 & 0.0359 & 0.971555 & 0.485777 \tabularnewline
M3 & 0.401086956521736 & 4.985184 & 0.0805 & 0.936224 & 0.468112 \tabularnewline
M4 & 1.22318840579710 & 4.97886 & 0.2457 & 0.807026 & 0.403513 \tabularnewline
M5 & 3.64528985507247 & 4.973274 & 0.733 & 0.467292 & 0.233646 \tabularnewline
M6 & 5.66739130434783 & 4.968427 & 1.1407 & 0.259907 & 0.129953 \tabularnewline
M7 & 5.48949275362319 & 4.964322 & 1.1058 & 0.274568 & 0.137284 \tabularnewline
M8 & 4.11159420289855 & 4.960961 & 0.8288 & 0.411503 & 0.205752 \tabularnewline
M9 & -0.0663043478260841 & 4.958346 & -0.0134 & 0.989389 & 0.494694 \tabularnewline
M10 & 1.55579710144928 & 4.956477 & 0.3139 & 0.755022 & 0.377511 \tabularnewline
M11 & 2.79528985507246 & 5.272801 & 0.5301 & 0.598569 & 0.299285 \tabularnewline
t & -0.222101449275362 & 0.060881 & -3.6481 & 0.000672 & 0.000336 \tabularnewline
\hline
\end{tabular}
%Source: https://freestatistics.org/blog/index.php?pk=25553&T=2

[TABLE]
[ROW][C]Multiple Linear Regression - Ordinary Least Squares[/C][/ROW]
[ROW][C]Variable[/C][C]Parameter[/C][C]S.D.[/C][C]T-STATH0: parameter = 0[/C][C]2-tail p-value[/C][C]1-tail p-value[/C][/ROW]
[ROW][C](Intercept)[/C][C]29.3956521739130[/C][C]4.13274[/C][C]7.1129[/C][C]0[/C][C]0[/C][/ROW]
[ROW][C]OntslagYvesLeterme[/C][C]-19.0869565217391[/C][C]8.947644[/C][C]-2.1332[/C][C]0.038277[/C][C]0.019138[/C][/ROW]
[ROW][C]M1[/C][C]-2.04311594202898[/C][C]5.000032[/C][C]-0.4086[/C][C]0.684714[/C][C]0.342357[/C][/ROW]
[ROW][C]M2[/C][C]0.178985507246380[/C][C]4.992242[/C][C]0.0359[/C][C]0.971555[/C][C]0.485777[/C][/ROW]
[ROW][C]M3[/C][C]0.401086956521736[/C][C]4.985184[/C][C]0.0805[/C][C]0.936224[/C][C]0.468112[/C][/ROW]
[ROW][C]M4[/C][C]1.22318840579710[/C][C]4.97886[/C][C]0.2457[/C][C]0.807026[/C][C]0.403513[/C][/ROW]
[ROW][C]M5[/C][C]3.64528985507247[/C][C]4.973274[/C][C]0.733[/C][C]0.467292[/C][C]0.233646[/C][/ROW]
[ROW][C]M6[/C][C]5.66739130434783[/C][C]4.968427[/C][C]1.1407[/C][C]0.259907[/C][C]0.129953[/C][/ROW]
[ROW][C]M7[/C][C]5.48949275362319[/C][C]4.964322[/C][C]1.1058[/C][C]0.274568[/C][C]0.137284[/C][/ROW]
[ROW][C]M8[/C][C]4.11159420289855[/C][C]4.960961[/C][C]0.8288[/C][C]0.411503[/C][C]0.205752[/C][/ROW]
[ROW][C]M9[/C][C]-0.0663043478260841[/C][C]4.958346[/C][C]-0.0134[/C][C]0.989389[/C][C]0.494694[/C][/ROW]
[ROW][C]M10[/C][C]1.55579710144928[/C][C]4.956477[/C][C]0.3139[/C][C]0.755022[/C][C]0.377511[/C][/ROW]
[ROW][C]M11[/C][C]2.79528985507246[/C][C]5.272801[/C][C]0.5301[/C][C]0.598569[/C][C]0.299285[/C][/ROW]
[ROW][C]t[/C][C]-0.222101449275362[/C][C]0.060881[/C][C]-3.6481[/C][C]0.000672[/C][C]0.000336[/C][/ROW]
[/TABLE]
Source: https://freestatistics.org/blog/index.php?pk=25553&T=2

Globally Unique Identifier (entire table): ba.freestatistics.org/blog/index.php?pk=25553&T=2

As an alternative you can also use a QR Code:  

The GUIDs for individual cells are displayed in the table below:

Multiple Linear Regression - Ordinary Least Squares
VariableParameterS.D.T-STATH0: parameter = 02-tail p-value1-tail p-value
(Intercept)29.39565217391304.132747.112900
OntslagYvesLeterme-19.08695652173918.947644-2.13320.0382770.019138
M1-2.043115942028985.000032-0.40860.6847140.342357
M20.1789855072463804.9922420.03590.9715550.485777
M30.4010869565217364.9851840.08050.9362240.468112
M41.223188405797104.978860.24570.8070260.403513
M53.645289855072474.9732740.7330.4672920.233646
M65.667391304347834.9684271.14070.2599070.129953
M75.489492753623194.9643221.10580.2745680.137284
M84.111594202898554.9609610.82880.4115030.205752
M9-0.06630434782608414.958346-0.01340.9893890.494694
M101.555797101449284.9564770.31390.7550220.377511
M112.795289855072465.2728010.53010.5985690.299285
t-0.2221014492753620.060881-3.64810.0006720.000336


Multiple Linear Regression - Regression Statistics
Multiple R0.61557955262221
R-squared0.37893818560656
Adjusted R-squared0.203420716321457
F-TEST (value)2.15897703601816
F-TEST (DF numerator)13
F-TEST (DF denominator)46
p-value0.0279487205040481
Multiple Linear Regression - Residual Statistics
Residual Standard Deviation7.83451237289105
Sum Squared Residuals2823.46086956522

\begin{tabular}{lllllllll}
\hline
Multiple Linear Regression - Regression Statistics \tabularnewline
Multiple R & 0.61557955262221 \tabularnewline
R-squared & 0.37893818560656 \tabularnewline
Adjusted R-squared & 0.203420716321457 \tabularnewline
F-TEST (value) & 2.15897703601816 \tabularnewline
F-TEST (DF numerator) & 13 \tabularnewline
F-TEST (DF denominator) & 46 \tabularnewline
p-value & 0.0279487205040481 \tabularnewline
Multiple Linear Regression - Residual Statistics \tabularnewline
Residual Standard Deviation & 7.83451237289105 \tabularnewline
Sum Squared Residuals & 2823.46086956522 \tabularnewline
\hline
\end{tabular}
%Source: https://freestatistics.org/blog/index.php?pk=25553&T=3

[TABLE]
[ROW][C]Multiple Linear Regression - Regression Statistics[/C][/ROW]
[ROW][C]Multiple R[/C][C]0.61557955262221[/C][/ROW]
[ROW][C]R-squared[/C][C]0.37893818560656[/C][/ROW]
[ROW][C]Adjusted R-squared[/C][C]0.203420716321457[/C][/ROW]
[ROW][C]F-TEST (value)[/C][C]2.15897703601816[/C][/ROW]
[ROW][C]F-TEST (DF numerator)[/C][C]13[/C][/ROW]
[ROW][C]F-TEST (DF denominator)[/C][C]46[/C][/ROW]
[ROW][C]p-value[/C][C]0.0279487205040481[/C][/ROW]
[ROW][C]Multiple Linear Regression - Residual Statistics[/C][/ROW]
[ROW][C]Residual Standard Deviation[/C][C]7.83451237289105[/C][/ROW]
[ROW][C]Sum Squared Residuals[/C][C]2823.46086956522[/C][/ROW]
[/TABLE]
Source: https://freestatistics.org/blog/index.php?pk=25553&T=3

Globally Unique Identifier (entire table): ba.freestatistics.org/blog/index.php?pk=25553&T=3

As an alternative you can also use a QR Code:  

The GUIDs for individual cells are displayed in the table below:

Multiple Linear Regression - Regression Statistics
Multiple R0.61557955262221
R-squared0.37893818560656
Adjusted R-squared0.203420716321457
F-TEST (value)2.15897703601816
F-TEST (DF numerator)13
F-TEST (DF denominator)46
p-value0.0279487205040481
Multiple Linear Regression - Residual Statistics
Residual Standard Deviation7.83451237289105
Sum Squared Residuals2823.46086956522


Multiple Linear Regression - Actuals, Interpolation, and Residuals
Time or IndexActualsInterpolationForecastResidualsPrediction Error
12127.1304347826087-6.1304347826087
21829.1304347826087-11.1304347826087
33129.13043478260871.8695652173913
43129.73043478260871.2695652173913
53531.93043478260873.06956521739131
63833.73043478260874.26956521739131
73633.33043478260872.66956521739131
83331.73043478260871.26956521739131
92927.33043478260871.66956521739131
103728.73043478260878.2695652173913
112829.7478260869565-1.74782608695652
123226.73043478260875.26956521739131
133124.46521739130446.53478260869565
142426.4652173913043-2.46521739130434
152526.4652173913043-1.46521739130435
162727.0652173913044-0.0652173913043519
172729.2652173913044-2.26521739130435
182931.0652173913043-2.06521739130435
193330.66521739130432.33478260869565
202629.0652173913043-3.06521739130435
211624.6652173913043-8.66521739130435
221526.0652173913044-11.0652173913044
231327.0826086956522-14.0826086956522
241824.0652173913043-6.06521739130434
25821.8-13.8
262123.8-2.8
272123.8-2.8
282524.40.599999999999997
292826.61.4
302728.4-1.4
312428-4
322426.4-2.4
3324222.00000000000000
342823.44.6
353124.41739130434786.58260869565218
362621.44.60000000000001
372819.13478260869578.86521739130435
383421.134782608695712.8652173913043
393321.134782608695711.8652173913043
402421.73478260869572.26521739130435
413023.93478260869576.06521739130435
423125.73478260869575.26521739130435
432825.33478260869572.66521739130435
443523.734782608695711.2652173913043
453319.334782608695713.6652173913043
463420.734782608695713.2652173913043
473121.75217391304359.24782608695652
482118.73478260869562.26521739130435
492116.46956521739134.5304347826087
502218.46956521739133.53043478260869
51918.4695652173913-9.4695652173913
521519.0695652173913-4.06956521739131
531321.2695652173913-8.2695652173913
541723.0695652173913-6.0695652173913
551922.6695652173913-3.6695652173913
561421.0695652173913-7.0695652173913
57816.6695652173913-8.6695652173913
58318.0695652173913-15.0695652173913
5908.88178419700125e-16-8.88178419700125e-16
601016.0695652173913-6.0695652173913

\begin{tabular}{lllllllll}
\hline
Multiple Linear Regression - Actuals, Interpolation, and Residuals \tabularnewline
Time or Index & Actuals & InterpolationForecast & ResidualsPrediction Error \tabularnewline
1 & 21 & 27.1304347826087 & -6.1304347826087 \tabularnewline
2 & 18 & 29.1304347826087 & -11.1304347826087 \tabularnewline
3 & 31 & 29.1304347826087 & 1.8695652173913 \tabularnewline
4 & 31 & 29.7304347826087 & 1.2695652173913 \tabularnewline
5 & 35 & 31.9304347826087 & 3.06956521739131 \tabularnewline
6 & 38 & 33.7304347826087 & 4.26956521739131 \tabularnewline
7 & 36 & 33.3304347826087 & 2.66956521739131 \tabularnewline
8 & 33 & 31.7304347826087 & 1.26956521739131 \tabularnewline
9 & 29 & 27.3304347826087 & 1.66956521739131 \tabularnewline
10 & 37 & 28.7304347826087 & 8.2695652173913 \tabularnewline
11 & 28 & 29.7478260869565 & -1.74782608695652 \tabularnewline
12 & 32 & 26.7304347826087 & 5.26956521739131 \tabularnewline
13 & 31 & 24.4652173913044 & 6.53478260869565 \tabularnewline
14 & 24 & 26.4652173913043 & -2.46521739130434 \tabularnewline
15 & 25 & 26.4652173913043 & -1.46521739130435 \tabularnewline
16 & 27 & 27.0652173913044 & -0.0652173913043519 \tabularnewline
17 & 27 & 29.2652173913044 & -2.26521739130435 \tabularnewline
18 & 29 & 31.0652173913043 & -2.06521739130435 \tabularnewline
19 & 33 & 30.6652173913043 & 2.33478260869565 \tabularnewline
20 & 26 & 29.0652173913043 & -3.06521739130435 \tabularnewline
21 & 16 & 24.6652173913043 & -8.66521739130435 \tabularnewline
22 & 15 & 26.0652173913044 & -11.0652173913044 \tabularnewline
23 & 13 & 27.0826086956522 & -14.0826086956522 \tabularnewline
24 & 18 & 24.0652173913043 & -6.06521739130434 \tabularnewline
25 & 8 & 21.8 & -13.8 \tabularnewline
26 & 21 & 23.8 & -2.8 \tabularnewline
27 & 21 & 23.8 & -2.8 \tabularnewline
28 & 25 & 24.4 & 0.599999999999997 \tabularnewline
29 & 28 & 26.6 & 1.4 \tabularnewline
30 & 27 & 28.4 & -1.4 \tabularnewline
31 & 24 & 28 & -4 \tabularnewline
32 & 24 & 26.4 & -2.4 \tabularnewline
33 & 24 & 22 & 2.00000000000000 \tabularnewline
34 & 28 & 23.4 & 4.6 \tabularnewline
35 & 31 & 24.4173913043478 & 6.58260869565218 \tabularnewline
36 & 26 & 21.4 & 4.60000000000001 \tabularnewline
37 & 28 & 19.1347826086957 & 8.86521739130435 \tabularnewline
38 & 34 & 21.1347826086957 & 12.8652173913043 \tabularnewline
39 & 33 & 21.1347826086957 & 11.8652173913043 \tabularnewline
40 & 24 & 21.7347826086957 & 2.26521739130435 \tabularnewline
41 & 30 & 23.9347826086957 & 6.06521739130435 \tabularnewline
42 & 31 & 25.7347826086957 & 5.26521739130435 \tabularnewline
43 & 28 & 25.3347826086957 & 2.66521739130435 \tabularnewline
44 & 35 & 23.7347826086957 & 11.2652173913043 \tabularnewline
45 & 33 & 19.3347826086957 & 13.6652173913043 \tabularnewline
46 & 34 & 20.7347826086957 & 13.2652173913043 \tabularnewline
47 & 31 & 21.7521739130435 & 9.24782608695652 \tabularnewline
48 & 21 & 18.7347826086956 & 2.26521739130435 \tabularnewline
49 & 21 & 16.4695652173913 & 4.5304347826087 \tabularnewline
50 & 22 & 18.4695652173913 & 3.53043478260869 \tabularnewline
51 & 9 & 18.4695652173913 & -9.4695652173913 \tabularnewline
52 & 15 & 19.0695652173913 & -4.06956521739131 \tabularnewline
53 & 13 & 21.2695652173913 & -8.2695652173913 \tabularnewline
54 & 17 & 23.0695652173913 & -6.0695652173913 \tabularnewline
55 & 19 & 22.6695652173913 & -3.6695652173913 \tabularnewline
56 & 14 & 21.0695652173913 & -7.0695652173913 \tabularnewline
57 & 8 & 16.6695652173913 & -8.6695652173913 \tabularnewline
58 & 3 & 18.0695652173913 & -15.0695652173913 \tabularnewline
59 & 0 & 8.88178419700125e-16 & -8.88178419700125e-16 \tabularnewline
60 & 10 & 16.0695652173913 & -6.0695652173913 \tabularnewline
\hline
\end{tabular}
%Source: https://freestatistics.org/blog/index.php?pk=25553&T=4

[TABLE]
[ROW][C]Multiple Linear Regression - Actuals, Interpolation, and Residuals[/C][/ROW]
[ROW][C]Time or Index[/C][C]Actuals[/C][C]InterpolationForecast[/C][C]ResidualsPrediction Error[/C][/ROW]
[ROW][C]1[/C][C]21[/C][C]27.1304347826087[/C][C]-6.1304347826087[/C][/ROW]
[ROW][C]2[/C][C]18[/C][C]29.1304347826087[/C][C]-11.1304347826087[/C][/ROW]
[ROW][C]3[/C][C]31[/C][C]29.1304347826087[/C][C]1.8695652173913[/C][/ROW]
[ROW][C]4[/C][C]31[/C][C]29.7304347826087[/C][C]1.2695652173913[/C][/ROW]
[ROW][C]5[/C][C]35[/C][C]31.9304347826087[/C][C]3.06956521739131[/C][/ROW]
[ROW][C]6[/C][C]38[/C][C]33.7304347826087[/C][C]4.26956521739131[/C][/ROW]
[ROW][C]7[/C][C]36[/C][C]33.3304347826087[/C][C]2.66956521739131[/C][/ROW]
[ROW][C]8[/C][C]33[/C][C]31.7304347826087[/C][C]1.26956521739131[/C][/ROW]
[ROW][C]9[/C][C]29[/C][C]27.3304347826087[/C][C]1.66956521739131[/C][/ROW]
[ROW][C]10[/C][C]37[/C][C]28.7304347826087[/C][C]8.2695652173913[/C][/ROW]
[ROW][C]11[/C][C]28[/C][C]29.7478260869565[/C][C]-1.74782608695652[/C][/ROW]
[ROW][C]12[/C][C]32[/C][C]26.7304347826087[/C][C]5.26956521739131[/C][/ROW]
[ROW][C]13[/C][C]31[/C][C]24.4652173913044[/C][C]6.53478260869565[/C][/ROW]
[ROW][C]14[/C][C]24[/C][C]26.4652173913043[/C][C]-2.46521739130434[/C][/ROW]
[ROW][C]15[/C][C]25[/C][C]26.4652173913043[/C][C]-1.46521739130435[/C][/ROW]
[ROW][C]16[/C][C]27[/C][C]27.0652173913044[/C][C]-0.0652173913043519[/C][/ROW]
[ROW][C]17[/C][C]27[/C][C]29.2652173913044[/C][C]-2.26521739130435[/C][/ROW]
[ROW][C]18[/C][C]29[/C][C]31.0652173913043[/C][C]-2.06521739130435[/C][/ROW]
[ROW][C]19[/C][C]33[/C][C]30.6652173913043[/C][C]2.33478260869565[/C][/ROW]
[ROW][C]20[/C][C]26[/C][C]29.0652173913043[/C][C]-3.06521739130435[/C][/ROW]
[ROW][C]21[/C][C]16[/C][C]24.6652173913043[/C][C]-8.66521739130435[/C][/ROW]
[ROW][C]22[/C][C]15[/C][C]26.0652173913044[/C][C]-11.0652173913044[/C][/ROW]
[ROW][C]23[/C][C]13[/C][C]27.0826086956522[/C][C]-14.0826086956522[/C][/ROW]
[ROW][C]24[/C][C]18[/C][C]24.0652173913043[/C][C]-6.06521739130434[/C][/ROW]
[ROW][C]25[/C][C]8[/C][C]21.8[/C][C]-13.8[/C][/ROW]
[ROW][C]26[/C][C]21[/C][C]23.8[/C][C]-2.8[/C][/ROW]
[ROW][C]27[/C][C]21[/C][C]23.8[/C][C]-2.8[/C][/ROW]
[ROW][C]28[/C][C]25[/C][C]24.4[/C][C]0.599999999999997[/C][/ROW]
[ROW][C]29[/C][C]28[/C][C]26.6[/C][C]1.4[/C][/ROW]
[ROW][C]30[/C][C]27[/C][C]28.4[/C][C]-1.4[/C][/ROW]
[ROW][C]31[/C][C]24[/C][C]28[/C][C]-4[/C][/ROW]
[ROW][C]32[/C][C]24[/C][C]26.4[/C][C]-2.4[/C][/ROW]
[ROW][C]33[/C][C]24[/C][C]22[/C][C]2.00000000000000[/C][/ROW]
[ROW][C]34[/C][C]28[/C][C]23.4[/C][C]4.6[/C][/ROW]
[ROW][C]35[/C][C]31[/C][C]24.4173913043478[/C][C]6.58260869565218[/C][/ROW]
[ROW][C]36[/C][C]26[/C][C]21.4[/C][C]4.60000000000001[/C][/ROW]
[ROW][C]37[/C][C]28[/C][C]19.1347826086957[/C][C]8.86521739130435[/C][/ROW]
[ROW][C]38[/C][C]34[/C][C]21.1347826086957[/C][C]12.8652173913043[/C][/ROW]
[ROW][C]39[/C][C]33[/C][C]21.1347826086957[/C][C]11.8652173913043[/C][/ROW]
[ROW][C]40[/C][C]24[/C][C]21.7347826086957[/C][C]2.26521739130435[/C][/ROW]
[ROW][C]41[/C][C]30[/C][C]23.9347826086957[/C][C]6.06521739130435[/C][/ROW]
[ROW][C]42[/C][C]31[/C][C]25.7347826086957[/C][C]5.26521739130435[/C][/ROW]
[ROW][C]43[/C][C]28[/C][C]25.3347826086957[/C][C]2.66521739130435[/C][/ROW]
[ROW][C]44[/C][C]35[/C][C]23.7347826086957[/C][C]11.2652173913043[/C][/ROW]
[ROW][C]45[/C][C]33[/C][C]19.3347826086957[/C][C]13.6652173913043[/C][/ROW]
[ROW][C]46[/C][C]34[/C][C]20.7347826086957[/C][C]13.2652173913043[/C][/ROW]
[ROW][C]47[/C][C]31[/C][C]21.7521739130435[/C][C]9.24782608695652[/C][/ROW]
[ROW][C]48[/C][C]21[/C][C]18.7347826086956[/C][C]2.26521739130435[/C][/ROW]
[ROW][C]49[/C][C]21[/C][C]16.4695652173913[/C][C]4.5304347826087[/C][/ROW]
[ROW][C]50[/C][C]22[/C][C]18.4695652173913[/C][C]3.53043478260869[/C][/ROW]
[ROW][C]51[/C][C]9[/C][C]18.4695652173913[/C][C]-9.4695652173913[/C][/ROW]
[ROW][C]52[/C][C]15[/C][C]19.0695652173913[/C][C]-4.06956521739131[/C][/ROW]
[ROW][C]53[/C][C]13[/C][C]21.2695652173913[/C][C]-8.2695652173913[/C][/ROW]
[ROW][C]54[/C][C]17[/C][C]23.0695652173913[/C][C]-6.0695652173913[/C][/ROW]
[ROW][C]55[/C][C]19[/C][C]22.6695652173913[/C][C]-3.6695652173913[/C][/ROW]
[ROW][C]56[/C][C]14[/C][C]21.0695652173913[/C][C]-7.0695652173913[/C][/ROW]
[ROW][C]57[/C][C]8[/C][C]16.6695652173913[/C][C]-8.6695652173913[/C][/ROW]
[ROW][C]58[/C][C]3[/C][C]18.0695652173913[/C][C]-15.0695652173913[/C][/ROW]
[ROW][C]59[/C][C]0[/C][C]8.88178419700125e-16[/C][C]-8.88178419700125e-16[/C][/ROW]
[ROW][C]60[/C][C]10[/C][C]16.0695652173913[/C][C]-6.0695652173913[/C][/ROW]
[/TABLE]
Source: https://freestatistics.org/blog/index.php?pk=25553&T=4

Globally Unique Identifier (entire table): ba.freestatistics.org/blog/index.php?pk=25553&T=4

As an alternative you can also use a QR Code:  

The GUIDs for individual cells are displayed in the table below:

Multiple Linear Regression - Actuals, Interpolation, and Residuals
Time or IndexActualsInterpolationForecastResidualsPrediction Error
12127.1304347826087-6.1304347826087
21829.1304347826087-11.1304347826087
33129.13043478260871.8695652173913
43129.73043478260871.2695652173913
53531.93043478260873.06956521739131
63833.73043478260874.26956521739131
73633.33043478260872.66956521739131
83331.73043478260871.26956521739131
92927.33043478260871.66956521739131
103728.73043478260878.2695652173913
112829.7478260869565-1.74782608695652
123226.73043478260875.26956521739131
133124.46521739130446.53478260869565
142426.4652173913043-2.46521739130434
152526.4652173913043-1.46521739130435
162727.0652173913044-0.0652173913043519
172729.2652173913044-2.26521739130435
182931.0652173913043-2.06521739130435
193330.66521739130432.33478260869565
202629.0652173913043-3.06521739130435
211624.6652173913043-8.66521739130435
221526.0652173913044-11.0652173913044
231327.0826086956522-14.0826086956522
241824.0652173913043-6.06521739130434
25821.8-13.8
262123.8-2.8
272123.8-2.8
282524.40.599999999999997
292826.61.4
302728.4-1.4
312428-4
322426.4-2.4
3324222.00000000000000
342823.44.6
353124.41739130434786.58260869565218
362621.44.60000000000001
372819.13478260869578.86521739130435
383421.134782608695712.8652173913043
393321.134782608695711.8652173913043
402421.73478260869572.26521739130435
413023.93478260869576.06521739130435
423125.73478260869575.26521739130435
432825.33478260869572.66521739130435
443523.734782608695711.2652173913043
453319.334782608695713.6652173913043
463420.734782608695713.2652173913043
473121.75217391304359.24782608695652
482118.73478260869562.26521739130435
492116.46956521739134.5304347826087
502218.46956521739133.53043478260869
51918.4695652173913-9.4695652173913
521519.0695652173913-4.06956521739131
531321.2695652173913-8.2695652173913
541723.0695652173913-6.0695652173913
551922.6695652173913-3.6695652173913
561421.0695652173913-7.0695652173913
57816.6695652173913-8.6695652173913
58318.0695652173913-15.0695652173913
5908.88178419700125e-16-8.88178419700125e-16
601016.0695652173913-6.0695652173913


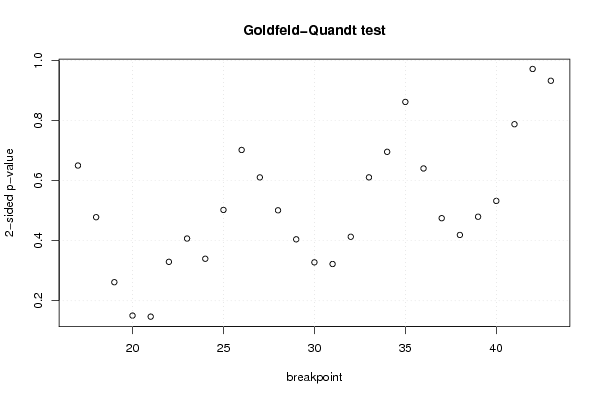
Goldfeld-Quandt test for Heteroskedasticity
p-valuesAlternative Hypothesis
breakpoint indexgreater2-sidedless
170.3250946683299260.6501893366598510.674905331670074
180.2390737189417330.4781474378834660.760926281058267
190.1308145827979570.2616291655959130.869185417202043
200.07521900351328750.1504380070265750.924780996486713
210.07346453645428960.1469290729085790.92653546354571
220.164751594805350.32950318961070.83524840519465
230.2035494466977270.4070988933954540.796450553302273
240.1698794533771020.3397589067542050.830120546622898
250.2511898390302480.5023796780604950.748810160969752
260.3510769200345540.7021538400691090.648923079965446
270.3053661950799380.6107323901598760.694633804920062
280.2505679618032740.5011359236065480.749432038196726
290.2022509174178210.4045018348356410.79774908258218
300.1639114394878050.3278228789756090.836088560512195
310.1611120731235760.3222241462471520.838887926876424
320.2064864696035220.4129729392070440.793513530396478
330.3054274873677220.6108549747354440.694572512632278
340.3479365234205420.6958730468410850.652063476579458
350.5689810138650130.8620379722699750.431018986134987
360.6797491764030370.6405016471939270.320250823596963
370.762578063717540.474843872564920.23742193628246
380.7904929869184720.4190140261630550.209507013081528
390.7601539565485570.4796920869028860.239846043451443
400.7338052895324960.5323894209350090.266194710467504
410.606109958940190.7877800821196190.393890041059810
420.485942274237870.971884548475740.51405772576213
430.5337467172444250.932506565511150.466253282755575

\begin{tabular}{lllllllll}
\hline
Goldfeld-Quandt test for Heteroskedasticity \tabularnewline
p-values & Alternative Hypothesis \tabularnewline
breakpoint index & greater & 2-sided & less \tabularnewline
17 & 0.325094668329926 & 0.650189336659851 & 0.674905331670074 \tabularnewline
18 & 0.239073718941733 & 0.478147437883466 & 0.760926281058267 \tabularnewline
19 & 0.130814582797957 & 0.261629165595913 & 0.869185417202043 \tabularnewline
20 & 0.0752190035132875 & 0.150438007026575 & 0.924780996486713 \tabularnewline
21 & 0.0734645364542896 & 0.146929072908579 & 0.92653546354571 \tabularnewline
22 & 0.16475159480535 & 0.3295031896107 & 0.83524840519465 \tabularnewline
23 & 0.203549446697727 & 0.407098893395454 & 0.796450553302273 \tabularnewline
24 & 0.169879453377102 & 0.339758906754205 & 0.830120546622898 \tabularnewline
25 & 0.251189839030248 & 0.502379678060495 & 0.748810160969752 \tabularnewline
26 & 0.351076920034554 & 0.702153840069109 & 0.648923079965446 \tabularnewline
27 & 0.305366195079938 & 0.610732390159876 & 0.694633804920062 \tabularnewline
28 & 0.250567961803274 & 0.501135923606548 & 0.749432038196726 \tabularnewline
29 & 0.202250917417821 & 0.404501834835641 & 0.79774908258218 \tabularnewline
30 & 0.163911439487805 & 0.327822878975609 & 0.836088560512195 \tabularnewline
31 & 0.161112073123576 & 0.322224146247152 & 0.838887926876424 \tabularnewline
32 & 0.206486469603522 & 0.412972939207044 & 0.793513530396478 \tabularnewline
33 & 0.305427487367722 & 0.610854974735444 & 0.694572512632278 \tabularnewline
34 & 0.347936523420542 & 0.695873046841085 & 0.652063476579458 \tabularnewline
35 & 0.568981013865013 & 0.862037972269975 & 0.431018986134987 \tabularnewline
36 & 0.679749176403037 & 0.640501647193927 & 0.320250823596963 \tabularnewline
37 & 0.76257806371754 & 0.47484387256492 & 0.23742193628246 \tabularnewline
38 & 0.790492986918472 & 0.419014026163055 & 0.209507013081528 \tabularnewline
39 & 0.760153956548557 & 0.479692086902886 & 0.239846043451443 \tabularnewline
40 & 0.733805289532496 & 0.532389420935009 & 0.266194710467504 \tabularnewline
41 & 0.60610995894019 & 0.787780082119619 & 0.393890041059810 \tabularnewline
42 & 0.48594227423787 & 0.97188454847574 & 0.51405772576213 \tabularnewline
43 & 0.533746717244425 & 0.93250656551115 & 0.466253282755575 \tabularnewline
\hline
\end{tabular}
%Source: https://freestatistics.org/blog/index.php?pk=25553&T=5

[TABLE]
[ROW][C]Goldfeld-Quandt test for Heteroskedasticity[/C][/ROW]
[ROW][C]p-values[/C][C]Alternative Hypothesis[/C][/ROW]
[ROW][C]breakpoint index[/C][C]greater[/C][C]2-sided[/C][C]less[/C][/ROW]
[ROW][C]17[/C][C]0.325094668329926[/C][C]0.650189336659851[/C][C]0.674905331670074[/C][/ROW]
[ROW][C]18[/C][C]0.239073718941733[/C][C]0.478147437883466[/C][C]0.760926281058267[/C][/ROW]
[ROW][C]19[/C][C]0.130814582797957[/C][C]0.261629165595913[/C][C]0.869185417202043[/C][/ROW]
[ROW][C]20[/C][C]0.0752190035132875[/C][C]0.150438007026575[/C][C]0.924780996486713[/C][/ROW]
[ROW][C]21[/C][C]0.0734645364542896[/C][C]0.146929072908579[/C][C]0.92653546354571[/C][/ROW]
[ROW][C]22[/C][C]0.16475159480535[/C][C]0.3295031896107[/C][C]0.83524840519465[/C][/ROW]
[ROW][C]23[/C][C]0.203549446697727[/C][C]0.407098893395454[/C][C]0.796450553302273[/C][/ROW]
[ROW][C]24[/C][C]0.169879453377102[/C][C]0.339758906754205[/C][C]0.830120546622898[/C][/ROW]
[ROW][C]25[/C][C]0.251189839030248[/C][C]0.502379678060495[/C][C]0.748810160969752[/C][/ROW]
[ROW][C]26[/C][C]0.351076920034554[/C][C]0.702153840069109[/C][C]0.648923079965446[/C][/ROW]
[ROW][C]27[/C][C]0.305366195079938[/C][C]0.610732390159876[/C][C]0.694633804920062[/C][/ROW]
[ROW][C]28[/C][C]0.250567961803274[/C][C]0.501135923606548[/C][C]0.749432038196726[/C][/ROW]
[ROW][C]29[/C][C]0.202250917417821[/C][C]0.404501834835641[/C][C]0.79774908258218[/C][/ROW]
[ROW][C]30[/C][C]0.163911439487805[/C][C]0.327822878975609[/C][C]0.836088560512195[/C][/ROW]
[ROW][C]31[/C][C]0.161112073123576[/C][C]0.322224146247152[/C][C]0.838887926876424[/C][/ROW]
[ROW][C]32[/C][C]0.206486469603522[/C][C]0.412972939207044[/C][C]0.793513530396478[/C][/ROW]
[ROW][C]33[/C][C]0.305427487367722[/C][C]0.610854974735444[/C][C]0.694572512632278[/C][/ROW]
[ROW][C]34[/C][C]0.347936523420542[/C][C]0.695873046841085[/C][C]0.652063476579458[/C][/ROW]
[ROW][C]35[/C][C]0.568981013865013[/C][C]0.862037972269975[/C][C]0.431018986134987[/C][/ROW]
[ROW][C]36[/C][C]0.679749176403037[/C][C]0.640501647193927[/C][C]0.320250823596963[/C][/ROW]
[ROW][C]37[/C][C]0.76257806371754[/C][C]0.47484387256492[/C][C]0.23742193628246[/C][/ROW]
[ROW][C]38[/C][C]0.790492986918472[/C][C]0.419014026163055[/C][C]0.209507013081528[/C][/ROW]
[ROW][C]39[/C][C]0.760153956548557[/C][C]0.479692086902886[/C][C]0.239846043451443[/C][/ROW]
[ROW][C]40[/C][C]0.733805289532496[/C][C]0.532389420935009[/C][C]0.266194710467504[/C][/ROW]
[ROW][C]41[/C][C]0.60610995894019[/C][C]0.787780082119619[/C][C]0.393890041059810[/C][/ROW]
[ROW][C]42[/C][C]0.48594227423787[/C][C]0.97188454847574[/C][C]0.51405772576213[/C][/ROW]
[ROW][C]43[/C][C]0.533746717244425[/C][C]0.93250656551115[/C][C]0.466253282755575[/C][/ROW]
[/TABLE]
Source: https://freestatistics.org/blog/index.php?pk=25553&T=5

Globally Unique Identifier (entire table): ba.freestatistics.org/blog/index.php?pk=25553&T=5

As an alternative you can also use a QR Code:  

The GUIDs for individual cells are displayed in the table below:

Goldfeld-Quandt test for Heteroskedasticity
p-valuesAlternative Hypothesis
breakpoint indexgreater2-sidedless
170.3250946683299260.6501893366598510.674905331670074
180.2390737189417330.4781474378834660.760926281058267
190.1308145827979570.2616291655959130.869185417202043
200.07521900351328750.1504380070265750.924780996486713
210.07346453645428960.1469290729085790.92653546354571
220.164751594805350.32950318961070.83524840519465
230.2035494466977270.4070988933954540.796450553302273
240.1698794533771020.3397589067542050.830120546622898
250.2511898390302480.5023796780604950.748810160969752
260.3510769200345540.7021538400691090.648923079965446
270.3053661950799380.6107323901598760.694633804920062
280.2505679618032740.5011359236065480.749432038196726
290.2022509174178210.4045018348356410.79774908258218
300.1639114394878050.3278228789756090.836088560512195
310.1611120731235760.3222241462471520.838887926876424
320.2064864696035220.4129729392070440.793513530396478
330.3054274873677220.6108549747354440.694572512632278
340.3479365234205420.6958730468410850.652063476579458
350.5689810138650130.8620379722699750.431018986134987
360.6797491764030370.6405016471939270.320250823596963
370.762578063717540.474843872564920.23742193628246
380.7904929869184720.4190140261630550.209507013081528
390.7601539565485570.4796920869028860.239846043451443
400.7338052895324960.5323894209350090.266194710467504
410.606109958940190.7877800821196190.393890041059810
420.485942274237870.971884548475740.51405772576213
430.5337467172444250.932506565511150.466253282755575


Meta Analysis of Goldfeld-Quandt test for Heteroskedasticity
Description# significant tests% significant testsOK/NOK
1% type I error level00OK
5% type I error level00OK
10% type I error level00OK

\begin{tabular}{lllllllll}
\hline
Meta Analysis of Goldfeld-Quandt test for Heteroskedasticity \tabularnewline
Description & # significant tests & % significant tests & OK/NOK \tabularnewline
1% type I error level & 0 & 0 & OK \tabularnewline
5% type I error level & 0 & 0 & OK \tabularnewline
10% type I error level & 0 & 0 & OK \tabularnewline
\hline
\end{tabular}
%Source: https://freestatistics.org/blog/index.php?pk=25553&T=6

[TABLE]
[ROW][C]Meta Analysis of Goldfeld-Quandt test for Heteroskedasticity[/C][/ROW]
[ROW][C]Description[/C][C]# significant tests[/C][C]% significant tests[/C][C]OK/NOK[/C][/ROW]
[ROW][C]1% type I error level[/C][C]0[/C][C]0[/C][C]OK[/C][/ROW]
[ROW][C]5% type I error level[/C][C]0[/C][C]0[/C][C]OK[/C][/ROW]
[ROW][C]10% type I error level[/C][C]0[/C][C]0[/C][C]OK[/C][/ROW]
[/TABLE]
Source: https://freestatistics.org/blog/index.php?pk=25553&T=6

Globally Unique Identifier (entire table): ba.freestatistics.org/blog/index.php?pk=25553&T=6

As an alternative you can also use a QR Code:  

The GUIDs for individual cells are displayed in the table below:

Meta Analysis of Goldfeld-Quandt test for Heteroskedasticity
Description# significant tests% significant testsOK/NOK
1% type I error level00OK
5% type I error level00OK
10% type I error level00OK


Parameters (Session):
par1 = 1 ; par2 = Include Monthly Dummies ; par3 = Linear Trend ;
Parameters (R input):
par1 = 1 ; par2 = Include Monthly Dummies ; par3 = Linear Trend ;
R code (references can be found in the software module):
library(lattice)
library(lmtest)
n25 <- 25 #minimum number of obs. for Goldfeld-Quandt test
par1 <- as.numeric(par1)
x <- t(y)
k <- length(x[1,])
n <- length(x[,1])
x1 <- cbind(x[,par1], x[,1:k!=par1])
mycolnames <- c(colnames(x)[par1], colnames(x)[1:k!=par1])
colnames(x1) <- mycolnames #colnames(x)[par1]
x <- x1
if (par3 == 'First Differences'){
x2 <- array(0, dim=c(n-1,k), dimnames=list(1:(n-1), paste('(1-B)',colnames(x),sep='')))
for (i in 1:n-1) {
for (j in 1:k) {
x2[i,j] <- x[i+1,j] - x[i,j]
}
}
x <- x2
}
if (par2 == 'Include Monthly Dummies'){
x2 <- array(0, dim=c(n,11), dimnames=list(1:n, paste('M', seq(1:11), sep ='')))
for (i in 1:11){
x2[seq(i,n,12),i] <- 1
}
x <- cbind(x, x2)
}
if (par2 == 'Include Quarterly Dummies'){
x2 <- array(0, dim=c(n,3), dimnames=list(1:n, paste('Q', seq(1:3), sep ='')))
for (i in 1:3){
x2[seq(i,n,4),i] <- 1
}
x <- cbind(x, x2)
}
k <- length(x[1,])
if (par3 == 'Linear Trend'){
x <- cbind(x, c(1:n))
colnames(x)[k+1] <- 't'
}
x
k <- length(x[1,])
df <- as.data.frame(x)
(mylm <- lm(df))
(mysum <- summary(mylm))
if (n > n25) {
kp3 <- k + 3
nmkm3 <- n - k - 3
gqarr <- array(NA, dim=c(nmkm3-kp3+1,3))
numgqtests <- 0
numsignificant1 <- 0
numsignificant5 <- 0
numsignificant10 <- 0
for (mypoint in kp3:nmkm3) {
j <- 0
numgqtests <- numgqtests + 1
for (myalt in c('greater', 'two.sided', 'less')) {
j <- j + 1
gqarr[mypoint-kp3+1,j] <- gqtest(mylm, point=mypoint, alternative=myalt)$p.value
}
if (gqarr[mypoint-kp3+1,2] < 0.01) numsignificant1 <- numsignificant1 + 1
if (gqarr[mypoint-kp3+1,2] < 0.05) numsignificant5 <- numsignificant5 + 1
if (gqarr[mypoint-kp3+1,2] < 0.10) numsignificant10 <- numsignificant10 + 1
}
gqarr
}
bitmap(file='test0.png')
plot(x[,1], type='l', main='Actuals and Interpolation', ylab='value of Actuals and Interpolation (dots)', xlab='time or index')
points(x[,1]-mysum$resid)
grid()
dev.off()
bitmap(file='test1.png')
plot(mysum$resid, type='b', pch=19, main='Residuals', ylab='value of Residuals', xlab='time or index')
grid()
dev.off()
bitmap(file='test2.png')
hist(mysum$resid, main='Residual Histogram', xlab='values of Residuals')
grid()
dev.off()
bitmap(file='test3.png')
densityplot(~mysum$resid,col='black',main='Residual Density Plot', xlab='values of Residuals')
dev.off()
bitmap(file='test4.png')
qqnorm(mysum$resid, main='Residual Normal Q-Q Plot')
qqline(mysum$resid)
grid()
dev.off()
(myerror <- as.ts(mysum$resid))
bitmap(file='test5.png')
dum <- cbind(lag(myerror,k=1),myerror)
dum
dum1 <- dum[2:length(myerror),]
dum1
z <- as.data.frame(dum1)
z
plot(z,main=paste('Residual Lag plot, lowess, and regression line'), ylab='values of Residuals', xlab='lagged values of Residuals')
lines(lowess(z))
abline(lm(z))
grid()
dev.off()
bitmap(file='test6.png')
acf(mysum$resid, lag.max=length(mysum$resid)/2, main='Residual Autocorrelation Function')
grid()
dev.off()
bitmap(file='test7.png')
pacf(mysum$resid, lag.max=length(mysum$resid)/2, main='Residual Partial Autocorrelation Function')
grid()
dev.off()
bitmap(file='test8.png')
opar <- par(mfrow = c(2,2), oma = c(0, 0, 1.1, 0))
plot(mylm, las = 1, sub='Residual Diagnostics')
par(opar)
dev.off()
if (n > n25) {
bitmap(file='test9.png')
plot(kp3:nmkm3,gqarr[,2], main='Goldfeld-Quandt test',ylab='2-sided p-value',xlab='breakpoint')
grid()
dev.off()
}
load(file='createtable')
a<-table.start()
a<-table.row.start(a)
a<-table.element(a, 'Multiple Linear Regression - Estimated Regression Equation', 1, TRUE)
a<-table.row.end(a)
myeq <- colnames(x)[1]
myeq <- paste(myeq, '[t] = ', sep='')
for (i in 1:k){
if (mysum$coefficients[i,1] > 0) myeq <- paste(myeq, '+', '')
myeq <- paste(myeq, mysum$coefficients[i,1], sep=' ')
if (rownames(mysum$coefficients)[i] != '(Intercept)') {
myeq <- paste(myeq, rownames(mysum$coefficients)[i], sep='')
if (rownames(mysum$coefficients)[i] != 't') myeq <- paste(myeq, '[t]', sep='')
}
}
myeq <- paste(myeq, ' + e[t]')
a<-table.row.start(a)
a<-table.element(a, myeq)
a<-table.row.end(a)
a<-table.end(a)
table.save(a,file='mytable1.tab')
a<-table.start()
a<-table.row.start(a)
a<-table.element(a,hyperlink('ols1.htm','Multiple Linear Regression - Ordinary Least Squares',''), 6, TRUE)
a<-table.row.end(a)
a<-table.row.start(a)
a<-table.element(a,'Variable',header=TRUE)
a<-table.element(a,'Parameter',header=TRUE)
a<-table.element(a,'S.D.',header=TRUE)
a<-table.element(a,'T-STAT
H0: parameter = 0',header=TRUE)
a<-table.element(a,'2-tail p-value',header=TRUE)
a<-table.element(a,'1-tail p-value',header=TRUE)
a<-table.row.end(a)
for (i in 1:k){
a<-table.row.start(a)
a<-table.element(a,rownames(mysum$coefficients)[i],header=TRUE)
a<-table.element(a,mysum$coefficients[i,1])
a<-table.element(a, round(mysum$coefficients[i,2],6))
a<-table.element(a, round(mysum$coefficients[i,3],4))
a<-table.element(a, round(mysum$coefficients[i,4],6))
a<-table.element(a, round(mysum$coefficients[i,4]/2,6))
a<-table.row.end(a)
}
a<-table.end(a)
table.save(a,file='mytable2.tab')
a<-table.start()
a<-table.row.start(a)
a<-table.element(a, 'Multiple Linear Regression - Regression Statistics', 2, TRUE)
a<-table.row.end(a)
a<-table.row.start(a)
a<-table.element(a, 'Multiple R',1,TRUE)
a<-table.element(a, sqrt(mysum$r.squared))
a<-table.row.end(a)
a<-table.row.start(a)
a<-table.element(a, 'R-squared',1,TRUE)
a<-table.element(a, mysum$r.squared)
a<-table.row.end(a)
a<-table.row.start(a)
a<-table.element(a, 'Adjusted R-squared',1,TRUE)
a<-table.element(a, mysum$adj.r.squared)
a<-table.row.end(a)
a<-table.row.start(a)
a<-table.element(a, 'F-TEST (value)',1,TRUE)
a<-table.element(a, mysum$fstatistic[1])
a<-table.row.end(a)
a<-table.row.start(a)
a<-table.element(a, 'F-TEST (DF numerator)',1,TRUE)
a<-table.element(a, mysum$fstatistic[2])
a<-table.row.end(a)
a<-table.row.start(a)
a<-table.element(a, 'F-TEST (DF denominator)',1,TRUE)
a<-table.element(a, mysum$fstatistic[3])
a<-table.row.end(a)
a<-table.row.start(a)
a<-table.element(a, 'p-value',1,TRUE)
a<-table.element(a, 1-pf(mysum$fstatistic[1],mysum$fstatistic[2],mysum$fstatistic[3]))
a<-table.row.end(a)
a<-table.row.start(a)
a<-table.element(a, 'Multiple Linear Regression - Residual Statistics', 2, TRUE)
a<-table.row.end(a)
a<-table.row.start(a)
a<-table.element(a, 'Residual Standard Deviation',1,TRUE)
a<-table.element(a, mysum$sigma)
a<-table.row.end(a)
a<-table.row.start(a)
a<-table.element(a, 'Sum Squared Residuals',1,TRUE)
a<-table.element(a, sum(myerror*myerror))
a<-table.row.end(a)
a<-table.end(a)
table.save(a,file='mytable3.tab')
a<-table.start()
a<-table.row.start(a)
a<-table.element(a, 'Multiple Linear Regression - Actuals, Interpolation, and Residuals', 4, TRUE)
a<-table.row.end(a)
a<-table.row.start(a)
a<-table.element(a, 'Time or Index', 1, TRUE)
a<-table.element(a, 'Actuals', 1, TRUE)
a<-table.element(a, 'Interpolation
Forecast', 1, TRUE)
a<-table.element(a, 'Residuals
Prediction Error', 1, TRUE)
a<-table.row.end(a)
for (i in 1:n) {
a<-table.row.start(a)
a<-table.element(a,i, 1, TRUE)
a<-table.element(a,x[i])
a<-table.element(a,x[i]-mysum$resid[i])
a<-table.element(a,mysum$resid[i])
a<-table.row.end(a)
}
a<-table.end(a)
table.save(a,file='mytable4.tab')
if (n > n25) {
a<-table.start()
a<-table.row.start(a)
a<-table.element(a,'Goldfeld-Quandt test for Heteroskedasticity',4,TRUE)
a<-table.row.end(a)
a<-table.row.start(a)
a<-table.element(a,'p-values',header=TRUE)
a<-table.element(a,'Alternative Hypothesis',3,header=TRUE)
a<-table.row.end(a)
a<-table.row.start(a)
a<-table.element(a,'breakpoint index',header=TRUE)
a<-table.element(a,'greater',header=TRUE)
a<-table.element(a,'2-sided',header=TRUE)
a<-table.element(a,'less',header=TRUE)
a<-table.row.end(a)
for (mypoint in kp3:nmkm3) {
a<-table.row.start(a)
a<-table.element(a,mypoint,header=TRUE)
a<-table.element(a,gqarr[mypoint-kp3+1,1])
a<-table.element(a,gqarr[mypoint-kp3+1,2])
a<-table.element(a,gqarr[mypoint-kp3+1,3])
a<-table.row.end(a)
}
a<-table.end(a)
table.save(a,file='mytable5.tab')
a<-table.start()
a<-table.row.start(a)
a<-table.element(a,'Meta Analysis of Goldfeld-Quandt test for Heteroskedasticity',4,TRUE)
a<-table.row.end(a)
a<-table.row.start(a)
a<-table.element(a,'Description',header=TRUE)
a<-table.element(a,'# significant tests',header=TRUE)
a<-table.element(a,'% significant tests',header=TRUE)
a<-table.element(a,'OK/NOK',header=TRUE)
a<-table.row.end(a)
a<-table.row.start(a)
a<-table.element(a,'1% type I error level',header=TRUE)
a<-table.element(a,numsignificant1)
a<-table.element(a,numsignificant1/numgqtests)
if (numsignificant1/numgqtests < 0.01) dum <- 'OK' else dum <- 'NOK'
a<-table.element(a,dum)
a<-table.row.end(a)
a<-table.row.start(a)
a<-table.element(a,'5% type I error level',header=TRUE)
a<-table.element(a,numsignificant5)
a<-table.element(a,numsignificant5/numgqtests)
if (numsignificant5/numgqtests < 0.05) dum <- 'OK' else dum <- 'NOK'
a<-table.element(a,dum)
a<-table.row.end(a)
a<-table.row.start(a)
a<-table.element(a,'10% type I error level',header=TRUE)
a<-table.element(a,numsignificant10)
a<-table.element(a,numsignificant10/numgqtests)
if (numsignificant10/numgqtests < 0.1) dum <- 'OK' else dum <- 'NOK'
a<-table.element(a,dum)
a<-table.row.end(a)
a<-table.end(a)
table.save(a,file='mytable6.tab')
}