Free Statistics

of Irreproducible Research!

Author's title

Author*The author of this computation has been verified*
R Software Modulerwasp_multipleregression.wasp
Title produced by softwareMultiple Regression
Date of computationMon, 24 Nov 2008 15:07:23 -0700
Cite this page as followsStatistical Computations at FreeStatistics.org, Office for Research Development and Education, URL https://freestatistics.org/blog/index.php?v=date/2008/Nov/24/t1227564539225wxarlnjqj9nr.htm/, Retrieved Tue, 14 May 2024 15:08:37 +0000
Statistical Computations at FreeStatistics.org, Office for Research Development and Education, URL https://freestatistics.org/blog/index.php?pk=25552, Retrieved Tue, 14 May 2024 15:08:37 +0000
QR Codes:

Original text written by user:
IsPrivate?No (this computation is public)
User-defined keywords
Estimated Impact139
Family? (F = Feedback message, R = changed R code, M = changed R Module, P = changed Parameters, D = changed Data)
-     [Multiple Regression] [Q1 The Seatbeltlaw] [2007-11-14 19:27:43] [8cd6641b921d30ebe00b648d1481bba0]
F   PD  [Multiple Regression] [Q] [2008-11-21 13:19:35] [6cc1b82ed3274c863014203c04193f5a]
F   PD      [Multiple Regression] [Q3] [2008-11-24 22:07:23] [783db4b4a0f63b73ca8b14666b7f4329] [Current]
Feedback Forum
2008-11-30 16:27:25 [Inge Meelberghs] [reply
Het is goed dat je een dummie variabele hebt gevonden. Al is het wel jammer dat je je eigen tijdreeksen niet in je document hebt vermeld waardoor ik niet weet waarover ze net gaan.

Wel kan ik uit onderstaande berekeningen en grafieken afleiden dat je model niet in orde is omdat nie aan alle voorwaarden zijn voldaan.
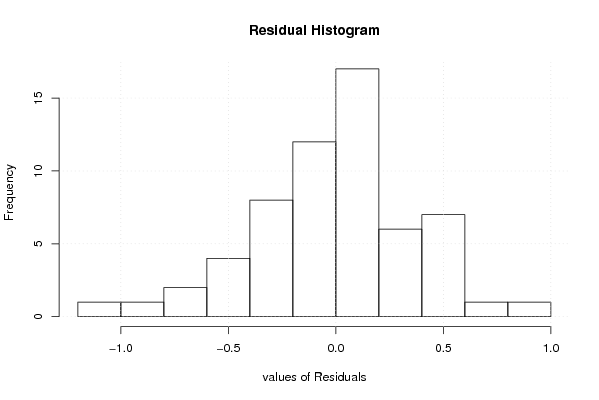
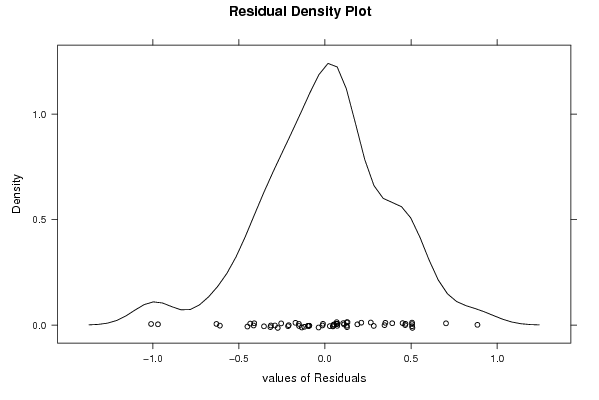
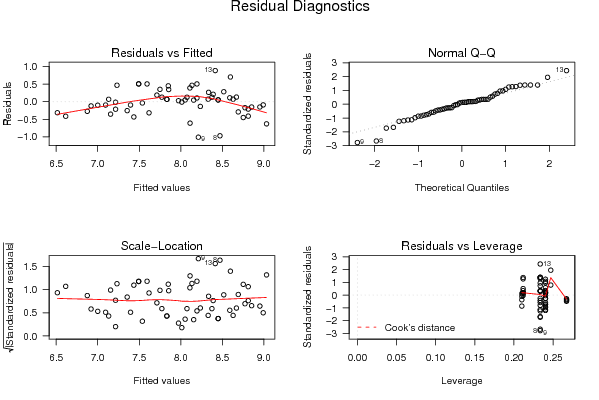
Zo is er bijvoorbeeld geen sprake van een normaalverdeling/vaste verdeling omdat er zowel in de histogramm als de density plot een scheve verdeling te zien is.
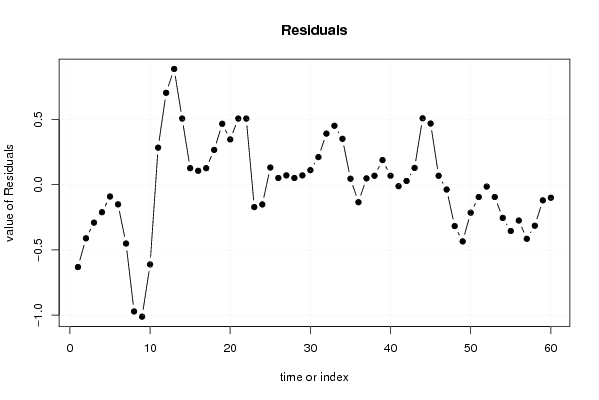
Ook de grafiek van de Residuals die de voorspellingfouten weergeeft is niet correct. Het gemmiddelde van deze fouten moet constant zijn en dat is in dit model niet het geval.
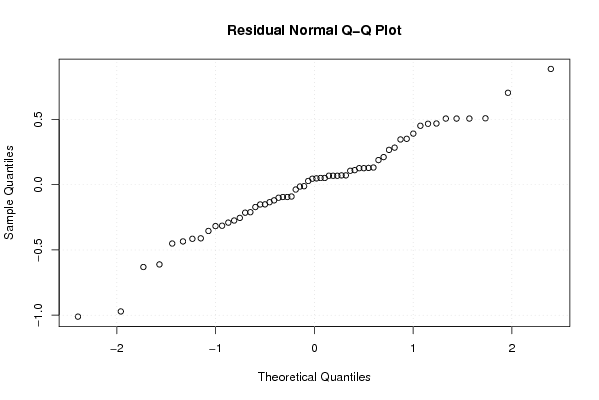
De normal qq plot toont aan dat de kwantielen van de normaalverdeling niet zo goed overeen komen met die van de residu’s doordat ze helemaal niet op een rechte liggen. Aan de uiteinden is ook heel duidelijk te zien dat er zich enkele extremen voordoen.
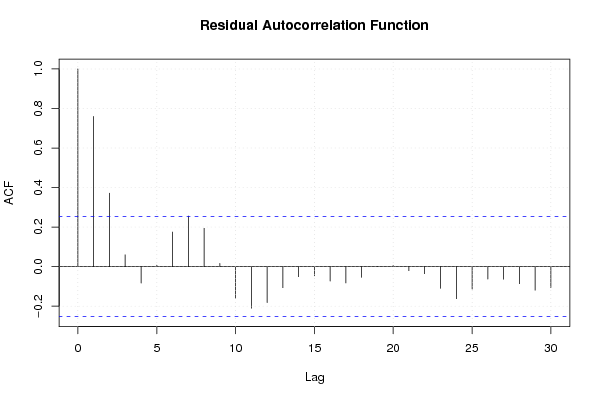
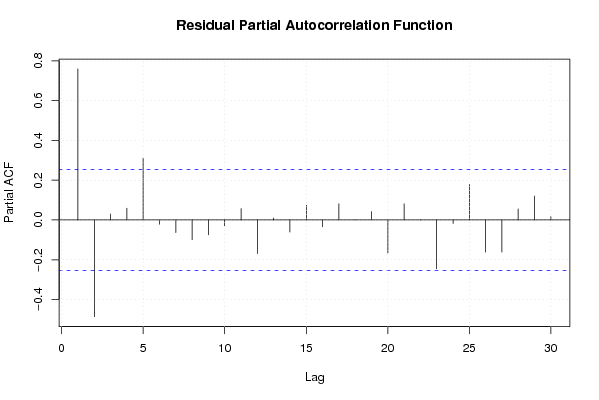
In de autocorrelatie grafiek vinden we wel geen terugkerend patroon terug wat wel goed is. Aan deze voorwaarde is dus wel voldaan.
2008-12-01 20:38:35 [8e2cc0b2ef568da46d009b2f601285b2] [reply
De student heeft de vraag met een minimum aan moeite opgelost, hoewel hij een dummie heeft gevonden bespreekt hij de gevolgen voor zijn reeks niet. De student geeft ook niet aan om welke reeks het gaat zodat de beoordeling of de dummy al dan niet relevant is moeilijk zo niet onmogelijk is.

Post a new message
Dataseries X:
8,4	0
8,4	0
8,4	0
8,6	0
8,9	0
8,8	0
8,3	0
7,5	0
7,2	0
7,5	0
8,8	0
9,3	0
9,3	0
8,7	0
8,2	0
8,3	0
8,5	0
8,6	0
8,6	0
8,2	0
8,1	0
8	0
8,6	1
8,7	1
8,8	1
8,5	1
8,4	1
8,5	1
8,7	1
8,7	1
8,6	1
8,5	1
8,3	1
8,1	1
8,2	1
8,1	1
8,1	1
7,9	1
7,9	1
7,9	1
8	1
8	1
7,9	1
8	1
7,7	1
7,2	1
7,5	1
7,3	1
7	1
7	1
7	1
7,2	1
7,3	1
7,1	1
6,8	1
6,6	1
6,2	1
6,2	1
6,8	1
6,9	1


Summary of computational transaction
Raw Inputview raw input (R code)
Raw Outputview raw output of R engine
Computing time3 seconds
R Server'Gwilym Jenkins' @ 72.249.127.135

\begin{tabular}{lllllllll}
\hline
Summary of computational transaction \tabularnewline
Raw Input & view raw input (R code)  \tabularnewline
Raw Output & view raw output of R engine  \tabularnewline
Computing time & 3 seconds \tabularnewline
R Server & 'Gwilym Jenkins' @ 72.249.127.135 \tabularnewline
\hline
\end{tabular}
%Source: https://freestatistics.org/blog/index.php?pk=25552&T=0

[TABLE]
[ROW][C]Summary of computational transaction[/C][/ROW]
[ROW][C]Raw Input[/C][C]view raw input (R code) [/C][/ROW]
[ROW][C]Raw Output[/C][C]view raw output of R engine [/C][/ROW]
[ROW][C]Computing time[/C][C]3 seconds[/C][/ROW]
[ROW][C]R Server[/C][C]'Gwilym Jenkins' @ 72.249.127.135[/C][/ROW]
[/TABLE]
Source: https://freestatistics.org/blog/index.php?pk=25552&T=0

Globally Unique Identifier (entire table): ba.freestatistics.org/blog/index.php?pk=25552&T=0

As an alternative you can also use a QR Code:  

The GUIDs for individual cells are displayed in the table below:

Summary of computational transaction
Raw Inputview raw input (R code)
Raw Outputview raw output of R engine
Computing time3 seconds
R Server'Gwilym Jenkins' @ 72.249.127.135


Multiple Linear Regression - Estimated Regression Equation
y[t] = + 9.21361344537814 + 0.872268907563026x[t] -0.131260504201686M1[t] -0.299831932773109M2[t] -0.368403361344537M3[t] -0.196974789915966M4[t] + 0.0344537815126055M5[t] + 0.0458823529411772M6[t] -0.102689075630251M7[t] -0.331260504201680M8[t] -0.539831932773108M9[t] -0.588403361344538M10[t] -0.131428571428571M11[t] -0.0514285714285714t + e[t]

\begin{tabular}{lllllllll}
\hline
Multiple Linear Regression - Estimated Regression Equation \tabularnewline
y[t] =  +  9.21361344537814 +  0.872268907563026x[t] -0.131260504201686M1[t] -0.299831932773109M2[t] -0.368403361344537M3[t] -0.196974789915966M4[t] +  0.0344537815126055M5[t] +  0.0458823529411772M6[t] -0.102689075630251M7[t] -0.331260504201680M8[t] -0.539831932773108M9[t] -0.588403361344538M10[t] -0.131428571428571M11[t] -0.0514285714285714t  + e[t] \tabularnewline
\hline
\end{tabular}
%Source: https://freestatistics.org/blog/index.php?pk=25552&T=1

[TABLE]
[ROW][C]Multiple Linear Regression - Estimated Regression Equation[/C][/ROW]
[ROW][C]y[t] =  +  9.21361344537814 +  0.872268907563026x[t] -0.131260504201686M1[t] -0.299831932773109M2[t] -0.368403361344537M3[t] -0.196974789915966M4[t] +  0.0344537815126055M5[t] +  0.0458823529411772M6[t] -0.102689075630251M7[t] -0.331260504201680M8[t] -0.539831932773108M9[t] -0.588403361344538M10[t] -0.131428571428571M11[t] -0.0514285714285714t  + e[t][/C][/ROW]
[/TABLE]
Source: https://freestatistics.org/blog/index.php?pk=25552&T=1

Globally Unique Identifier (entire table): ba.freestatistics.org/blog/index.php?pk=25552&T=1

As an alternative you can also use a QR Code:  

The GUIDs for individual cells are displayed in the table below:

Multiple Linear Regression - Estimated Regression Equation
y[t] = + 9.21361344537814 + 0.872268907563026x[t] -0.131260504201686M1[t] -0.299831932773109M2[t] -0.368403361344537M3[t] -0.196974789915966M4[t] + 0.0344537815126055M5[t] + 0.0458823529411772M6[t] -0.102689075630251M7[t] -0.331260504201680M8[t] -0.539831932773108M9[t] -0.588403361344538M10[t] -0.131428571428571M11[t] -0.0514285714285714t + e[t]


Multiple Linear Regression - Ordinary Least Squares
VariableParameterS.D.T-STATH0: parameter = 02-tail p-value1-tail p-value
(Intercept)9.213613445378140.21831142.20400
x0.8722689075630260.2087854.17780.000136.5e-05
M1-0.1312605042016860.265577-0.49420.6234840.311742
M2-0.2998319327731090.264995-1.13150.2637240.131862
M3-0.3684033613445370.264541-1.39260.1704320.085216
M4-0.1969747899159660.264217-0.74550.459760.22988
M50.03445378151260550.2640220.13050.8967430.448372
M60.04588235294117720.2639570.17380.8627660.431383
M7-0.1026890756302510.264022-0.38890.6991140.349557
M8-0.3312605042016800.264217-1.25370.2162690.108135
M9-0.5398319327731080.264541-2.04060.0470510.023525
M10-0.5884033613445380.264995-2.22040.0313560.015678
M11-0.1314285714285710.263057-0.49960.6197240.309862
t-0.05142857142857140.005857-8.780300

\begin{tabular}{lllllllll}
\hline
Multiple Linear Regression - Ordinary Least Squares \tabularnewline
Variable & Parameter & S.D. & T-STATH0: parameter = 0 & 2-tail p-value & 1-tail p-value \tabularnewline
(Intercept) & 9.21361344537814 & 0.218311 & 42.204 & 0 & 0 \tabularnewline
x & 0.872268907563026 & 0.208785 & 4.1778 & 0.00013 & 6.5e-05 \tabularnewline
M1 & -0.131260504201686 & 0.265577 & -0.4942 & 0.623484 & 0.311742 \tabularnewline
M2 & -0.299831932773109 & 0.264995 & -1.1315 & 0.263724 & 0.131862 \tabularnewline
M3 & -0.368403361344537 & 0.264541 & -1.3926 & 0.170432 & 0.085216 \tabularnewline
M4 & -0.196974789915966 & 0.264217 & -0.7455 & 0.45976 & 0.22988 \tabularnewline
M5 & 0.0344537815126055 & 0.264022 & 0.1305 & 0.896743 & 0.448372 \tabularnewline
M6 & 0.0458823529411772 & 0.263957 & 0.1738 & 0.862766 & 0.431383 \tabularnewline
M7 & -0.102689075630251 & 0.264022 & -0.3889 & 0.699114 & 0.349557 \tabularnewline
M8 & -0.331260504201680 & 0.264217 & -1.2537 & 0.216269 & 0.108135 \tabularnewline
M9 & -0.539831932773108 & 0.264541 & -2.0406 & 0.047051 & 0.023525 \tabularnewline
M10 & -0.588403361344538 & 0.264995 & -2.2204 & 0.031356 & 0.015678 \tabularnewline
M11 & -0.131428571428571 & 0.263057 & -0.4996 & 0.619724 & 0.309862 \tabularnewline
t & -0.0514285714285714 & 0.005857 & -8.7803 & 0 & 0 \tabularnewline
\hline
\end{tabular}
%Source: https://freestatistics.org/blog/index.php?pk=25552&T=2

[TABLE]
[ROW][C]Multiple Linear Regression - Ordinary Least Squares[/C][/ROW]
[ROW][C]Variable[/C][C]Parameter[/C][C]S.D.[/C][C]T-STATH0: parameter = 0[/C][C]2-tail p-value[/C][C]1-tail p-value[/C][/ROW]
[ROW][C](Intercept)[/C][C]9.21361344537814[/C][C]0.218311[/C][C]42.204[/C][C]0[/C][C]0[/C][/ROW]
[ROW][C]x[/C][C]0.872268907563026[/C][C]0.208785[/C][C]4.1778[/C][C]0.00013[/C][C]6.5e-05[/C][/ROW]
[ROW][C]M1[/C][C]-0.131260504201686[/C][C]0.265577[/C][C]-0.4942[/C][C]0.623484[/C][C]0.311742[/C][/ROW]
[ROW][C]M2[/C][C]-0.299831932773109[/C][C]0.264995[/C][C]-1.1315[/C][C]0.263724[/C][C]0.131862[/C][/ROW]
[ROW][C]M3[/C][C]-0.368403361344537[/C][C]0.264541[/C][C]-1.3926[/C][C]0.170432[/C][C]0.085216[/C][/ROW]
[ROW][C]M4[/C][C]-0.196974789915966[/C][C]0.264217[/C][C]-0.7455[/C][C]0.45976[/C][C]0.22988[/C][/ROW]
[ROW][C]M5[/C][C]0.0344537815126055[/C][C]0.264022[/C][C]0.1305[/C][C]0.896743[/C][C]0.448372[/C][/ROW]
[ROW][C]M6[/C][C]0.0458823529411772[/C][C]0.263957[/C][C]0.1738[/C][C]0.862766[/C][C]0.431383[/C][/ROW]
[ROW][C]M7[/C][C]-0.102689075630251[/C][C]0.264022[/C][C]-0.3889[/C][C]0.699114[/C][C]0.349557[/C][/ROW]
[ROW][C]M8[/C][C]-0.331260504201680[/C][C]0.264217[/C][C]-1.2537[/C][C]0.216269[/C][C]0.108135[/C][/ROW]
[ROW][C]M9[/C][C]-0.539831932773108[/C][C]0.264541[/C][C]-2.0406[/C][C]0.047051[/C][C]0.023525[/C][/ROW]
[ROW][C]M10[/C][C]-0.588403361344538[/C][C]0.264995[/C][C]-2.2204[/C][C]0.031356[/C][C]0.015678[/C][/ROW]
[ROW][C]M11[/C][C]-0.131428571428571[/C][C]0.263057[/C][C]-0.4996[/C][C]0.619724[/C][C]0.309862[/C][/ROW]
[ROW][C]t[/C][C]-0.0514285714285714[/C][C]0.005857[/C][C]-8.7803[/C][C]0[/C][C]0[/C][/ROW]
[/TABLE]
Source: https://freestatistics.org/blog/index.php?pk=25552&T=2

Globally Unique Identifier (entire table): ba.freestatistics.org/blog/index.php?pk=25552&T=2

As an alternative you can also use a QR Code:  

The GUIDs for individual cells are displayed in the table below:

Multiple Linear Regression - Ordinary Least Squares
VariableParameterS.D.T-STATH0: parameter = 02-tail p-value1-tail p-value
(Intercept)9.213613445378140.21831142.20400
x0.8722689075630260.2087854.17780.000136.5e-05
M1-0.1312605042016860.265577-0.49420.6234840.311742
M2-0.2998319327731090.264995-1.13150.2637240.131862
M3-0.3684033613445370.264541-1.39260.1704320.085216
M4-0.1969747899159660.264217-0.74550.459760.22988
M50.03445378151260550.2640220.13050.8967430.448372
M60.04588235294117720.2639570.17380.8627660.431383
M7-0.1026890756302510.264022-0.38890.6991140.349557
M8-0.3312605042016800.264217-1.25370.2162690.108135
M9-0.5398319327731080.264541-2.04060.0470510.023525
M10-0.5884033613445380.264995-2.22040.0313560.015678
M11-0.1314285714285710.263057-0.49960.6197240.309862
t-0.05142857142857140.005857-8.780300


Multiple Linear Regression - Regression Statistics
Multiple R0.867016950491026
R-squared0.751718392438757
Adjusted R-squared0.68155185117145
F-TEST (value)10.7133454045426
F-TEST (DF numerator)13
F-TEST (DF denominator)46
p-value5.98915250726861e-10
Multiple Linear Regression - Residual Statistics
Residual Standard Deviation0.415826823795257
Sum Squared Residuals7.95394957983198

\begin{tabular}{lllllllll}
\hline
Multiple Linear Regression - Regression Statistics \tabularnewline
Multiple R & 0.867016950491026 \tabularnewline
R-squared & 0.751718392438757 \tabularnewline
Adjusted R-squared & 0.68155185117145 \tabularnewline
F-TEST (value) & 10.7133454045426 \tabularnewline
F-TEST (DF numerator) & 13 \tabularnewline
F-TEST (DF denominator) & 46 \tabularnewline
p-value & 5.98915250726861e-10 \tabularnewline
Multiple Linear Regression - Residual Statistics \tabularnewline
Residual Standard Deviation & 0.415826823795257 \tabularnewline
Sum Squared Residuals & 7.95394957983198 \tabularnewline
\hline
\end{tabular}
%Source: https://freestatistics.org/blog/index.php?pk=25552&T=3

[TABLE]
[ROW][C]Multiple Linear Regression - Regression Statistics[/C][/ROW]
[ROW][C]Multiple R[/C][C]0.867016950491026[/C][/ROW]
[ROW][C]R-squared[/C][C]0.751718392438757[/C][/ROW]
[ROW][C]Adjusted R-squared[/C][C]0.68155185117145[/C][/ROW]
[ROW][C]F-TEST (value)[/C][C]10.7133454045426[/C][/ROW]
[ROW][C]F-TEST (DF numerator)[/C][C]13[/C][/ROW]
[ROW][C]F-TEST (DF denominator)[/C][C]46[/C][/ROW]
[ROW][C]p-value[/C][C]5.98915250726861e-10[/C][/ROW]
[ROW][C]Multiple Linear Regression - Residual Statistics[/C][/ROW]
[ROW][C]Residual Standard Deviation[/C][C]0.415826823795257[/C][/ROW]
[ROW][C]Sum Squared Residuals[/C][C]7.95394957983198[/C][/ROW]
[/TABLE]
Source: https://freestatistics.org/blog/index.php?pk=25552&T=3

Globally Unique Identifier (entire table): ba.freestatistics.org/blog/index.php?pk=25552&T=3

As an alternative you can also use a QR Code:  

The GUIDs for individual cells are displayed in the table below:

Multiple Linear Regression - Regression Statistics
Multiple R0.867016950491026
R-squared0.751718392438757
Adjusted R-squared0.68155185117145
F-TEST (value)10.7133454045426
F-TEST (DF numerator)13
F-TEST (DF denominator)46
p-value5.98915250726861e-10
Multiple Linear Regression - Residual Statistics
Residual Standard Deviation0.415826823795257
Sum Squared Residuals7.95394957983198


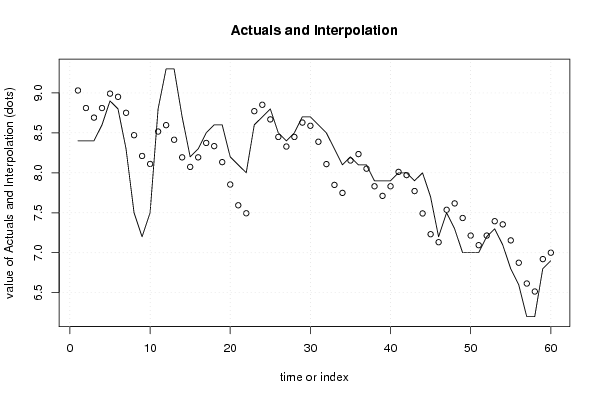
Multiple Linear Regression - Actuals, Interpolation, and Residuals
Time or IndexActualsInterpolationForecastResidualsPrediction Error
18.49.03092436974793-0.630924369747925
28.48.8109243697479-0.410924369747902
38.48.6909243697479-0.290924369747898
48.68.8109243697479-0.210924369747898
58.98.9909243697479-0.0909243697478978
68.88.9509243697479-0.150924369747896
78.38.7509243697479-0.450924369747897
87.58.4709243697479-0.970924369747898
97.28.2109243697479-1.01092436974790
107.58.1109243697479-0.610924369747899
118.88.51647058823530.283529411764707
129.38.59647058823530.703529411764709
139.38.413781512605040.886218487394966
148.78.193781512605040.506218487394959
158.28.073781512605040.126218487394958
168.38.193781512605040.106218487394959
178.58.373781512605040.126218487394959
188.68.333781512605040.266218487394958
198.68.133781512605040.466218487394958
208.27.853781512605040.346218487394958
218.17.593781512605040.506218487394958
2287.493781512605040.506218487394959
238.68.77159663865546-0.171596638655462
248.78.85159663865546-0.151596638655462
258.88.66890756302520.131092436974797
268.58.44890756302520.0510924369747912
278.48.328907563025210.0710924369747904
288.58.448907563025210.0510924369747898
298.78.628907563025210.0710924369747896
308.78.58890756302520.111092436974790
318.68.388907563025210.21109243697479
328.58.10890756302520.391092436974791
338.37.848907563025210.451092436974791
348.17.748907563025210.35109243697479
358.28.15445378151260.0455462184873946
368.18.2344537815126-0.134453781512605
378.18.051764705882350.0482352941176525
387.97.831764705882350.0682352941176479
397.97.711764705882350.188235294117647
407.97.831764705882350.0682352941176468
4188.01176470588235-0.0117647058823532
4287.971764705882350.0282352941176468
437.97.771764705882350.128235294117647
4487.491764705882350.508235294117647
457.77.231764705882350.468235294117646
467.27.131764705882350.0682352941176468
477.57.53731092436975-0.0373109243697483
487.37.61731092436975-0.317310924369749
4977.43462184873949-0.434621848739491
5077.2146218487395-0.214621848739496
5177.0946218487395-0.0946218487394972
527.27.2146218487395-0.0146218487394974
537.37.3946218487395-0.0946218487394973
547.17.3546218487395-0.254621848739497
556.87.1546218487395-0.354621848739497
566.66.8746218487395-0.274621848739497
576.26.6146218487395-0.414621848739497
586.26.5146218487395-0.314621848739497
596.86.9201680672269-0.120168067226893
606.97.00016806722689-0.100168067226892

\begin{tabular}{lllllllll}
\hline
Multiple Linear Regression - Actuals, Interpolation, and Residuals \tabularnewline
Time or Index & Actuals & InterpolationForecast & ResidualsPrediction Error \tabularnewline
1 & 8.4 & 9.03092436974793 & -0.630924369747925 \tabularnewline
2 & 8.4 & 8.8109243697479 & -0.410924369747902 \tabularnewline
3 & 8.4 & 8.6909243697479 & -0.290924369747898 \tabularnewline
4 & 8.6 & 8.8109243697479 & -0.210924369747898 \tabularnewline
5 & 8.9 & 8.9909243697479 & -0.0909243697478978 \tabularnewline
6 & 8.8 & 8.9509243697479 & -0.150924369747896 \tabularnewline
7 & 8.3 & 8.7509243697479 & -0.450924369747897 \tabularnewline
8 & 7.5 & 8.4709243697479 & -0.970924369747898 \tabularnewline
9 & 7.2 & 8.2109243697479 & -1.01092436974790 \tabularnewline
10 & 7.5 & 8.1109243697479 & -0.610924369747899 \tabularnewline
11 & 8.8 & 8.5164705882353 & 0.283529411764707 \tabularnewline
12 & 9.3 & 8.5964705882353 & 0.703529411764709 \tabularnewline
13 & 9.3 & 8.41378151260504 & 0.886218487394966 \tabularnewline
14 & 8.7 & 8.19378151260504 & 0.506218487394959 \tabularnewline
15 & 8.2 & 8.07378151260504 & 0.126218487394958 \tabularnewline
16 & 8.3 & 8.19378151260504 & 0.106218487394959 \tabularnewline
17 & 8.5 & 8.37378151260504 & 0.126218487394959 \tabularnewline
18 & 8.6 & 8.33378151260504 & 0.266218487394958 \tabularnewline
19 & 8.6 & 8.13378151260504 & 0.466218487394958 \tabularnewline
20 & 8.2 & 7.85378151260504 & 0.346218487394958 \tabularnewline
21 & 8.1 & 7.59378151260504 & 0.506218487394958 \tabularnewline
22 & 8 & 7.49378151260504 & 0.506218487394959 \tabularnewline
23 & 8.6 & 8.77159663865546 & -0.171596638655462 \tabularnewline
24 & 8.7 & 8.85159663865546 & -0.151596638655462 \tabularnewline
25 & 8.8 & 8.6689075630252 & 0.131092436974797 \tabularnewline
26 & 8.5 & 8.4489075630252 & 0.0510924369747912 \tabularnewline
27 & 8.4 & 8.32890756302521 & 0.0710924369747904 \tabularnewline
28 & 8.5 & 8.44890756302521 & 0.0510924369747898 \tabularnewline
29 & 8.7 & 8.62890756302521 & 0.0710924369747896 \tabularnewline
30 & 8.7 & 8.5889075630252 & 0.111092436974790 \tabularnewline
31 & 8.6 & 8.38890756302521 & 0.21109243697479 \tabularnewline
32 & 8.5 & 8.1089075630252 & 0.391092436974791 \tabularnewline
33 & 8.3 & 7.84890756302521 & 0.451092436974791 \tabularnewline
34 & 8.1 & 7.74890756302521 & 0.35109243697479 \tabularnewline
35 & 8.2 & 8.1544537815126 & 0.0455462184873946 \tabularnewline
36 & 8.1 & 8.2344537815126 & -0.134453781512605 \tabularnewline
37 & 8.1 & 8.05176470588235 & 0.0482352941176525 \tabularnewline
38 & 7.9 & 7.83176470588235 & 0.0682352941176479 \tabularnewline
39 & 7.9 & 7.71176470588235 & 0.188235294117647 \tabularnewline
40 & 7.9 & 7.83176470588235 & 0.0682352941176468 \tabularnewline
41 & 8 & 8.01176470588235 & -0.0117647058823532 \tabularnewline
42 & 8 & 7.97176470588235 & 0.0282352941176468 \tabularnewline
43 & 7.9 & 7.77176470588235 & 0.128235294117647 \tabularnewline
44 & 8 & 7.49176470588235 & 0.508235294117647 \tabularnewline
45 & 7.7 & 7.23176470588235 & 0.468235294117646 \tabularnewline
46 & 7.2 & 7.13176470588235 & 0.0682352941176468 \tabularnewline
47 & 7.5 & 7.53731092436975 & -0.0373109243697483 \tabularnewline
48 & 7.3 & 7.61731092436975 & -0.317310924369749 \tabularnewline
49 & 7 & 7.43462184873949 & -0.434621848739491 \tabularnewline
50 & 7 & 7.2146218487395 & -0.214621848739496 \tabularnewline
51 & 7 & 7.0946218487395 & -0.0946218487394972 \tabularnewline
52 & 7.2 & 7.2146218487395 & -0.0146218487394974 \tabularnewline
53 & 7.3 & 7.3946218487395 & -0.0946218487394973 \tabularnewline
54 & 7.1 & 7.3546218487395 & -0.254621848739497 \tabularnewline
55 & 6.8 & 7.1546218487395 & -0.354621848739497 \tabularnewline
56 & 6.6 & 6.8746218487395 & -0.274621848739497 \tabularnewline
57 & 6.2 & 6.6146218487395 & -0.414621848739497 \tabularnewline
58 & 6.2 & 6.5146218487395 & -0.314621848739497 \tabularnewline
59 & 6.8 & 6.9201680672269 & -0.120168067226893 \tabularnewline
60 & 6.9 & 7.00016806722689 & -0.100168067226892 \tabularnewline
\hline
\end{tabular}
%Source: https://freestatistics.org/blog/index.php?pk=25552&T=4

[TABLE]
[ROW][C]Multiple Linear Regression - Actuals, Interpolation, and Residuals[/C][/ROW]
[ROW][C]Time or Index[/C][C]Actuals[/C][C]InterpolationForecast[/C][C]ResidualsPrediction Error[/C][/ROW]
[ROW][C]1[/C][C]8.4[/C][C]9.03092436974793[/C][C]-0.630924369747925[/C][/ROW]
[ROW][C]2[/C][C]8.4[/C][C]8.8109243697479[/C][C]-0.410924369747902[/C][/ROW]
[ROW][C]3[/C][C]8.4[/C][C]8.6909243697479[/C][C]-0.290924369747898[/C][/ROW]
[ROW][C]4[/C][C]8.6[/C][C]8.8109243697479[/C][C]-0.210924369747898[/C][/ROW]
[ROW][C]5[/C][C]8.9[/C][C]8.9909243697479[/C][C]-0.0909243697478978[/C][/ROW]
[ROW][C]6[/C][C]8.8[/C][C]8.9509243697479[/C][C]-0.150924369747896[/C][/ROW]
[ROW][C]7[/C][C]8.3[/C][C]8.7509243697479[/C][C]-0.450924369747897[/C][/ROW]
[ROW][C]8[/C][C]7.5[/C][C]8.4709243697479[/C][C]-0.970924369747898[/C][/ROW]
[ROW][C]9[/C][C]7.2[/C][C]8.2109243697479[/C][C]-1.01092436974790[/C][/ROW]
[ROW][C]10[/C][C]7.5[/C][C]8.1109243697479[/C][C]-0.610924369747899[/C][/ROW]
[ROW][C]11[/C][C]8.8[/C][C]8.5164705882353[/C][C]0.283529411764707[/C][/ROW]
[ROW][C]12[/C][C]9.3[/C][C]8.5964705882353[/C][C]0.703529411764709[/C][/ROW]
[ROW][C]13[/C][C]9.3[/C][C]8.41378151260504[/C][C]0.886218487394966[/C][/ROW]
[ROW][C]14[/C][C]8.7[/C][C]8.19378151260504[/C][C]0.506218487394959[/C][/ROW]
[ROW][C]15[/C][C]8.2[/C][C]8.07378151260504[/C][C]0.126218487394958[/C][/ROW]
[ROW][C]16[/C][C]8.3[/C][C]8.19378151260504[/C][C]0.106218487394959[/C][/ROW]
[ROW][C]17[/C][C]8.5[/C][C]8.37378151260504[/C][C]0.126218487394959[/C][/ROW]
[ROW][C]18[/C][C]8.6[/C][C]8.33378151260504[/C][C]0.266218487394958[/C][/ROW]
[ROW][C]19[/C][C]8.6[/C][C]8.13378151260504[/C][C]0.466218487394958[/C][/ROW]
[ROW][C]20[/C][C]8.2[/C][C]7.85378151260504[/C][C]0.346218487394958[/C][/ROW]
[ROW][C]21[/C][C]8.1[/C][C]7.59378151260504[/C][C]0.506218487394958[/C][/ROW]
[ROW][C]22[/C][C]8[/C][C]7.49378151260504[/C][C]0.506218487394959[/C][/ROW]
[ROW][C]23[/C][C]8.6[/C][C]8.77159663865546[/C][C]-0.171596638655462[/C][/ROW]
[ROW][C]24[/C][C]8.7[/C][C]8.85159663865546[/C][C]-0.151596638655462[/C][/ROW]
[ROW][C]25[/C][C]8.8[/C][C]8.6689075630252[/C][C]0.131092436974797[/C][/ROW]
[ROW][C]26[/C][C]8.5[/C][C]8.4489075630252[/C][C]0.0510924369747912[/C][/ROW]
[ROW][C]27[/C][C]8.4[/C][C]8.32890756302521[/C][C]0.0710924369747904[/C][/ROW]
[ROW][C]28[/C][C]8.5[/C][C]8.44890756302521[/C][C]0.0510924369747898[/C][/ROW]
[ROW][C]29[/C][C]8.7[/C][C]8.62890756302521[/C][C]0.0710924369747896[/C][/ROW]
[ROW][C]30[/C][C]8.7[/C][C]8.5889075630252[/C][C]0.111092436974790[/C][/ROW]
[ROW][C]31[/C][C]8.6[/C][C]8.38890756302521[/C][C]0.21109243697479[/C][/ROW]
[ROW][C]32[/C][C]8.5[/C][C]8.1089075630252[/C][C]0.391092436974791[/C][/ROW]
[ROW][C]33[/C][C]8.3[/C][C]7.84890756302521[/C][C]0.451092436974791[/C][/ROW]
[ROW][C]34[/C][C]8.1[/C][C]7.74890756302521[/C][C]0.35109243697479[/C][/ROW]
[ROW][C]35[/C][C]8.2[/C][C]8.1544537815126[/C][C]0.0455462184873946[/C][/ROW]
[ROW][C]36[/C][C]8.1[/C][C]8.2344537815126[/C][C]-0.134453781512605[/C][/ROW]
[ROW][C]37[/C][C]8.1[/C][C]8.05176470588235[/C][C]0.0482352941176525[/C][/ROW]
[ROW][C]38[/C][C]7.9[/C][C]7.83176470588235[/C][C]0.0682352941176479[/C][/ROW]
[ROW][C]39[/C][C]7.9[/C][C]7.71176470588235[/C][C]0.188235294117647[/C][/ROW]
[ROW][C]40[/C][C]7.9[/C][C]7.83176470588235[/C][C]0.0682352941176468[/C][/ROW]
[ROW][C]41[/C][C]8[/C][C]8.01176470588235[/C][C]-0.0117647058823532[/C][/ROW]
[ROW][C]42[/C][C]8[/C][C]7.97176470588235[/C][C]0.0282352941176468[/C][/ROW]
[ROW][C]43[/C][C]7.9[/C][C]7.77176470588235[/C][C]0.128235294117647[/C][/ROW]
[ROW][C]44[/C][C]8[/C][C]7.49176470588235[/C][C]0.508235294117647[/C][/ROW]
[ROW][C]45[/C][C]7.7[/C][C]7.23176470588235[/C][C]0.468235294117646[/C][/ROW]
[ROW][C]46[/C][C]7.2[/C][C]7.13176470588235[/C][C]0.0682352941176468[/C][/ROW]
[ROW][C]47[/C][C]7.5[/C][C]7.53731092436975[/C][C]-0.0373109243697483[/C][/ROW]
[ROW][C]48[/C][C]7.3[/C][C]7.61731092436975[/C][C]-0.317310924369749[/C][/ROW]
[ROW][C]49[/C][C]7[/C][C]7.43462184873949[/C][C]-0.434621848739491[/C][/ROW]
[ROW][C]50[/C][C]7[/C][C]7.2146218487395[/C][C]-0.214621848739496[/C][/ROW]
[ROW][C]51[/C][C]7[/C][C]7.0946218487395[/C][C]-0.0946218487394972[/C][/ROW]
[ROW][C]52[/C][C]7.2[/C][C]7.2146218487395[/C][C]-0.0146218487394974[/C][/ROW]
[ROW][C]53[/C][C]7.3[/C][C]7.3946218487395[/C][C]-0.0946218487394973[/C][/ROW]
[ROW][C]54[/C][C]7.1[/C][C]7.3546218487395[/C][C]-0.254621848739497[/C][/ROW]
[ROW][C]55[/C][C]6.8[/C][C]7.1546218487395[/C][C]-0.354621848739497[/C][/ROW]
[ROW][C]56[/C][C]6.6[/C][C]6.8746218487395[/C][C]-0.274621848739497[/C][/ROW]
[ROW][C]57[/C][C]6.2[/C][C]6.6146218487395[/C][C]-0.414621848739497[/C][/ROW]
[ROW][C]58[/C][C]6.2[/C][C]6.5146218487395[/C][C]-0.314621848739497[/C][/ROW]
[ROW][C]59[/C][C]6.8[/C][C]6.9201680672269[/C][C]-0.120168067226893[/C][/ROW]
[ROW][C]60[/C][C]6.9[/C][C]7.00016806722689[/C][C]-0.100168067226892[/C][/ROW]
[/TABLE]
Source: https://freestatistics.org/blog/index.php?pk=25552&T=4

Globally Unique Identifier (entire table): ba.freestatistics.org/blog/index.php?pk=25552&T=4

As an alternative you can also use a QR Code:  

The GUIDs for individual cells are displayed in the table below:

Multiple Linear Regression - Actuals, Interpolation, and Residuals
Time or IndexActualsInterpolationForecastResidualsPrediction Error
18.49.03092436974793-0.630924369747925
28.48.8109243697479-0.410924369747902
38.48.6909243697479-0.290924369747898
48.68.8109243697479-0.210924369747898
58.98.9909243697479-0.0909243697478978
68.88.9509243697479-0.150924369747896
78.38.7509243697479-0.450924369747897
87.58.4709243697479-0.970924369747898
97.28.2109243697479-1.01092436974790
107.58.1109243697479-0.610924369747899
118.88.51647058823530.283529411764707
129.38.59647058823530.703529411764709
139.38.413781512605040.886218487394966
148.78.193781512605040.506218487394959
158.28.073781512605040.126218487394958
168.38.193781512605040.106218487394959
178.58.373781512605040.126218487394959
188.68.333781512605040.266218487394958
198.68.133781512605040.466218487394958
208.27.853781512605040.346218487394958
218.17.593781512605040.506218487394958
2287.493781512605040.506218487394959
238.68.77159663865546-0.171596638655462
248.78.85159663865546-0.151596638655462
258.88.66890756302520.131092436974797
268.58.44890756302520.0510924369747912
278.48.328907563025210.0710924369747904
288.58.448907563025210.0510924369747898
298.78.628907563025210.0710924369747896
308.78.58890756302520.111092436974790
318.68.388907563025210.21109243697479
328.58.10890756302520.391092436974791
338.37.848907563025210.451092436974791
348.17.748907563025210.35109243697479
358.28.15445378151260.0455462184873946
368.18.2344537815126-0.134453781512605
378.18.051764705882350.0482352941176525
387.97.831764705882350.0682352941176479
397.97.711764705882350.188235294117647
407.97.831764705882350.0682352941176468
4188.01176470588235-0.0117647058823532
4287.971764705882350.0282352941176468
437.97.771764705882350.128235294117647
4487.491764705882350.508235294117647
457.77.231764705882350.468235294117646
467.27.131764705882350.0682352941176468
477.57.53731092436975-0.0373109243697483
487.37.61731092436975-0.317310924369749
4977.43462184873949-0.434621848739491
5077.2146218487395-0.214621848739496
5177.0946218487395-0.0946218487394972
527.27.2146218487395-0.0146218487394974
537.37.3946218487395-0.0946218487394973
547.17.3546218487395-0.254621848739497
556.87.1546218487395-0.354621848739497
566.66.8746218487395-0.274621848739497
576.26.6146218487395-0.414621848739497
586.26.5146218487395-0.314621848739497
596.86.9201680672269-0.120168067226893
606.97.00016806722689-0.100168067226892


Parameters (Session):
par1 = 1 ; par2 = Include Monthly Dummies ; par3 = Linear Trend ;
Parameters (R input):
par1 = 1 ; par2 = Include Monthly Dummies ; par3 = Linear Trend ;
R code (references can be found in the software module):
library(lattice)
par1 <- as.numeric(par1)
x <- t(y)
k <- length(x[1,])
n <- length(x[,1])
x1 <- cbind(x[,par1], x[,1:k!=par1])
mycolnames <- c(colnames(x)[par1], colnames(x)[1:k!=par1])
colnames(x1) <- mycolnames #colnames(x)[par1]
x <- x1
if (par3 == 'First Differences'){
x2 <- array(0, dim=c(n-1,k), dimnames=list(1:(n-1), paste('(1-B)',colnames(x),sep='')))
for (i in 1:n-1) {
for (j in 1:k) {
x2[i,j] <- x[i+1,j] - x[i,j]
}
}
x <- x2
}
if (par2 == 'Include Monthly Dummies'){
x2 <- array(0, dim=c(n,11), dimnames=list(1:n, paste('M', seq(1:11), sep ='')))
for (i in 1:11){
x2[seq(i,n,12),i] <- 1
}
x <- cbind(x, x2)
}
if (par2 == 'Include Quarterly Dummies'){
x2 <- array(0, dim=c(n,3), dimnames=list(1:n, paste('Q', seq(1:3), sep ='')))
for (i in 1:3){
x2[seq(i,n,4),i] <- 1
}
x <- cbind(x, x2)
}
k <- length(x[1,])
if (par3 == 'Linear Trend'){
x <- cbind(x, c(1:n))
colnames(x)[k+1] <- 't'
}
x
k <- length(x[1,])
df <- as.data.frame(x)
(mylm <- lm(df))
(mysum <- summary(mylm))
bitmap(file='test0.png')
plot(x[,1], type='l', main='Actuals and Interpolation', ylab='value of Actuals and Interpolation (dots)', xlab='time or index')
points(x[,1]-mysum$resid)
grid()
dev.off()
bitmap(file='test1.png')
plot(mysum$resid, type='b', pch=19, main='Residuals', ylab='value of Residuals', xlab='time or index')
grid()
dev.off()
bitmap(file='test2.png')
hist(mysum$resid, main='Residual Histogram', xlab='values of Residuals')
grid()
dev.off()
bitmap(file='test3.png')
densityplot(~mysum$resid,col='black',main='Residual Density Plot', xlab='values of Residuals')
dev.off()
bitmap(file='test4.png')
qqnorm(mysum$resid, main='Residual Normal Q-Q Plot')
grid()
dev.off()
(myerror <- as.ts(mysum$resid))
bitmap(file='test5.png')
dum <- cbind(lag(myerror,k=1),myerror)
dum
dum1 <- dum[2:length(myerror),]
dum1
z <- as.data.frame(dum1)
z
plot(z,main=paste('Residual Lag plot, lowess, and regression line'), ylab='values of Residuals', xlab='lagged values of Residuals')
lines(lowess(z))
abline(lm(z))
grid()
dev.off()
bitmap(file='test6.png')
acf(mysum$resid, lag.max=length(mysum$resid)/2, main='Residual Autocorrelation Function')
grid()
dev.off()
bitmap(file='test7.png')
pacf(mysum$resid, lag.max=length(mysum$resid)/2, main='Residual Partial Autocorrelation Function')
grid()
dev.off()
bitmap(file='test8.png')
opar <- par(mfrow = c(2,2), oma = c(0, 0, 1.1, 0))
plot(mylm, las = 1, sub='Residual Diagnostics')
par(opar)
dev.off()
load(file='createtable')
a<-table.start()
a<-table.row.start(a)
a<-table.element(a, 'Multiple Linear Regression - Estimated Regression Equation', 1, TRUE)
a<-table.row.end(a)
myeq <- colnames(x)[1]
myeq <- paste(myeq, '[t] = ', sep='')
for (i in 1:k){
if (mysum$coefficients[i,1] > 0) myeq <- paste(myeq, '+', '')
myeq <- paste(myeq, mysum$coefficients[i,1], sep=' ')
if (rownames(mysum$coefficients)[i] != '(Intercept)') {
myeq <- paste(myeq, rownames(mysum$coefficients)[i], sep='')
if (rownames(mysum$coefficients)[i] != 't') myeq <- paste(myeq, '[t]', sep='')
}
}
myeq <- paste(myeq, ' + e[t]')
a<-table.row.start(a)
a<-table.element(a, myeq)
a<-table.row.end(a)
a<-table.end(a)
table.save(a,file='mytable1.tab')
a<-table.start()
a<-table.row.start(a)
a<-table.element(a,hyperlink('ols1.htm','Multiple Linear Regression - Ordinary Least Squares',''), 6, TRUE)
a<-table.row.end(a)
a<-table.row.start(a)
a<-table.element(a,'Variable',header=TRUE)
a<-table.element(a,'Parameter',header=TRUE)
a<-table.element(a,'S.D.',header=TRUE)
a<-table.element(a,'T-STAT
H0: parameter = 0',header=TRUE)
a<-table.element(a,'2-tail p-value',header=TRUE)
a<-table.element(a,'1-tail p-value',header=TRUE)
a<-table.row.end(a)
for (i in 1:k){
a<-table.row.start(a)
a<-table.element(a,rownames(mysum$coefficients)[i],header=TRUE)
a<-table.element(a,mysum$coefficients[i,1])
a<-table.element(a, round(mysum$coefficients[i,2],6))
a<-table.element(a, round(mysum$coefficients[i,3],4))
a<-table.element(a, round(mysum$coefficients[i,4],6))
a<-table.element(a, round(mysum$coefficients[i,4]/2,6))
a<-table.row.end(a)
}
a<-table.end(a)
table.save(a,file='mytable2.tab')
a<-table.start()
a<-table.row.start(a)
a<-table.element(a, 'Multiple Linear Regression - Regression Statistics', 2, TRUE)
a<-table.row.end(a)
a<-table.row.start(a)
a<-table.element(a, 'Multiple R',1,TRUE)
a<-table.element(a, sqrt(mysum$r.squared))
a<-table.row.end(a)
a<-table.row.start(a)
a<-table.element(a, 'R-squared',1,TRUE)
a<-table.element(a, mysum$r.squared)
a<-table.row.end(a)
a<-table.row.start(a)
a<-table.element(a, 'Adjusted R-squared',1,TRUE)
a<-table.element(a, mysum$adj.r.squared)
a<-table.row.end(a)
a<-table.row.start(a)
a<-table.element(a, 'F-TEST (value)',1,TRUE)
a<-table.element(a, mysum$fstatistic[1])
a<-table.row.end(a)
a<-table.row.start(a)
a<-table.element(a, 'F-TEST (DF numerator)',1,TRUE)
a<-table.element(a, mysum$fstatistic[2])
a<-table.row.end(a)
a<-table.row.start(a)
a<-table.element(a, 'F-TEST (DF denominator)',1,TRUE)
a<-table.element(a, mysum$fstatistic[3])
a<-table.row.end(a)
a<-table.row.start(a)
a<-table.element(a, 'p-value',1,TRUE)
a<-table.element(a, 1-pf(mysum$fstatistic[1],mysum$fstatistic[2],mysum$fstatistic[3]))
a<-table.row.end(a)
a<-table.row.start(a)
a<-table.element(a, 'Multiple Linear Regression - Residual Statistics', 2, TRUE)
a<-table.row.end(a)
a<-table.row.start(a)
a<-table.element(a, 'Residual Standard Deviation',1,TRUE)
a<-table.element(a, mysum$sigma)
a<-table.row.end(a)
a<-table.row.start(a)
a<-table.element(a, 'Sum Squared Residuals',1,TRUE)
a<-table.element(a, sum(myerror*myerror))
a<-table.row.end(a)
a<-table.end(a)
table.save(a,file='mytable3.tab')
a<-table.start()
a<-table.row.start(a)
a<-table.element(a, 'Multiple Linear Regression - Actuals, Interpolation, and Residuals', 4, TRUE)
a<-table.row.end(a)
a<-table.row.start(a)
a<-table.element(a, 'Time or Index', 1, TRUE)
a<-table.element(a, 'Actuals', 1, TRUE)
a<-table.element(a, 'Interpolation
Forecast', 1, TRUE)
a<-table.element(a, 'Residuals
Prediction Error', 1, TRUE)
a<-table.row.end(a)
for (i in 1:n) {
a<-table.row.start(a)
a<-table.element(a,i, 1, TRUE)
a<-table.element(a,x[i])
a<-table.element(a,x[i]-mysum$resid[i])
a<-table.element(a,mysum$resid[i])
a<-table.row.end(a)
}
a<-table.end(a)
table.save(a,file='mytable4.tab')