Free Statistics

of Irreproducible Research!

Author's title

Author*The author of this computation has been verified*
R Software Modulerwasp_multipleregression.wasp
Title produced by softwareMultiple Regression
Date of computationMon, 24 Nov 2008 14:13:49 -0700
Cite this page as followsStatistical Computations at FreeStatistics.org, Office for Research Development and Education, URL https://freestatistics.org/blog/index.php?v=date/2008/Nov/24/t1227561398facwhwav9u1dbab.htm/, Retrieved Tue, 14 May 2024 09:17:26 +0000
Statistical Computations at FreeStatistics.org, Office for Research Development and Education, URL https://freestatistics.org/blog/index.php?pk=25540, Retrieved Tue, 14 May 2024 09:17:26 +0000
QR Codes:

Original text written by user:
IsPrivate?No (this computation is public)
User-defined keywords
Estimated Impact155
Family? (F = Feedback message, R = changed R code, M = changed R Module, P = changed Parameters, D = changed Data)
F     [Multiple Regression] [Q1 Seatbelt, no t...] [2008-11-24 10:11:24] [deb3c14ac9e4607a6d84fc9d0e0e6cc2]
-    D    [Multiple Regression] [Q3 Reeks 1, no tr...] [2008-11-24 21:13:49] [5e9e099b83e50415d7642e10d74756e4] [Current]
-   P       [Multiple Regression] [Q3 Reeks 1, trend...] [2008-11-24 21:18:00] [deb3c14ac9e4607a6d84fc9d0e0e6cc2]
-   P         [Multiple Regression] [Q3 Reeks 1, no tr...] [2008-11-24 21:20:12] [deb3c14ac9e4607a6d84fc9d0e0e6cc2]
F   P           [Multiple Regression] [Q3 Reeks 1, trend...] [2008-11-24 21:23:20] [deb3c14ac9e4607a6d84fc9d0e0e6cc2]
Feedback Forum

Post a new message
Dataseries X:
577992	0
565464	0
547344	0
554788	0
562325	0
560854	0
555332	1
543599	1
536662	1
542722	1
593530	1
610763	1
612613	1
611324	1
594167	1
595454	1
590865	1
589379	1
584428	1
573100	1
567456	1
569028	1
620735	1
628884	1
628232	1
612117	1
595404	1
597141	1
593408	1
590072	1
579799	1
574205	1
572775	1
572942	1
619567	1
625809	1
619916	1
587625	1
565742	1
557274	1
560576	1
548854	1
531673	1
525919	1
511038	1
498662	1
555362	1
564591	1
541657	1
527070	1
509846	1
514258	1
516922	1
507561	1
492622	1
490243	1
469357	1
477580	1
528379	1
533590	1
517945	1


Summary of computational transaction
Raw Inputview raw input (R code)
Raw Outputview raw output of R engine
Computing time4 seconds
R Server'George Udny Yule' @ 72.249.76.132

\begin{tabular}{lllllllll}
\hline
Summary of computational transaction \tabularnewline
Raw Input & view raw input (R code)  \tabularnewline
Raw Output & view raw output of R engine  \tabularnewline
Computing time & 4 seconds \tabularnewline
R Server & 'George Udny Yule' @ 72.249.76.132 \tabularnewline
\hline
\end{tabular}
%Source: https://freestatistics.org/blog/index.php?pk=25540&T=0

[TABLE]
[ROW][C]Summary of computational transaction[/C][/ROW]
[ROW][C]Raw Input[/C][C]view raw input (R code) [/C][/ROW]
[ROW][C]Raw Output[/C][C]view raw output of R engine [/C][/ROW]
[ROW][C]Computing time[/C][C]4 seconds[/C][/ROW]
[ROW][C]R Server[/C][C]'George Udny Yule' @ 72.249.76.132[/C][/ROW]
[/TABLE]
Source: https://freestatistics.org/blog/index.php?pk=25540&T=0

Globally Unique Identifier (entire table): ba.freestatistics.org/blog/index.php?pk=25540&T=0

As an alternative you can also use a QR Code:  

The GUIDs for individual cells are displayed in the table below:

Summary of computational transaction
Raw Inputview raw input (R code)
Raw Outputview raw output of R engine
Computing time4 seconds
R Server'George Udny Yule' @ 72.249.76.132


Multiple Linear Regression - Estimated Regression Equation
Werkloosheid[t] = + 561461.166666667 + 1007.45151515155Aanslag[t] + e[t]

\begin{tabular}{lllllllll}
\hline
Multiple Linear Regression - Estimated Regression Equation \tabularnewline
Werkloosheid[t] =  +  561461.166666667 +  1007.45151515155Aanslag[t]  + e[t] \tabularnewline
\hline
\end{tabular}
%Source: https://freestatistics.org/blog/index.php?pk=25540&T=1

[TABLE]
[ROW][C]Multiple Linear Regression - Estimated Regression Equation[/C][/ROW]
[ROW][C]Werkloosheid[t] =  +  561461.166666667 +  1007.45151515155Aanslag[t]  + e[t][/C][/ROW]
[/TABLE]
Source: https://freestatistics.org/blog/index.php?pk=25540&T=1

Globally Unique Identifier (entire table): ba.freestatistics.org/blog/index.php?pk=25540&T=1

As an alternative you can also use a QR Code:  

The GUIDs for individual cells are displayed in the table below:

Multiple Linear Regression - Estimated Regression Equation
Werkloosheid[t] = + 561461.166666667 + 1007.45151515155Aanslag[t] + e[t]


Multiple Linear Regression - Ordinary Least Squares
VariableParameterS.D.T-STATH0: parameter = 02-tail p-value1-tail p-value
(Intercept)561461.16666666716471.49634734.086800
Aanslag1007.4515151515517346.6903870.05810.9538830.476942

\begin{tabular}{lllllllll}
\hline
Multiple Linear Regression - Ordinary Least Squares \tabularnewline
Variable & Parameter & S.D. & T-STATH0: parameter = 0 & 2-tail p-value & 1-tail p-value \tabularnewline
(Intercept) & 561461.166666667 & 16471.496347 & 34.0868 & 0 & 0 \tabularnewline
Aanslag & 1007.45151515155 & 17346.690387 & 0.0581 & 0.953883 & 0.476942 \tabularnewline
\hline
\end{tabular}
%Source: https://freestatistics.org/blog/index.php?pk=25540&T=2

[TABLE]
[ROW][C]Multiple Linear Regression - Ordinary Least Squares[/C][/ROW]
[ROW][C]Variable[/C][C]Parameter[/C][C]S.D.[/C][C]T-STATH0: parameter = 0[/C][C]2-tail p-value[/C][C]1-tail p-value[/C][/ROW]
[ROW][C](Intercept)[/C][C]561461.166666667[/C][C]16471.496347[/C][C]34.0868[/C][C]0[/C][C]0[/C][/ROW]
[ROW][C]Aanslag[/C][C]1007.45151515155[/C][C]17346.690387[/C][C]0.0581[/C][C]0.953883[/C][C]0.476942[/C][/ROW]
[/TABLE]
Source: https://freestatistics.org/blog/index.php?pk=25540&T=2

Globally Unique Identifier (entire table): ba.freestatistics.org/blog/index.php?pk=25540&T=2

As an alternative you can also use a QR Code:  

The GUIDs for individual cells are displayed in the table below:

Multiple Linear Regression - Ordinary Least Squares
VariableParameterS.D.T-STATH0: parameter = 02-tail p-value1-tail p-value
(Intercept)561461.16666666716471.49634734.086800
Aanslag1007.4515151515517346.6903870.05810.9538830.476942


Multiple Linear Regression - Regression Statistics
Multiple R0.00756082363397958
R-squared5.71660540241442e-05
Adjusted R-squared-0.0168910175721788
F-TEST (value)0.00337299000795353
F-TEST (DF numerator)1
F-TEST (DF denominator)59
p-value0.953883193687
Multiple Linear Regression - Residual Statistics
Residual Standard Deviation40346.7613494156
Sum Squared Residuals96043807931.8152

\begin{tabular}{lllllllll}
\hline
Multiple Linear Regression - Regression Statistics \tabularnewline
Multiple R & 0.00756082363397958 \tabularnewline
R-squared & 5.71660540241442e-05 \tabularnewline
Adjusted R-squared & -0.0168910175721788 \tabularnewline
F-TEST (value) & 0.00337299000795353 \tabularnewline
F-TEST (DF numerator) & 1 \tabularnewline
F-TEST (DF denominator) & 59 \tabularnewline
p-value & 0.953883193687 \tabularnewline
Multiple Linear Regression - Residual Statistics \tabularnewline
Residual Standard Deviation & 40346.7613494156 \tabularnewline
Sum Squared Residuals & 96043807931.8152 \tabularnewline
\hline
\end{tabular}
%Source: https://freestatistics.org/blog/index.php?pk=25540&T=3

[TABLE]
[ROW][C]Multiple Linear Regression - Regression Statistics[/C][/ROW]
[ROW][C]Multiple R[/C][C]0.00756082363397958[/C][/ROW]
[ROW][C]R-squared[/C][C]5.71660540241442e-05[/C][/ROW]
[ROW][C]Adjusted R-squared[/C][C]-0.0168910175721788[/C][/ROW]
[ROW][C]F-TEST (value)[/C][C]0.00337299000795353[/C][/ROW]
[ROW][C]F-TEST (DF numerator)[/C][C]1[/C][/ROW]
[ROW][C]F-TEST (DF denominator)[/C][C]59[/C][/ROW]
[ROW][C]p-value[/C][C]0.953883193687[/C][/ROW]
[ROW][C]Multiple Linear Regression - Residual Statistics[/C][/ROW]
[ROW][C]Residual Standard Deviation[/C][C]40346.7613494156[/C][/ROW]
[ROW][C]Sum Squared Residuals[/C][C]96043807931.8152[/C][/ROW]
[/TABLE]
Source: https://freestatistics.org/blog/index.php?pk=25540&T=3

Globally Unique Identifier (entire table): ba.freestatistics.org/blog/index.php?pk=25540&T=3

As an alternative you can also use a QR Code:  

The GUIDs for individual cells are displayed in the table below:

Multiple Linear Regression - Regression Statistics
Multiple R0.00756082363397958
R-squared5.71660540241442e-05
Adjusted R-squared-0.0168910175721788
F-TEST (value)0.00337299000795353
F-TEST (DF numerator)1
F-TEST (DF denominator)59
p-value0.953883193687
Multiple Linear Regression - Residual Statistics
Residual Standard Deviation40346.7613494156
Sum Squared Residuals96043807931.8152


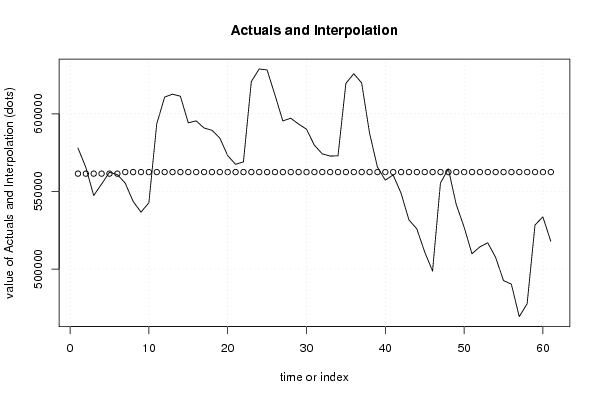
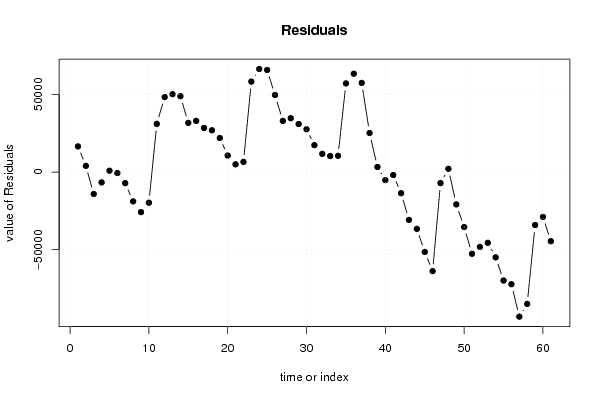
Multiple Linear Regression - Actuals, Interpolation, and Residuals
Time or IndexActualsInterpolationForecastResidualsPrediction Error
1577992561461.16666666716530.8333333333
2565464561461.1666666674002.83333333329
3547344561461.166666667-14117.1666666667
4554788561461.166666667-6673.16666666666
5562325561461.166666667863.833333333343
6560854561461.166666667-607.166666666657
7555332562468.618181818-7136.61818181818
8543599562468.618181818-18869.6181818182
9536662562468.618181818-25806.6181818182
10542722562468.618181818-19746.6181818182
11593530562468.61818181831061.3818181818
12610763562468.61818181848294.3818181818
13612613562468.61818181850144.3818181818
14611324562468.61818181848855.3818181818
15594167562468.61818181831698.3818181818
16595454562468.61818181832985.3818181818
17590865562468.61818181828396.3818181818
18589379562468.61818181826910.3818181818
19584428562468.61818181821959.3818181818
20573100562468.61818181810631.3818181818
21567456562468.6181818184987.38181818182
22569028562468.6181818186559.38181818182
23620735562468.61818181858266.3818181818
24628884562468.61818181866415.3818181818
25628232562468.61818181865763.3818181818
26612117562468.61818181849648.3818181818
27595404562468.61818181832935.3818181818
28597141562468.61818181834672.3818181818
29593408562468.61818181830939.3818181818
30590072562468.61818181827603.3818181818
31579799562468.61818181817330.3818181818
32574205562468.61818181811736.3818181818
33572775562468.61818181810306.3818181818
34572942562468.61818181810473.3818181818
35619567562468.61818181857098.3818181818
36625809562468.61818181863340.3818181818
37619916562468.61818181857447.3818181818
38587625562468.61818181825156.3818181818
39565742562468.6181818183273.38181818182
40557274562468.618181818-5194.61818181818
41560576562468.618181818-1892.61818181818
42548854562468.618181818-13614.6181818182
43531673562468.618181818-30795.6181818182
44525919562468.618181818-36549.6181818182
45511038562468.618181818-51430.6181818182
46498662562468.618181818-63806.6181818182
47555362562468.618181818-7106.61818181818
48564591562468.6181818182122.38181818182
49541657562468.618181818-20811.6181818182
50527070562468.618181818-35398.6181818182
51509846562468.618181818-52622.6181818182
52514258562468.618181818-48210.6181818182
53516922562468.618181818-45546.6181818182
54507561562468.618181818-54907.6181818182
55492622562468.618181818-69846.6181818182
56490243562468.618181818-72225.6181818182
57469357562468.618181818-93111.6181818182
58477580562468.618181818-84888.6181818182
59528379562468.618181818-34089.6181818182
60533590562468.618181818-28878.6181818182
61517945562468.618181818-44523.6181818182

\begin{tabular}{lllllllll}
\hline
Multiple Linear Regression - Actuals, Interpolation, and Residuals \tabularnewline
Time or Index & Actuals & InterpolationForecast & ResidualsPrediction Error \tabularnewline
1 & 577992 & 561461.166666667 & 16530.8333333333 \tabularnewline
2 & 565464 & 561461.166666667 & 4002.83333333329 \tabularnewline
3 & 547344 & 561461.166666667 & -14117.1666666667 \tabularnewline
4 & 554788 & 561461.166666667 & -6673.16666666666 \tabularnewline
5 & 562325 & 561461.166666667 & 863.833333333343 \tabularnewline
6 & 560854 & 561461.166666667 & -607.166666666657 \tabularnewline
7 & 555332 & 562468.618181818 & -7136.61818181818 \tabularnewline
8 & 543599 & 562468.618181818 & -18869.6181818182 \tabularnewline
9 & 536662 & 562468.618181818 & -25806.6181818182 \tabularnewline
10 & 542722 & 562468.618181818 & -19746.6181818182 \tabularnewline
11 & 593530 & 562468.618181818 & 31061.3818181818 \tabularnewline
12 & 610763 & 562468.618181818 & 48294.3818181818 \tabularnewline
13 & 612613 & 562468.618181818 & 50144.3818181818 \tabularnewline
14 & 611324 & 562468.618181818 & 48855.3818181818 \tabularnewline
15 & 594167 & 562468.618181818 & 31698.3818181818 \tabularnewline
16 & 595454 & 562468.618181818 & 32985.3818181818 \tabularnewline
17 & 590865 & 562468.618181818 & 28396.3818181818 \tabularnewline
18 & 589379 & 562468.618181818 & 26910.3818181818 \tabularnewline
19 & 584428 & 562468.618181818 & 21959.3818181818 \tabularnewline
20 & 573100 & 562468.618181818 & 10631.3818181818 \tabularnewline
21 & 567456 & 562468.618181818 & 4987.38181818182 \tabularnewline
22 & 569028 & 562468.618181818 & 6559.38181818182 \tabularnewline
23 & 620735 & 562468.618181818 & 58266.3818181818 \tabularnewline
24 & 628884 & 562468.618181818 & 66415.3818181818 \tabularnewline
25 & 628232 & 562468.618181818 & 65763.3818181818 \tabularnewline
26 & 612117 & 562468.618181818 & 49648.3818181818 \tabularnewline
27 & 595404 & 562468.618181818 & 32935.3818181818 \tabularnewline
28 & 597141 & 562468.618181818 & 34672.3818181818 \tabularnewline
29 & 593408 & 562468.618181818 & 30939.3818181818 \tabularnewline
30 & 590072 & 562468.618181818 & 27603.3818181818 \tabularnewline
31 & 579799 & 562468.618181818 & 17330.3818181818 \tabularnewline
32 & 574205 & 562468.618181818 & 11736.3818181818 \tabularnewline
33 & 572775 & 562468.618181818 & 10306.3818181818 \tabularnewline
34 & 572942 & 562468.618181818 & 10473.3818181818 \tabularnewline
35 & 619567 & 562468.618181818 & 57098.3818181818 \tabularnewline
36 & 625809 & 562468.618181818 & 63340.3818181818 \tabularnewline
37 & 619916 & 562468.618181818 & 57447.3818181818 \tabularnewline
38 & 587625 & 562468.618181818 & 25156.3818181818 \tabularnewline
39 & 565742 & 562468.618181818 & 3273.38181818182 \tabularnewline
40 & 557274 & 562468.618181818 & -5194.61818181818 \tabularnewline
41 & 560576 & 562468.618181818 & -1892.61818181818 \tabularnewline
42 & 548854 & 562468.618181818 & -13614.6181818182 \tabularnewline
43 & 531673 & 562468.618181818 & -30795.6181818182 \tabularnewline
44 & 525919 & 562468.618181818 & -36549.6181818182 \tabularnewline
45 & 511038 & 562468.618181818 & -51430.6181818182 \tabularnewline
46 & 498662 & 562468.618181818 & -63806.6181818182 \tabularnewline
47 & 555362 & 562468.618181818 & -7106.61818181818 \tabularnewline
48 & 564591 & 562468.618181818 & 2122.38181818182 \tabularnewline
49 & 541657 & 562468.618181818 & -20811.6181818182 \tabularnewline
50 & 527070 & 562468.618181818 & -35398.6181818182 \tabularnewline
51 & 509846 & 562468.618181818 & -52622.6181818182 \tabularnewline
52 & 514258 & 562468.618181818 & -48210.6181818182 \tabularnewline
53 & 516922 & 562468.618181818 & -45546.6181818182 \tabularnewline
54 & 507561 & 562468.618181818 & -54907.6181818182 \tabularnewline
55 & 492622 & 562468.618181818 & -69846.6181818182 \tabularnewline
56 & 490243 & 562468.618181818 & -72225.6181818182 \tabularnewline
57 & 469357 & 562468.618181818 & -93111.6181818182 \tabularnewline
58 & 477580 & 562468.618181818 & -84888.6181818182 \tabularnewline
59 & 528379 & 562468.618181818 & -34089.6181818182 \tabularnewline
60 & 533590 & 562468.618181818 & -28878.6181818182 \tabularnewline
61 & 517945 & 562468.618181818 & -44523.6181818182 \tabularnewline
\hline
\end{tabular}
%Source: https://freestatistics.org/blog/index.php?pk=25540&T=4

[TABLE]
[ROW][C]Multiple Linear Regression - Actuals, Interpolation, and Residuals[/C][/ROW]
[ROW][C]Time or Index[/C][C]Actuals[/C][C]InterpolationForecast[/C][C]ResidualsPrediction Error[/C][/ROW]
[ROW][C]1[/C][C]577992[/C][C]561461.166666667[/C][C]16530.8333333333[/C][/ROW]
[ROW][C]2[/C][C]565464[/C][C]561461.166666667[/C][C]4002.83333333329[/C][/ROW]
[ROW][C]3[/C][C]547344[/C][C]561461.166666667[/C][C]-14117.1666666667[/C][/ROW]
[ROW][C]4[/C][C]554788[/C][C]561461.166666667[/C][C]-6673.16666666666[/C][/ROW]
[ROW][C]5[/C][C]562325[/C][C]561461.166666667[/C][C]863.833333333343[/C][/ROW]
[ROW][C]6[/C][C]560854[/C][C]561461.166666667[/C][C]-607.166666666657[/C][/ROW]
[ROW][C]7[/C][C]555332[/C][C]562468.618181818[/C][C]-7136.61818181818[/C][/ROW]
[ROW][C]8[/C][C]543599[/C][C]562468.618181818[/C][C]-18869.6181818182[/C][/ROW]
[ROW][C]9[/C][C]536662[/C][C]562468.618181818[/C][C]-25806.6181818182[/C][/ROW]
[ROW][C]10[/C][C]542722[/C][C]562468.618181818[/C][C]-19746.6181818182[/C][/ROW]
[ROW][C]11[/C][C]593530[/C][C]562468.618181818[/C][C]31061.3818181818[/C][/ROW]
[ROW][C]12[/C][C]610763[/C][C]562468.618181818[/C][C]48294.3818181818[/C][/ROW]
[ROW][C]13[/C][C]612613[/C][C]562468.618181818[/C][C]50144.3818181818[/C][/ROW]
[ROW][C]14[/C][C]611324[/C][C]562468.618181818[/C][C]48855.3818181818[/C][/ROW]
[ROW][C]15[/C][C]594167[/C][C]562468.618181818[/C][C]31698.3818181818[/C][/ROW]
[ROW][C]16[/C][C]595454[/C][C]562468.618181818[/C][C]32985.3818181818[/C][/ROW]
[ROW][C]17[/C][C]590865[/C][C]562468.618181818[/C][C]28396.3818181818[/C][/ROW]
[ROW][C]18[/C][C]589379[/C][C]562468.618181818[/C][C]26910.3818181818[/C][/ROW]
[ROW][C]19[/C][C]584428[/C][C]562468.618181818[/C][C]21959.3818181818[/C][/ROW]
[ROW][C]20[/C][C]573100[/C][C]562468.618181818[/C][C]10631.3818181818[/C][/ROW]
[ROW][C]21[/C][C]567456[/C][C]562468.618181818[/C][C]4987.38181818182[/C][/ROW]
[ROW][C]22[/C][C]569028[/C][C]562468.618181818[/C][C]6559.38181818182[/C][/ROW]
[ROW][C]23[/C][C]620735[/C][C]562468.618181818[/C][C]58266.3818181818[/C][/ROW]
[ROW][C]24[/C][C]628884[/C][C]562468.618181818[/C][C]66415.3818181818[/C][/ROW]
[ROW][C]25[/C][C]628232[/C][C]562468.618181818[/C][C]65763.3818181818[/C][/ROW]
[ROW][C]26[/C][C]612117[/C][C]562468.618181818[/C][C]49648.3818181818[/C][/ROW]
[ROW][C]27[/C][C]595404[/C][C]562468.618181818[/C][C]32935.3818181818[/C][/ROW]
[ROW][C]28[/C][C]597141[/C][C]562468.618181818[/C][C]34672.3818181818[/C][/ROW]
[ROW][C]29[/C][C]593408[/C][C]562468.618181818[/C][C]30939.3818181818[/C][/ROW]
[ROW][C]30[/C][C]590072[/C][C]562468.618181818[/C][C]27603.3818181818[/C][/ROW]
[ROW][C]31[/C][C]579799[/C][C]562468.618181818[/C][C]17330.3818181818[/C][/ROW]
[ROW][C]32[/C][C]574205[/C][C]562468.618181818[/C][C]11736.3818181818[/C][/ROW]
[ROW][C]33[/C][C]572775[/C][C]562468.618181818[/C][C]10306.3818181818[/C][/ROW]
[ROW][C]34[/C][C]572942[/C][C]562468.618181818[/C][C]10473.3818181818[/C][/ROW]
[ROW][C]35[/C][C]619567[/C][C]562468.618181818[/C][C]57098.3818181818[/C][/ROW]
[ROW][C]36[/C][C]625809[/C][C]562468.618181818[/C][C]63340.3818181818[/C][/ROW]
[ROW][C]37[/C][C]619916[/C][C]562468.618181818[/C][C]57447.3818181818[/C][/ROW]
[ROW][C]38[/C][C]587625[/C][C]562468.618181818[/C][C]25156.3818181818[/C][/ROW]
[ROW][C]39[/C][C]565742[/C][C]562468.618181818[/C][C]3273.38181818182[/C][/ROW]
[ROW][C]40[/C][C]557274[/C][C]562468.618181818[/C][C]-5194.61818181818[/C][/ROW]
[ROW][C]41[/C][C]560576[/C][C]562468.618181818[/C][C]-1892.61818181818[/C][/ROW]
[ROW][C]42[/C][C]548854[/C][C]562468.618181818[/C][C]-13614.6181818182[/C][/ROW]
[ROW][C]43[/C][C]531673[/C][C]562468.618181818[/C][C]-30795.6181818182[/C][/ROW]
[ROW][C]44[/C][C]525919[/C][C]562468.618181818[/C][C]-36549.6181818182[/C][/ROW]
[ROW][C]45[/C][C]511038[/C][C]562468.618181818[/C][C]-51430.6181818182[/C][/ROW]
[ROW][C]46[/C][C]498662[/C][C]562468.618181818[/C][C]-63806.6181818182[/C][/ROW]
[ROW][C]47[/C][C]555362[/C][C]562468.618181818[/C][C]-7106.61818181818[/C][/ROW]
[ROW][C]48[/C][C]564591[/C][C]562468.618181818[/C][C]2122.38181818182[/C][/ROW]
[ROW][C]49[/C][C]541657[/C][C]562468.618181818[/C][C]-20811.6181818182[/C][/ROW]
[ROW][C]50[/C][C]527070[/C][C]562468.618181818[/C][C]-35398.6181818182[/C][/ROW]
[ROW][C]51[/C][C]509846[/C][C]562468.618181818[/C][C]-52622.6181818182[/C][/ROW]
[ROW][C]52[/C][C]514258[/C][C]562468.618181818[/C][C]-48210.6181818182[/C][/ROW]
[ROW][C]53[/C][C]516922[/C][C]562468.618181818[/C][C]-45546.6181818182[/C][/ROW]
[ROW][C]54[/C][C]507561[/C][C]562468.618181818[/C][C]-54907.6181818182[/C][/ROW]
[ROW][C]55[/C][C]492622[/C][C]562468.618181818[/C][C]-69846.6181818182[/C][/ROW]
[ROW][C]56[/C][C]490243[/C][C]562468.618181818[/C][C]-72225.6181818182[/C][/ROW]
[ROW][C]57[/C][C]469357[/C][C]562468.618181818[/C][C]-93111.6181818182[/C][/ROW]
[ROW][C]58[/C][C]477580[/C][C]562468.618181818[/C][C]-84888.6181818182[/C][/ROW]
[ROW][C]59[/C][C]528379[/C][C]562468.618181818[/C][C]-34089.6181818182[/C][/ROW]
[ROW][C]60[/C][C]533590[/C][C]562468.618181818[/C][C]-28878.6181818182[/C][/ROW]
[ROW][C]61[/C][C]517945[/C][C]562468.618181818[/C][C]-44523.6181818182[/C][/ROW]
[/TABLE]
Source: https://freestatistics.org/blog/index.php?pk=25540&T=4

Globally Unique Identifier (entire table): ba.freestatistics.org/blog/index.php?pk=25540&T=4

As an alternative you can also use a QR Code:  

The GUIDs for individual cells are displayed in the table below:

Multiple Linear Regression - Actuals, Interpolation, and Residuals
Time or IndexActualsInterpolationForecastResidualsPrediction Error
1577992561461.16666666716530.8333333333
2565464561461.1666666674002.83333333329
3547344561461.166666667-14117.1666666667
4554788561461.166666667-6673.16666666666
5562325561461.166666667863.833333333343
6560854561461.166666667-607.166666666657
7555332562468.618181818-7136.61818181818
8543599562468.618181818-18869.6181818182
9536662562468.618181818-25806.6181818182
10542722562468.618181818-19746.6181818182
11593530562468.61818181831061.3818181818
12610763562468.61818181848294.3818181818
13612613562468.61818181850144.3818181818
14611324562468.61818181848855.3818181818
15594167562468.61818181831698.3818181818
16595454562468.61818181832985.3818181818
17590865562468.61818181828396.3818181818
18589379562468.61818181826910.3818181818
19584428562468.61818181821959.3818181818
20573100562468.61818181810631.3818181818
21567456562468.6181818184987.38181818182
22569028562468.6181818186559.38181818182
23620735562468.61818181858266.3818181818
24628884562468.61818181866415.3818181818
25628232562468.61818181865763.3818181818
26612117562468.61818181849648.3818181818
27595404562468.61818181832935.3818181818
28597141562468.61818181834672.3818181818
29593408562468.61818181830939.3818181818
30590072562468.61818181827603.3818181818
31579799562468.61818181817330.3818181818
32574205562468.61818181811736.3818181818
33572775562468.61818181810306.3818181818
34572942562468.61818181810473.3818181818
35619567562468.61818181857098.3818181818
36625809562468.61818181863340.3818181818
37619916562468.61818181857447.3818181818
38587625562468.61818181825156.3818181818
39565742562468.6181818183273.38181818182
40557274562468.618181818-5194.61818181818
41560576562468.618181818-1892.61818181818
42548854562468.618181818-13614.6181818182
43531673562468.618181818-30795.6181818182
44525919562468.618181818-36549.6181818182
45511038562468.618181818-51430.6181818182
46498662562468.618181818-63806.6181818182
47555362562468.618181818-7106.61818181818
48564591562468.6181818182122.38181818182
49541657562468.618181818-20811.6181818182
50527070562468.618181818-35398.6181818182
51509846562468.618181818-52622.6181818182
52514258562468.618181818-48210.6181818182
53516922562468.618181818-45546.6181818182
54507561562468.618181818-54907.6181818182
55492622562468.618181818-69846.6181818182
56490243562468.618181818-72225.6181818182
57469357562468.618181818-93111.6181818182
58477580562468.618181818-84888.6181818182
59528379562468.618181818-34089.6181818182
60533590562468.618181818-28878.6181818182
61517945562468.618181818-44523.6181818182


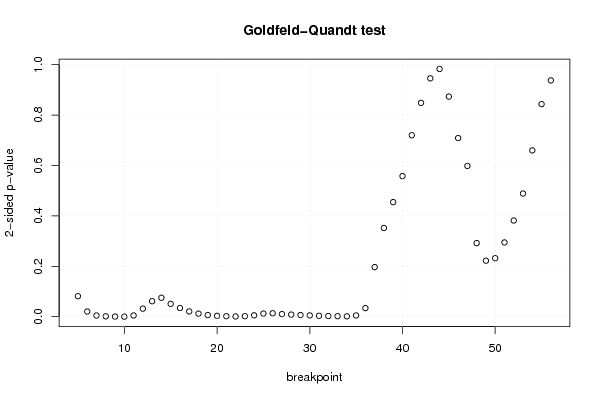
Goldfeld-Quandt test for Heteroskedasticity
p-valuesAlternative Hypothesis
breakpoint indexgreater2-sidedless
50.04067303741460620.08134607482921240.959326962585394
60.01026034053607460.02052068107214920.989739659463925
70.002328503441934790.004657006883869580.997671496558065
80.0006905508924046550.001381101784809310.999309449107595
90.0002514330358589920.0005028660717179830.99974856696414
105.41314407846043e-050.0001082628815692090.999945868559215
110.00240296709938010.00480593419876020.99759703290062
120.01591071135836130.03182142271672250.984089288641639
130.03074748208544110.06149496417088220.969252517914559
140.03754454319544760.07508908639089520.962455456804552
150.02551125075185470.05102250150370940.974488749248145
160.01717241140290800.03434482280581610.982827588597092
170.01038679538563270.02077359077126540.989613204614367
180.005997578380650520.01199515676130100.99400242161935
190.003208073915403540.006416147830807090.996791926084596
200.001669828125885160.003339656251770320.998330171874115
210.000897237401353650.00179447480270730.999102762598646
220.0004550563019615580.0009101126039231160.999544943698038
230.000938432357040240.001876864714080480.99906156764296
240.002656746195817260.005313492391634510.997343253804183
250.006106834822285850.01221366964457170.993893165177714
260.006839051316883220.01367810263376640.993160948683117
270.005177285764743120.01035457152948620.994822714235257
280.00417090380814330.00834180761628660.995829096191857
290.00324649182253280.00649298364506560.996753508177467
300.00248011131574590.00496022263149180.997519888684254
310.001764412354870180.003528824709740360.99823558764513
320.001262284882420420.002524569764840840.99873771511758
330.0009104120450536790.001820824090107360.999089587954946
340.0006611788039056520.001322357607811300.999338821196094
350.002444663819601970.004889327639203930.997555336180398
360.01693173644545670.03386347289091340.983068263554543
370.0983252206878410.1966504413756820.901674779312159
380.1760001428097730.3520002856195450.823999857190227
390.2272383582128320.4544767164256630.772761641787168
400.2788622085583720.5577244171167430.721137791441628
410.3598487243280160.7196974486560330.640151275671984
420.4240704507764860.8481409015529730.575929549223514
430.4727337191502870.9454674383005730.527266280849713
440.508647209984560.982705580030880.49135279001544
450.5635195607497210.8729608785005580.436480439250279
460.6457169455371250.708566108925750.354283054462875
470.7010618892554810.5978762214890380.298938110744519
480.854087939492810.2918241210143810.145912060507190
490.8889195381052650.2221609237894700.111080461894735
500.8840029614391410.2319940771217180.115997038560859
510.8527574407512450.294485118497510.147242559248755
520.8092318316718040.3815363366563930.190768168328196
530.7557533157027720.4884933685944560.244246684297228
540.6701111457207730.6597777085584550.329888854279227
550.5783686456011430.8432627087977150.421631354398857
560.4686510837600640.9373021675201290.531348916239936

\begin{tabular}{lllllllll}
\hline
Goldfeld-Quandt test for Heteroskedasticity \tabularnewline
p-values & Alternative Hypothesis \tabularnewline
breakpoint index & greater & 2-sided & less \tabularnewline
5 & 0.0406730374146062 & 0.0813460748292124 & 0.959326962585394 \tabularnewline
6 & 0.0102603405360746 & 0.0205206810721492 & 0.989739659463925 \tabularnewline
7 & 0.00232850344193479 & 0.00465700688386958 & 0.997671496558065 \tabularnewline
8 & 0.000690550892404655 & 0.00138110178480931 & 0.999309449107595 \tabularnewline
9 & 0.000251433035858992 & 0.000502866071717983 & 0.99974856696414 \tabularnewline
10 & 5.41314407846043e-05 & 0.000108262881569209 & 0.999945868559215 \tabularnewline
11 & 0.0024029670993801 & 0.0048059341987602 & 0.99759703290062 \tabularnewline
12 & 0.0159107113583613 & 0.0318214227167225 & 0.984089288641639 \tabularnewline
13 & 0.0307474820854411 & 0.0614949641708822 & 0.969252517914559 \tabularnewline
14 & 0.0375445431954476 & 0.0750890863908952 & 0.962455456804552 \tabularnewline
15 & 0.0255112507518547 & 0.0510225015037094 & 0.974488749248145 \tabularnewline
16 & 0.0171724114029080 & 0.0343448228058161 & 0.982827588597092 \tabularnewline
17 & 0.0103867953856327 & 0.0207735907712654 & 0.989613204614367 \tabularnewline
18 & 0.00599757838065052 & 0.0119951567613010 & 0.99400242161935 \tabularnewline
19 & 0.00320807391540354 & 0.00641614783080709 & 0.996791926084596 \tabularnewline
20 & 0.00166982812588516 & 0.00333965625177032 & 0.998330171874115 \tabularnewline
21 & 0.00089723740135365 & 0.0017944748027073 & 0.999102762598646 \tabularnewline
22 & 0.000455056301961558 & 0.000910112603923116 & 0.999544943698038 \tabularnewline
23 & 0.00093843235704024 & 0.00187686471408048 & 0.99906156764296 \tabularnewline
24 & 0.00265674619581726 & 0.00531349239163451 & 0.997343253804183 \tabularnewline
25 & 0.00610683482228585 & 0.0122136696445717 & 0.993893165177714 \tabularnewline
26 & 0.00683905131688322 & 0.0136781026337664 & 0.993160948683117 \tabularnewline
27 & 0.00517728576474312 & 0.0103545715294862 & 0.994822714235257 \tabularnewline
28 & 0.0041709038081433 & 0.0083418076162866 & 0.995829096191857 \tabularnewline
29 & 0.0032464918225328 & 0.0064929836450656 & 0.996753508177467 \tabularnewline
30 & 0.0024801113157459 & 0.0049602226314918 & 0.997519888684254 \tabularnewline
31 & 0.00176441235487018 & 0.00352882470974036 & 0.99823558764513 \tabularnewline
32 & 0.00126228488242042 & 0.00252456976484084 & 0.99873771511758 \tabularnewline
33 & 0.000910412045053679 & 0.00182082409010736 & 0.999089587954946 \tabularnewline
34 & 0.000661178803905652 & 0.00132235760781130 & 0.999338821196094 \tabularnewline
35 & 0.00244466381960197 & 0.00488932763920393 & 0.997555336180398 \tabularnewline
36 & 0.0169317364454567 & 0.0338634728909134 & 0.983068263554543 \tabularnewline
37 & 0.098325220687841 & 0.196650441375682 & 0.901674779312159 \tabularnewline
38 & 0.176000142809773 & 0.352000285619545 & 0.823999857190227 \tabularnewline
39 & 0.227238358212832 & 0.454476716425663 & 0.772761641787168 \tabularnewline
40 & 0.278862208558372 & 0.557724417116743 & 0.721137791441628 \tabularnewline
41 & 0.359848724328016 & 0.719697448656033 & 0.640151275671984 \tabularnewline
42 & 0.424070450776486 & 0.848140901552973 & 0.575929549223514 \tabularnewline
43 & 0.472733719150287 & 0.945467438300573 & 0.527266280849713 \tabularnewline
44 & 0.50864720998456 & 0.98270558003088 & 0.49135279001544 \tabularnewline
45 & 0.563519560749721 & 0.872960878500558 & 0.436480439250279 \tabularnewline
46 & 0.645716945537125 & 0.70856610892575 & 0.354283054462875 \tabularnewline
47 & 0.701061889255481 & 0.597876221489038 & 0.298938110744519 \tabularnewline
48 & 0.85408793949281 & 0.291824121014381 & 0.145912060507190 \tabularnewline
49 & 0.888919538105265 & 0.222160923789470 & 0.111080461894735 \tabularnewline
50 & 0.884002961439141 & 0.231994077121718 & 0.115997038560859 \tabularnewline
51 & 0.852757440751245 & 0.29448511849751 & 0.147242559248755 \tabularnewline
52 & 0.809231831671804 & 0.381536336656393 & 0.190768168328196 \tabularnewline
53 & 0.755753315702772 & 0.488493368594456 & 0.244246684297228 \tabularnewline
54 & 0.670111145720773 & 0.659777708558455 & 0.329888854279227 \tabularnewline
55 & 0.578368645601143 & 0.843262708797715 & 0.421631354398857 \tabularnewline
56 & 0.468651083760064 & 0.937302167520129 & 0.531348916239936 \tabularnewline
\hline
\end{tabular}
%Source: https://freestatistics.org/blog/index.php?pk=25540&T=5

[TABLE]
[ROW][C]Goldfeld-Quandt test for Heteroskedasticity[/C][/ROW]
[ROW][C]p-values[/C][C]Alternative Hypothesis[/C][/ROW]
[ROW][C]breakpoint index[/C][C]greater[/C][C]2-sided[/C][C]less[/C][/ROW]
[ROW][C]5[/C][C]0.0406730374146062[/C][C]0.0813460748292124[/C][C]0.959326962585394[/C][/ROW]
[ROW][C]6[/C][C]0.0102603405360746[/C][C]0.0205206810721492[/C][C]0.989739659463925[/C][/ROW]
[ROW][C]7[/C][C]0.00232850344193479[/C][C]0.00465700688386958[/C][C]0.997671496558065[/C][/ROW]
[ROW][C]8[/C][C]0.000690550892404655[/C][C]0.00138110178480931[/C][C]0.999309449107595[/C][/ROW]
[ROW][C]9[/C][C]0.000251433035858992[/C][C]0.000502866071717983[/C][C]0.99974856696414[/C][/ROW]
[ROW][C]10[/C][C]5.41314407846043e-05[/C][C]0.000108262881569209[/C][C]0.999945868559215[/C][/ROW]
[ROW][C]11[/C][C]0.0024029670993801[/C][C]0.0048059341987602[/C][C]0.99759703290062[/C][/ROW]
[ROW][C]12[/C][C]0.0159107113583613[/C][C]0.0318214227167225[/C][C]0.984089288641639[/C][/ROW]
[ROW][C]13[/C][C]0.0307474820854411[/C][C]0.0614949641708822[/C][C]0.969252517914559[/C][/ROW]
[ROW][C]14[/C][C]0.0375445431954476[/C][C]0.0750890863908952[/C][C]0.962455456804552[/C][/ROW]
[ROW][C]15[/C][C]0.0255112507518547[/C][C]0.0510225015037094[/C][C]0.974488749248145[/C][/ROW]
[ROW][C]16[/C][C]0.0171724114029080[/C][C]0.0343448228058161[/C][C]0.982827588597092[/C][/ROW]
[ROW][C]17[/C][C]0.0103867953856327[/C][C]0.0207735907712654[/C][C]0.989613204614367[/C][/ROW]
[ROW][C]18[/C][C]0.00599757838065052[/C][C]0.0119951567613010[/C][C]0.99400242161935[/C][/ROW]
[ROW][C]19[/C][C]0.00320807391540354[/C][C]0.00641614783080709[/C][C]0.996791926084596[/C][/ROW]
[ROW][C]20[/C][C]0.00166982812588516[/C][C]0.00333965625177032[/C][C]0.998330171874115[/C][/ROW]
[ROW][C]21[/C][C]0.00089723740135365[/C][C]0.0017944748027073[/C][C]0.999102762598646[/C][/ROW]
[ROW][C]22[/C][C]0.000455056301961558[/C][C]0.000910112603923116[/C][C]0.999544943698038[/C][/ROW]
[ROW][C]23[/C][C]0.00093843235704024[/C][C]0.00187686471408048[/C][C]0.99906156764296[/C][/ROW]
[ROW][C]24[/C][C]0.00265674619581726[/C][C]0.00531349239163451[/C][C]0.997343253804183[/C][/ROW]
[ROW][C]25[/C][C]0.00610683482228585[/C][C]0.0122136696445717[/C][C]0.993893165177714[/C][/ROW]
[ROW][C]26[/C][C]0.00683905131688322[/C][C]0.0136781026337664[/C][C]0.993160948683117[/C][/ROW]
[ROW][C]27[/C][C]0.00517728576474312[/C][C]0.0103545715294862[/C][C]0.994822714235257[/C][/ROW]
[ROW][C]28[/C][C]0.0041709038081433[/C][C]0.0083418076162866[/C][C]0.995829096191857[/C][/ROW]
[ROW][C]29[/C][C]0.0032464918225328[/C][C]0.0064929836450656[/C][C]0.996753508177467[/C][/ROW]
[ROW][C]30[/C][C]0.0024801113157459[/C][C]0.0049602226314918[/C][C]0.997519888684254[/C][/ROW]
[ROW][C]31[/C][C]0.00176441235487018[/C][C]0.00352882470974036[/C][C]0.99823558764513[/C][/ROW]
[ROW][C]32[/C][C]0.00126228488242042[/C][C]0.00252456976484084[/C][C]0.99873771511758[/C][/ROW]
[ROW][C]33[/C][C]0.000910412045053679[/C][C]0.00182082409010736[/C][C]0.999089587954946[/C][/ROW]
[ROW][C]34[/C][C]0.000661178803905652[/C][C]0.00132235760781130[/C][C]0.999338821196094[/C][/ROW]
[ROW][C]35[/C][C]0.00244466381960197[/C][C]0.00488932763920393[/C][C]0.997555336180398[/C][/ROW]
[ROW][C]36[/C][C]0.0169317364454567[/C][C]0.0338634728909134[/C][C]0.983068263554543[/C][/ROW]
[ROW][C]37[/C][C]0.098325220687841[/C][C]0.196650441375682[/C][C]0.901674779312159[/C][/ROW]
[ROW][C]38[/C][C]0.176000142809773[/C][C]0.352000285619545[/C][C]0.823999857190227[/C][/ROW]
[ROW][C]39[/C][C]0.227238358212832[/C][C]0.454476716425663[/C][C]0.772761641787168[/C][/ROW]
[ROW][C]40[/C][C]0.278862208558372[/C][C]0.557724417116743[/C][C]0.721137791441628[/C][/ROW]
[ROW][C]41[/C][C]0.359848724328016[/C][C]0.719697448656033[/C][C]0.640151275671984[/C][/ROW]
[ROW][C]42[/C][C]0.424070450776486[/C][C]0.848140901552973[/C][C]0.575929549223514[/C][/ROW]
[ROW][C]43[/C][C]0.472733719150287[/C][C]0.945467438300573[/C][C]0.527266280849713[/C][/ROW]
[ROW][C]44[/C][C]0.50864720998456[/C][C]0.98270558003088[/C][C]0.49135279001544[/C][/ROW]
[ROW][C]45[/C][C]0.563519560749721[/C][C]0.872960878500558[/C][C]0.436480439250279[/C][/ROW]
[ROW][C]46[/C][C]0.645716945537125[/C][C]0.70856610892575[/C][C]0.354283054462875[/C][/ROW]
[ROW][C]47[/C][C]0.701061889255481[/C][C]0.597876221489038[/C][C]0.298938110744519[/C][/ROW]
[ROW][C]48[/C][C]0.85408793949281[/C][C]0.291824121014381[/C][C]0.145912060507190[/C][/ROW]
[ROW][C]49[/C][C]0.888919538105265[/C][C]0.222160923789470[/C][C]0.111080461894735[/C][/ROW]
[ROW][C]50[/C][C]0.884002961439141[/C][C]0.231994077121718[/C][C]0.115997038560859[/C][/ROW]
[ROW][C]51[/C][C]0.852757440751245[/C][C]0.29448511849751[/C][C]0.147242559248755[/C][/ROW]
[ROW][C]52[/C][C]0.809231831671804[/C][C]0.381536336656393[/C][C]0.190768168328196[/C][/ROW]
[ROW][C]53[/C][C]0.755753315702772[/C][C]0.488493368594456[/C][C]0.244246684297228[/C][/ROW]
[ROW][C]54[/C][C]0.670111145720773[/C][C]0.659777708558455[/C][C]0.329888854279227[/C][/ROW]
[ROW][C]55[/C][C]0.578368645601143[/C][C]0.843262708797715[/C][C]0.421631354398857[/C][/ROW]
[ROW][C]56[/C][C]0.468651083760064[/C][C]0.937302167520129[/C][C]0.531348916239936[/C][/ROW]
[/TABLE]
Source: https://freestatistics.org/blog/index.php?pk=25540&T=5

Globally Unique Identifier (entire table): ba.freestatistics.org/blog/index.php?pk=25540&T=5

As an alternative you can also use a QR Code:  

The GUIDs for individual cells are displayed in the table below:

Goldfeld-Quandt test for Heteroskedasticity
p-valuesAlternative Hypothesis
breakpoint indexgreater2-sidedless
50.04067303741460620.08134607482921240.959326962585394
60.01026034053607460.02052068107214920.989739659463925
70.002328503441934790.004657006883869580.997671496558065
80.0006905508924046550.001381101784809310.999309449107595
90.0002514330358589920.0005028660717179830.99974856696414
105.41314407846043e-050.0001082628815692090.999945868559215
110.00240296709938010.00480593419876020.99759703290062
120.01591071135836130.03182142271672250.984089288641639
130.03074748208544110.06149496417088220.969252517914559
140.03754454319544760.07508908639089520.962455456804552
150.02551125075185470.05102250150370940.974488749248145
160.01717241140290800.03434482280581610.982827588597092
170.01038679538563270.02077359077126540.989613204614367
180.005997578380650520.01199515676130100.99400242161935
190.003208073915403540.006416147830807090.996791926084596
200.001669828125885160.003339656251770320.998330171874115
210.000897237401353650.00179447480270730.999102762598646
220.0004550563019615580.0009101126039231160.999544943698038
230.000938432357040240.001876864714080480.99906156764296
240.002656746195817260.005313492391634510.997343253804183
250.006106834822285850.01221366964457170.993893165177714
260.006839051316883220.01367810263376640.993160948683117
270.005177285764743120.01035457152948620.994822714235257
280.00417090380814330.00834180761628660.995829096191857
290.00324649182253280.00649298364506560.996753508177467
300.00248011131574590.00496022263149180.997519888684254
310.001764412354870180.003528824709740360.99823558764513
320.001262284882420420.002524569764840840.99873771511758
330.0009104120450536790.001820824090107360.999089587954946
340.0006611788039056520.001322357607811300.999338821196094
350.002444663819601970.004889327639203930.997555336180398
360.01693173644545670.03386347289091340.983068263554543
370.0983252206878410.1966504413756820.901674779312159
380.1760001428097730.3520002856195450.823999857190227
390.2272383582128320.4544767164256630.772761641787168
400.2788622085583720.5577244171167430.721137791441628
410.3598487243280160.7196974486560330.640151275671984
420.4240704507764860.8481409015529730.575929549223514
430.4727337191502870.9454674383005730.527266280849713
440.508647209984560.982705580030880.49135279001544
450.5635195607497210.8729608785005580.436480439250279
460.6457169455371250.708566108925750.354283054462875
470.7010618892554810.5978762214890380.298938110744519
480.854087939492810.2918241210143810.145912060507190
490.8889195381052650.2221609237894700.111080461894735
500.8840029614391410.2319940771217180.115997038560859
510.8527574407512450.294485118497510.147242559248755
520.8092318316718040.3815363366563930.190768168328196
530.7557533157027720.4884933685944560.244246684297228
540.6701111457207730.6597777085584550.329888854279227
550.5783686456011430.8432627087977150.421631354398857
560.4686510837600640.9373021675201290.531348916239936


Meta Analysis of Goldfeld-Quandt test for Heteroskedasticity
Description# significant tests% significant testsOK/NOK
1% type I error level190.365384615384615NOK
5% type I error level280.538461538461538NOK
10% type I error level320.615384615384615NOK

\begin{tabular}{lllllllll}
\hline
Meta Analysis of Goldfeld-Quandt test for Heteroskedasticity \tabularnewline
Description & # significant tests & % significant tests & OK/NOK \tabularnewline
1% type I error level & 19 & 0.365384615384615 & NOK \tabularnewline
5% type I error level & 28 & 0.538461538461538 & NOK \tabularnewline
10% type I error level & 32 & 0.615384615384615 & NOK \tabularnewline
\hline
\end{tabular}
%Source: https://freestatistics.org/blog/index.php?pk=25540&T=6

[TABLE]
[ROW][C]Meta Analysis of Goldfeld-Quandt test for Heteroskedasticity[/C][/ROW]
[ROW][C]Description[/C][C]# significant tests[/C][C]% significant tests[/C][C]OK/NOK[/C][/ROW]
[ROW][C]1% type I error level[/C][C]19[/C][C]0.365384615384615[/C][C]NOK[/C][/ROW]
[ROW][C]5% type I error level[/C][C]28[/C][C]0.538461538461538[/C][C]NOK[/C][/ROW]
[ROW][C]10% type I error level[/C][C]32[/C][C]0.615384615384615[/C][C]NOK[/C][/ROW]
[/TABLE]
Source: https://freestatistics.org/blog/index.php?pk=25540&T=6

Globally Unique Identifier (entire table): ba.freestatistics.org/blog/index.php?pk=25540&T=6

As an alternative you can also use a QR Code:  

The GUIDs for individual cells are displayed in the table below:

Meta Analysis of Goldfeld-Quandt test for Heteroskedasticity
Description# significant tests% significant testsOK/NOK
1% type I error level190.365384615384615NOK
5% type I error level280.538461538461538NOK
10% type I error level320.615384615384615NOK


Parameters (Session):
par1 = 1 ; par2 = Do not include Seasonal Dummies ; par3 = No Linear Trend ;
Parameters (R input):
par1 = 1 ; par2 = Do not include Seasonal Dummies ; par3 = No Linear Trend ;
R code (references can be found in the software module):
library(lattice)
library(lmtest)
n25 <- 25 #minimum number of obs. for Goldfeld-Quandt test
par1 <- as.numeric(par1)
x <- t(y)
k <- length(x[1,])
n <- length(x[,1])
x1 <- cbind(x[,par1], x[,1:k!=par1])
mycolnames <- c(colnames(x)[par1], colnames(x)[1:k!=par1])
colnames(x1) <- mycolnames #colnames(x)[par1]
x <- x1
if (par3 == 'First Differences'){
x2 <- array(0, dim=c(n-1,k), dimnames=list(1:(n-1), paste('(1-B)',colnames(x),sep='')))
for (i in 1:n-1) {
for (j in 1:k) {
x2[i,j] <- x[i+1,j] - x[i,j]
}
}
x <- x2
}
if (par2 == 'Include Monthly Dummies'){
x2 <- array(0, dim=c(n,11), dimnames=list(1:n, paste('M', seq(1:11), sep ='')))
for (i in 1:11){
x2[seq(i,n,12),i] <- 1
}
x <- cbind(x, x2)
}
if (par2 == 'Include Quarterly Dummies'){
x2 <- array(0, dim=c(n,3), dimnames=list(1:n, paste('Q', seq(1:3), sep ='')))
for (i in 1:3){
x2[seq(i,n,4),i] <- 1
}
x <- cbind(x, x2)
}
k <- length(x[1,])
if (par3 == 'Linear Trend'){
x <- cbind(x, c(1:n))
colnames(x)[k+1] <- 't'
}
x
k <- length(x[1,])
df <- as.data.frame(x)
(mylm <- lm(df))
(mysum <- summary(mylm))
if (n > n25) {
kp3 <- k + 3
nmkm3 <- n - k - 3
gqarr <- array(NA, dim=c(nmkm3-kp3+1,3))
numgqtests <- 0
numsignificant1 <- 0
numsignificant5 <- 0
numsignificant10 <- 0
for (mypoint in kp3:nmkm3) {
j <- 0
numgqtests <- numgqtests + 1
for (myalt in c('greater', 'two.sided', 'less')) {
j <- j + 1
gqarr[mypoint-kp3+1,j] <- gqtest(mylm, point=mypoint, alternative=myalt)$p.value
}
if (gqarr[mypoint-kp3+1,2] < 0.01) numsignificant1 <- numsignificant1 + 1
if (gqarr[mypoint-kp3+1,2] < 0.05) numsignificant5 <- numsignificant5 + 1
if (gqarr[mypoint-kp3+1,2] < 0.10) numsignificant10 <- numsignificant10 + 1
}
gqarr
}
bitmap(file='test0.png')
plot(x[,1], type='l', main='Actuals and Interpolation', ylab='value of Actuals and Interpolation (dots)', xlab='time or index')
points(x[,1]-mysum$resid)
grid()
dev.off()
bitmap(file='test1.png')
plot(mysum$resid, type='b', pch=19, main='Residuals', ylab='value of Residuals', xlab='time or index')
grid()
dev.off()
bitmap(file='test2.png')
hist(mysum$resid, main='Residual Histogram', xlab='values of Residuals')
grid()
dev.off()
bitmap(file='test3.png')
densityplot(~mysum$resid,col='black',main='Residual Density Plot', xlab='values of Residuals')
dev.off()
bitmap(file='test4.png')
qqnorm(mysum$resid, main='Residual Normal Q-Q Plot')
qqline(mysum$resid)
grid()
dev.off()
(myerror <- as.ts(mysum$resid))
bitmap(file='test5.png')
dum <- cbind(lag(myerror,k=1),myerror)
dum
dum1 <- dum[2:length(myerror),]
dum1
z <- as.data.frame(dum1)
z
plot(z,main=paste('Residual Lag plot, lowess, and regression line'), ylab='values of Residuals', xlab='lagged values of Residuals')
lines(lowess(z))
abline(lm(z))
grid()
dev.off()
bitmap(file='test6.png')
acf(mysum$resid, lag.max=length(mysum$resid)/2, main='Residual Autocorrelation Function')
grid()
dev.off()
bitmap(file='test7.png')
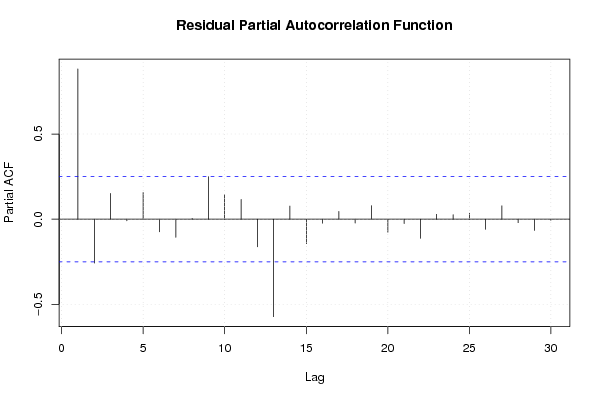
pacf(mysum$resid, lag.max=length(mysum$resid)/2, main='Residual Partial Autocorrelation Function')
grid()
dev.off()
bitmap(file='test8.png')
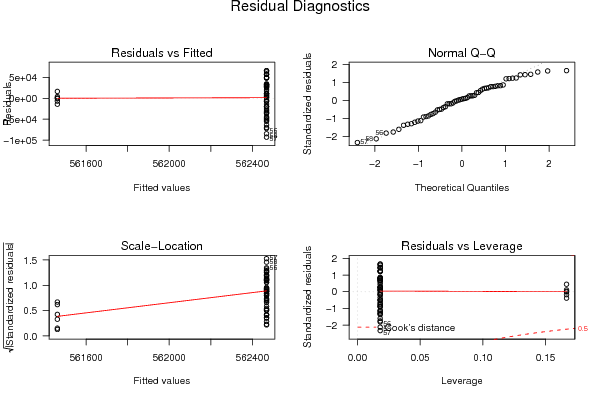
opar <- par(mfrow = c(2,2), oma = c(0, 0, 1.1, 0))
plot(mylm, las = 1, sub='Residual Diagnostics')
par(opar)
dev.off()
if (n > n25) {
bitmap(file='test9.png')
plot(kp3:nmkm3,gqarr[,2], main='Goldfeld-Quandt test',ylab='2-sided p-value',xlab='breakpoint')
grid()
dev.off()
}
load(file='createtable')
a<-table.start()
a<-table.row.start(a)
a<-table.element(a, 'Multiple Linear Regression - Estimated Regression Equation', 1, TRUE)
a<-table.row.end(a)
myeq <- colnames(x)[1]
myeq <- paste(myeq, '[t] = ', sep='')
for (i in 1:k){
if (mysum$coefficients[i,1] > 0) myeq <- paste(myeq, '+', '')
myeq <- paste(myeq, mysum$coefficients[i,1], sep=' ')
if (rownames(mysum$coefficients)[i] != '(Intercept)') {
myeq <- paste(myeq, rownames(mysum$coefficients)[i], sep='')
if (rownames(mysum$coefficients)[i] != 't') myeq <- paste(myeq, '[t]', sep='')
}
}
myeq <- paste(myeq, ' + e[t]')
a<-table.row.start(a)
a<-table.element(a, myeq)
a<-table.row.end(a)
a<-table.end(a)
table.save(a,file='mytable1.tab')
a<-table.start()
a<-table.row.start(a)
a<-table.element(a,hyperlink('ols1.htm','Multiple Linear Regression - Ordinary Least Squares',''), 6, TRUE)
a<-table.row.end(a)
a<-table.row.start(a)
a<-table.element(a,'Variable',header=TRUE)
a<-table.element(a,'Parameter',header=TRUE)
a<-table.element(a,'S.D.',header=TRUE)
a<-table.element(a,'T-STAT
H0: parameter = 0',header=TRUE)
a<-table.element(a,'2-tail p-value',header=TRUE)
a<-table.element(a,'1-tail p-value',header=TRUE)
a<-table.row.end(a)
for (i in 1:k){
a<-table.row.start(a)
a<-table.element(a,rownames(mysum$coefficients)[i],header=TRUE)
a<-table.element(a,mysum$coefficients[i,1])
a<-table.element(a, round(mysum$coefficients[i,2],6))
a<-table.element(a, round(mysum$coefficients[i,3],4))
a<-table.element(a, round(mysum$coefficients[i,4],6))
a<-table.element(a, round(mysum$coefficients[i,4]/2,6))
a<-table.row.end(a)
}
a<-table.end(a)
table.save(a,file='mytable2.tab')
a<-table.start()
a<-table.row.start(a)
a<-table.element(a, 'Multiple Linear Regression - Regression Statistics', 2, TRUE)
a<-table.row.end(a)
a<-table.row.start(a)
a<-table.element(a, 'Multiple R',1,TRUE)
a<-table.element(a, sqrt(mysum$r.squared))
a<-table.row.end(a)
a<-table.row.start(a)
a<-table.element(a, 'R-squared',1,TRUE)
a<-table.element(a, mysum$r.squared)
a<-table.row.end(a)
a<-table.row.start(a)
a<-table.element(a, 'Adjusted R-squared',1,TRUE)
a<-table.element(a, mysum$adj.r.squared)
a<-table.row.end(a)
a<-table.row.start(a)
a<-table.element(a, 'F-TEST (value)',1,TRUE)
a<-table.element(a, mysum$fstatistic[1])
a<-table.row.end(a)
a<-table.row.start(a)
a<-table.element(a, 'F-TEST (DF numerator)',1,TRUE)
a<-table.element(a, mysum$fstatistic[2])
a<-table.row.end(a)
a<-table.row.start(a)
a<-table.element(a, 'F-TEST (DF denominator)',1,TRUE)
a<-table.element(a, mysum$fstatistic[3])
a<-table.row.end(a)
a<-table.row.start(a)
a<-table.element(a, 'p-value',1,TRUE)
a<-table.element(a, 1-pf(mysum$fstatistic[1],mysum$fstatistic[2],mysum$fstatistic[3]))
a<-table.row.end(a)
a<-table.row.start(a)
a<-table.element(a, 'Multiple Linear Regression - Residual Statistics', 2, TRUE)
a<-table.row.end(a)
a<-table.row.start(a)
a<-table.element(a, 'Residual Standard Deviation',1,TRUE)
a<-table.element(a, mysum$sigma)
a<-table.row.end(a)
a<-table.row.start(a)
a<-table.element(a, 'Sum Squared Residuals',1,TRUE)
a<-table.element(a, sum(myerror*myerror))
a<-table.row.end(a)
a<-table.end(a)
table.save(a,file='mytable3.tab')
a<-table.start()
a<-table.row.start(a)
a<-table.element(a, 'Multiple Linear Regression - Actuals, Interpolation, and Residuals', 4, TRUE)
a<-table.row.end(a)
a<-table.row.start(a)
a<-table.element(a, 'Time or Index', 1, TRUE)
a<-table.element(a, 'Actuals', 1, TRUE)
a<-table.element(a, 'Interpolation
Forecast', 1, TRUE)
a<-table.element(a, 'Residuals
Prediction Error', 1, TRUE)
a<-table.row.end(a)
for (i in 1:n) {
a<-table.row.start(a)
a<-table.element(a,i, 1, TRUE)
a<-table.element(a,x[i])
a<-table.element(a,x[i]-mysum$resid[i])
a<-table.element(a,mysum$resid[i])
a<-table.row.end(a)
}
a<-table.end(a)
table.save(a,file='mytable4.tab')
if (n > n25) {
a<-table.start()
a<-table.row.start(a)
a<-table.element(a,'Goldfeld-Quandt test for Heteroskedasticity',4,TRUE)
a<-table.row.end(a)
a<-table.row.start(a)
a<-table.element(a,'p-values',header=TRUE)
a<-table.element(a,'Alternative Hypothesis',3,header=TRUE)
a<-table.row.end(a)
a<-table.row.start(a)
a<-table.element(a,'breakpoint index',header=TRUE)
a<-table.element(a,'greater',header=TRUE)
a<-table.element(a,'2-sided',header=TRUE)
a<-table.element(a,'less',header=TRUE)
a<-table.row.end(a)
for (mypoint in kp3:nmkm3) {
a<-table.row.start(a)
a<-table.element(a,mypoint,header=TRUE)
a<-table.element(a,gqarr[mypoint-kp3+1,1])
a<-table.element(a,gqarr[mypoint-kp3+1,2])
a<-table.element(a,gqarr[mypoint-kp3+1,3])
a<-table.row.end(a)
}
a<-table.end(a)
table.save(a,file='mytable5.tab')
a<-table.start()
a<-table.row.start(a)
a<-table.element(a,'Meta Analysis of Goldfeld-Quandt test for Heteroskedasticity',4,TRUE)
a<-table.row.end(a)
a<-table.row.start(a)
a<-table.element(a,'Description',header=TRUE)
a<-table.element(a,'# significant tests',header=TRUE)
a<-table.element(a,'% significant tests',header=TRUE)
a<-table.element(a,'OK/NOK',header=TRUE)
a<-table.row.end(a)
a<-table.row.start(a)
a<-table.element(a,'1% type I error level',header=TRUE)
a<-table.element(a,numsignificant1)
a<-table.element(a,numsignificant1/numgqtests)
if (numsignificant1/numgqtests < 0.01) dum <- 'OK' else dum <- 'NOK'
a<-table.element(a,dum)
a<-table.row.end(a)
a<-table.row.start(a)
a<-table.element(a,'5% type I error level',header=TRUE)
a<-table.element(a,numsignificant5)
a<-table.element(a,numsignificant5/numgqtests)
if (numsignificant5/numgqtests < 0.05) dum <- 'OK' else dum <- 'NOK'
a<-table.element(a,dum)
a<-table.row.end(a)
a<-table.row.start(a)
a<-table.element(a,'10% type I error level',header=TRUE)
a<-table.element(a,numsignificant10)
a<-table.element(a,numsignificant10/numgqtests)
if (numsignificant10/numgqtests < 0.1) dum <- 'OK' else dum <- 'NOK'
a<-table.element(a,dum)
a<-table.row.end(a)
a<-table.end(a)
table.save(a,file='mytable6.tab')
}