Free Statistics

of Irreproducible Research!

Author's title

Author*The author of this computation has been verified*
R Software Modulerwasp_multipleregression.wasp
Title produced by softwareMultiple Regression
Date of computationMon, 24 Nov 2008 14:04:57 -0700
Cite this page as followsStatistical Computations at FreeStatistics.org, Office for Research Development and Education, URL https://freestatistics.org/blog/index.php?v=date/2008/Nov/24/t1227560776h2v6rqutd6z4djg.htm/, Retrieved Tue, 14 May 2024 16:06:27 +0000
Statistical Computations at FreeStatistics.org, Office for Research Development and Education, URL https://freestatistics.org/blog/index.php?pk=25535, Retrieved Tue, 14 May 2024 16:06:27 +0000
QR Codes:

Original text written by user:
IsPrivate?No (this computation is public)
User-defined keywords
Estimated Impact183
Family? (F = Feedback message, R = changed R code, M = changed R Module, P = changed Parameters, D = changed Data)
F     [Multiple Regression] [] [2007-11-19 20:22:41] [3a1956effdcb54c39e5044435310d6c8]
-   PD  [Multiple Regression] [Q3 - omzet ind pr...] [2008-11-24 20:53:46] [b82ef11dce0545f3fd4676ec3ebed828]
F   P       [Multiple Regression] [Q3 - omzet ind pr...] [2008-11-24 21:04:57] [4b953869c7238aca4b6e0cfb0c5cddd6] [Current]
Feedback Forum
2008-11-28 08:20:20 [Ken Van den Heuvel] [reply
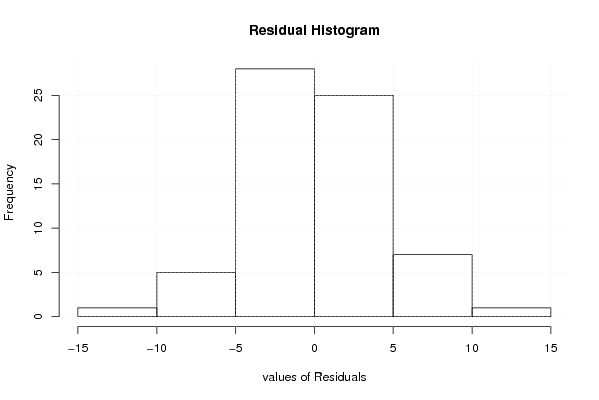
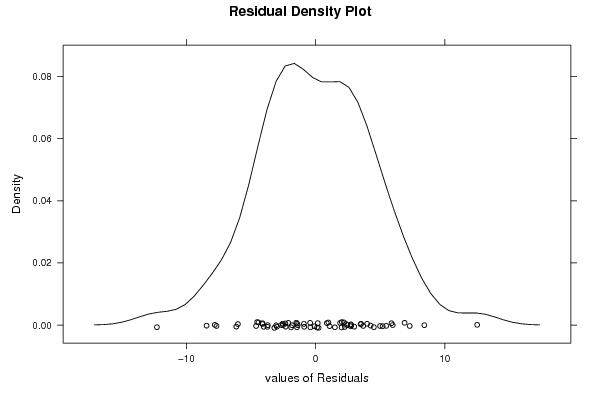
Je zegt dat de mean van de residu's niet gelijk is aan 0. Gezien de verdeling niet perfect normaal verloop klopt dit wel, maar je had kunnen nagaan of dit wel significant van 0 verschilt.

Via de T-test of Testing mean with unknown variance kon je dit nagaan met de waarden van de residu's.

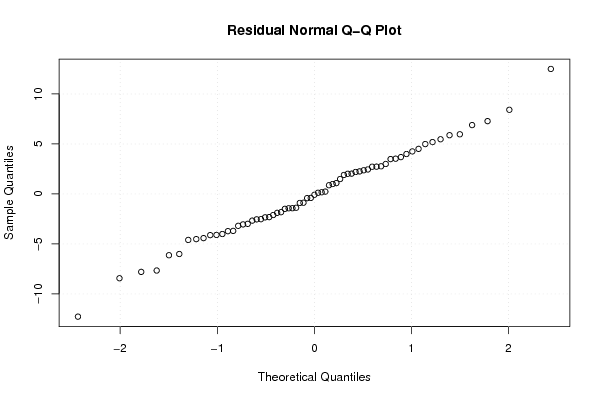
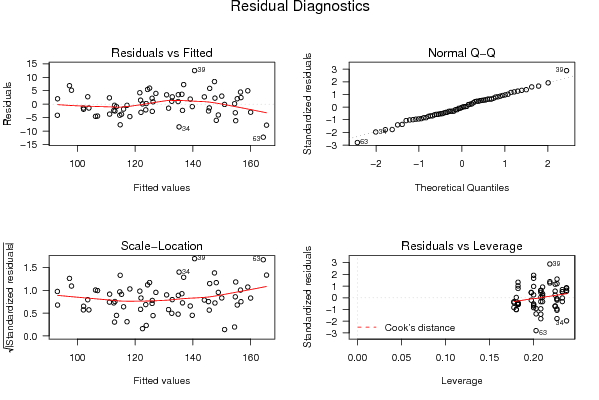
Als ik zo kijk naar de density plot en Q-Q plot, dan stel ik toch vast dat de mean van de residu's niet veel zal verschillen van 0. Het zo maar verwerpen van de assumptie dat de mean van de residu's niet constant is lijkt mij dus onvoorzichtig.

Post a new message
Dataseries X:
104.2	0
103.2	0
112.7	0
106.4	0
102.6	0
110.6	0
95.2	0
89.0	0
112.5	0
116.8	0
107.2	0
113.6	0
101.8	0
102.6	0
122.7	0
110.3	0
110.5	0
121.6	0
100.3	0
100.7	0
123.4	0
127.1	0
124.1	0
131.2	0
111.6	0
114.2	0
130.1	0
125.9	0
119.0	0
133.8	0
107.5	0
113.5	0
134.4	0
126.8	0
135.6	0
139.9	0
129.8	0
131.0	0
153.1	0
134.1	1
144.1	1
155.9	1
123.3	1
128.1	1
144.3	1
153.0	1
149.9	1
150.9	1
141.0	1
138.9	1
157.4	1
142.9	1
151.7	1
161.0	1
138.5	1
135.9	1
151.5	1
164.0	1
159.1	1
157.0	1
142.1	1
144.8	1
152.1	1
154.6	1
148.7	1
157.7	1
146.7	1


Summary of computational transaction
Raw Inputview raw input (R code)
Raw Outputview raw output of R engine
Computing time2 seconds
R Server'Gwilym Jenkins' @ 72.249.127.135

\begin{tabular}{lllllllll}
\hline
Summary of computational transaction \tabularnewline
Raw Input & view raw input (R code)  \tabularnewline
Raw Output & view raw output of R engine  \tabularnewline
Computing time & 2 seconds \tabularnewline
R Server & 'Gwilym Jenkins' @ 72.249.127.135 \tabularnewline
\hline
\end{tabular}
%Source: https://freestatistics.org/blog/index.php?pk=25535&T=0

[TABLE]
[ROW][C]Summary of computational transaction[/C][/ROW]
[ROW][C]Raw Input[/C][C]view raw input (R code) [/C][/ROW]
[ROW][C]Raw Output[/C][C]view raw output of R engine [/C][/ROW]
[ROW][C]Computing time[/C][C]2 seconds[/C][/ROW]
[ROW][C]R Server[/C][C]'Gwilym Jenkins' @ 72.249.127.135[/C][/ROW]
[/TABLE]
Source: https://freestatistics.org/blog/index.php?pk=25535&T=0

Globally Unique Identifier (entire table): ba.freestatistics.org/blog/index.php?pk=25535&T=0

As an alternative you can also use a QR Code:  

The GUIDs for individual cells are displayed in the table below:

Summary of computational transaction
Raw Inputview raw input (R code)
Raw Outputview raw output of R engine
Computing time2 seconds
R Server'Gwilym Jenkins' @ 72.249.127.135


Multiple Linear Regression - Estimated Regression Equation
y[t] = + 109.194965986394 + 5.76411564625848x[t] -12.6330328798186M1[t] -12.6835714285714M2[t] + 2.1325566893424M3[t] -8.56200113378684M4[t] -8.9125396825397M5[t] + 1.00358843537414M6[t] -21.2636167800454M7[t] -22.0778458049887M8[t] -3.04838435374149M9[t] + 0.521077097505679M10[t] -2.58946145124716M11[t] + 0.750538548752835t + e[t]

\begin{tabular}{lllllllll}
\hline
Multiple Linear Regression - Estimated Regression Equation \tabularnewline
y[t] =  +  109.194965986394 +  5.76411564625848x[t] -12.6330328798186M1[t] -12.6835714285714M2[t] +  2.1325566893424M3[t] -8.56200113378684M4[t] -8.9125396825397M5[t] +  1.00358843537414M6[t] -21.2636167800454M7[t] -22.0778458049887M8[t] -3.04838435374149M9[t] +  0.521077097505679M10[t] -2.58946145124716M11[t] +  0.750538548752835t  + e[t] \tabularnewline
\hline
\end{tabular}
%Source: https://freestatistics.org/blog/index.php?pk=25535&T=1

[TABLE]
[ROW][C]Multiple Linear Regression - Estimated Regression Equation[/C][/ROW]
[ROW][C]y[t] =  +  109.194965986394 +  5.76411564625848x[t] -12.6330328798186M1[t] -12.6835714285714M2[t] +  2.1325566893424M3[t] -8.56200113378684M4[t] -8.9125396825397M5[t] +  1.00358843537414M6[t] -21.2636167800454M7[t] -22.0778458049887M8[t] -3.04838435374149M9[t] +  0.521077097505679M10[t] -2.58946145124716M11[t] +  0.750538548752835t  + e[t][/C][/ROW]
[/TABLE]
Source: https://freestatistics.org/blog/index.php?pk=25535&T=1

Globally Unique Identifier (entire table): ba.freestatistics.org/blog/index.php?pk=25535&T=1

As an alternative you can also use a QR Code:  

The GUIDs for individual cells are displayed in the table below:

Multiple Linear Regression - Estimated Regression Equation
y[t] = + 109.194965986394 + 5.76411564625848x[t] -12.6330328798186M1[t] -12.6835714285714M2[t] + 2.1325566893424M3[t] -8.56200113378684M4[t] -8.9125396825397M5[t] + 1.00358843537414M6[t] -21.2636167800454M7[t] -22.0778458049887M8[t] -3.04838435374149M9[t] + 0.521077097505679M10[t] -2.58946145124716M11[t] + 0.750538548752835t + e[t]


Multiple Linear Regression - Ordinary Least Squares
VariableParameterS.D.T-STATH0: parameter = 02-tail p-value1-tail p-value
(Intercept)109.1949659863942.6266841.571500
x5.764115646258482.3772372.42470.0187620.009381
M1-12.63303287981862.977126-4.24348.9e-054.4e-05
M2-12.68357142857142.974374-4.26438.3e-054.1e-05
M32.13255668934242.9728440.71730.4763110.238155
M4-8.562001133786842.991534-2.86210.0060130.003007
M5-8.91253968253972.985597-2.98520.0042810.002141
M61.003588435374142.9808680.33670.737690.368845
M7-21.26361678004542.977356-7.141800
M8-22.07784580498873.112868-7.092400
M9-3.048384353741493.108773-0.98060.3312570.165629
M100.5210770975056793.1058440.16780.86740.4337
M11-2.589461451247163.104085-0.83420.4079070.203953
t0.7505385487528350.06033312.439900

\begin{tabular}{lllllllll}
\hline
Multiple Linear Regression - Ordinary Least Squares \tabularnewline
Variable & Parameter & S.D. & T-STATH0: parameter = 0 & 2-tail p-value & 1-tail p-value \tabularnewline
(Intercept) & 109.194965986394 & 2.62668 & 41.5715 & 0 & 0 \tabularnewline
x & 5.76411564625848 & 2.377237 & 2.4247 & 0.018762 & 0.009381 \tabularnewline
M1 & -12.6330328798186 & 2.977126 & -4.2434 & 8.9e-05 & 4.4e-05 \tabularnewline
M2 & -12.6835714285714 & 2.974374 & -4.2643 & 8.3e-05 & 4.1e-05 \tabularnewline
M3 & 2.1325566893424 & 2.972844 & 0.7173 & 0.476311 & 0.238155 \tabularnewline
M4 & -8.56200113378684 & 2.991534 & -2.8621 & 0.006013 & 0.003007 \tabularnewline
M5 & -8.9125396825397 & 2.985597 & -2.9852 & 0.004281 & 0.002141 \tabularnewline
M6 & 1.00358843537414 & 2.980868 & 0.3367 & 0.73769 & 0.368845 \tabularnewline
M7 & -21.2636167800454 & 2.977356 & -7.1418 & 0 & 0 \tabularnewline
M8 & -22.0778458049887 & 3.112868 & -7.0924 & 0 & 0 \tabularnewline
M9 & -3.04838435374149 & 3.108773 & -0.9806 & 0.331257 & 0.165629 \tabularnewline
M10 & 0.521077097505679 & 3.105844 & 0.1678 & 0.8674 & 0.4337 \tabularnewline
M11 & -2.58946145124716 & 3.104085 & -0.8342 & 0.407907 & 0.203953 \tabularnewline
t & 0.750538548752835 & 0.060333 & 12.4399 & 0 & 0 \tabularnewline
\hline
\end{tabular}
%Source: https://freestatistics.org/blog/index.php?pk=25535&T=2

[TABLE]
[ROW][C]Multiple Linear Regression - Ordinary Least Squares[/C][/ROW]
[ROW][C]Variable[/C][C]Parameter[/C][C]S.D.[/C][C]T-STATH0: parameter = 0[/C][C]2-tail p-value[/C][C]1-tail p-value[/C][/ROW]
[ROW][C](Intercept)[/C][C]109.194965986394[/C][C]2.62668[/C][C]41.5715[/C][C]0[/C][C]0[/C][/ROW]
[ROW][C]x[/C][C]5.76411564625848[/C][C]2.377237[/C][C]2.4247[/C][C]0.018762[/C][C]0.009381[/C][/ROW]
[ROW][C]M1[/C][C]-12.6330328798186[/C][C]2.977126[/C][C]-4.2434[/C][C]8.9e-05[/C][C]4.4e-05[/C][/ROW]
[ROW][C]M2[/C][C]-12.6835714285714[/C][C]2.974374[/C][C]-4.2643[/C][C]8.3e-05[/C][C]4.1e-05[/C][/ROW]
[ROW][C]M3[/C][C]2.1325566893424[/C][C]2.972844[/C][C]0.7173[/C][C]0.476311[/C][C]0.238155[/C][/ROW]
[ROW][C]M4[/C][C]-8.56200113378684[/C][C]2.991534[/C][C]-2.8621[/C][C]0.006013[/C][C]0.003007[/C][/ROW]
[ROW][C]M5[/C][C]-8.9125396825397[/C][C]2.985597[/C][C]-2.9852[/C][C]0.004281[/C][C]0.002141[/C][/ROW]
[ROW][C]M6[/C][C]1.00358843537414[/C][C]2.980868[/C][C]0.3367[/C][C]0.73769[/C][C]0.368845[/C][/ROW]
[ROW][C]M7[/C][C]-21.2636167800454[/C][C]2.977356[/C][C]-7.1418[/C][C]0[/C][C]0[/C][/ROW]
[ROW][C]M8[/C][C]-22.0778458049887[/C][C]3.112868[/C][C]-7.0924[/C][C]0[/C][C]0[/C][/ROW]
[ROW][C]M9[/C][C]-3.04838435374149[/C][C]3.108773[/C][C]-0.9806[/C][C]0.331257[/C][C]0.165629[/C][/ROW]
[ROW][C]M10[/C][C]0.521077097505679[/C][C]3.105844[/C][C]0.1678[/C][C]0.8674[/C][C]0.4337[/C][/ROW]
[ROW][C]M11[/C][C]-2.58946145124716[/C][C]3.104085[/C][C]-0.8342[/C][C]0.407907[/C][C]0.203953[/C][/ROW]
[ROW][C]t[/C][C]0.750538548752835[/C][C]0.060333[/C][C]12.4399[/C][C]0[/C][C]0[/C][/ROW]
[/TABLE]
Source: https://freestatistics.org/blog/index.php?pk=25535&T=2

Globally Unique Identifier (entire table): ba.freestatistics.org/blog/index.php?pk=25535&T=2

As an alternative you can also use a QR Code:  

The GUIDs for individual cells are displayed in the table below:

Multiple Linear Regression - Ordinary Least Squares
VariableParameterS.D.T-STATH0: parameter = 02-tail p-value1-tail p-value
(Intercept)109.1949659863942.6266841.571500
x5.764115646258482.3772372.42470.0187620.009381
M1-12.63303287981862.977126-4.24348.9e-054.4e-05
M2-12.68357142857142.974374-4.26438.3e-054.1e-05
M32.13255668934242.9728440.71730.4763110.238155
M4-8.562001133786842.991534-2.86210.0060130.003007
M5-8.91253968253972.985597-2.98520.0042810.002141
M61.003588435374142.9808680.33670.737690.368845
M7-21.26361678004542.977356-7.141800
M8-22.07784580498873.112868-7.092400
M9-3.048384353741493.108773-0.98060.3312570.165629
M100.5210770975056793.1058440.16780.86740.4337
M11-2.589461451247163.104085-0.83420.4079070.203953
t0.7505385487528350.06033312.439900


Multiple Linear Regression - Regression Statistics
Multiple R0.974355616693778
R-squared0.949368867782713
Adjusted R-squared0.936949910823755
F-TEST (value)76.4451371335154
F-TEST (DF numerator)13
F-TEST (DF denominator)53
p-value0
Multiple Linear Regression - Residual Statistics
Residual Standard Deviation4.90706280371496
Sum Squared Residuals1276.20106405895

\begin{tabular}{lllllllll}
\hline
Multiple Linear Regression - Regression Statistics \tabularnewline
Multiple R & 0.974355616693778 \tabularnewline
R-squared & 0.949368867782713 \tabularnewline
Adjusted R-squared & 0.936949910823755 \tabularnewline
F-TEST (value) & 76.4451371335154 \tabularnewline
F-TEST (DF numerator) & 13 \tabularnewline
F-TEST (DF denominator) & 53 \tabularnewline
p-value & 0 \tabularnewline
Multiple Linear Regression - Residual Statistics \tabularnewline
Residual Standard Deviation & 4.90706280371496 \tabularnewline
Sum Squared Residuals & 1276.20106405895 \tabularnewline
\hline
\end{tabular}
%Source: https://freestatistics.org/blog/index.php?pk=25535&T=3

[TABLE]
[ROW][C]Multiple Linear Regression - Regression Statistics[/C][/ROW]
[ROW][C]Multiple R[/C][C]0.974355616693778[/C][/ROW]
[ROW][C]R-squared[/C][C]0.949368867782713[/C][/ROW]
[ROW][C]Adjusted R-squared[/C][C]0.936949910823755[/C][/ROW]
[ROW][C]F-TEST (value)[/C][C]76.4451371335154[/C][/ROW]
[ROW][C]F-TEST (DF numerator)[/C][C]13[/C][/ROW]
[ROW][C]F-TEST (DF denominator)[/C][C]53[/C][/ROW]
[ROW][C]p-value[/C][C]0[/C][/ROW]
[ROW][C]Multiple Linear Regression - Residual Statistics[/C][/ROW]
[ROW][C]Residual Standard Deviation[/C][C]4.90706280371496[/C][/ROW]
[ROW][C]Sum Squared Residuals[/C][C]1276.20106405895[/C][/ROW]
[/TABLE]
Source: https://freestatistics.org/blog/index.php?pk=25535&T=3

Globally Unique Identifier (entire table): ba.freestatistics.org/blog/index.php?pk=25535&T=3

As an alternative you can also use a QR Code:  

The GUIDs for individual cells are displayed in the table below:

Multiple Linear Regression - Regression Statistics
Multiple R0.974355616693778
R-squared0.949368867782713
Adjusted R-squared0.936949910823755
F-TEST (value)76.4451371335154
F-TEST (DF numerator)13
F-TEST (DF denominator)53
p-value0
Multiple Linear Regression - Residual Statistics
Residual Standard Deviation4.90706280371496
Sum Squared Residuals1276.20106405895


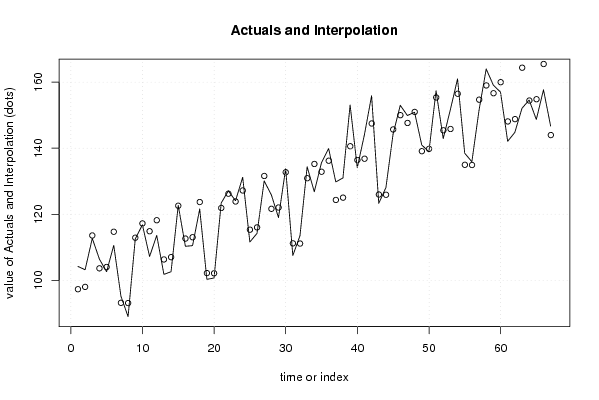
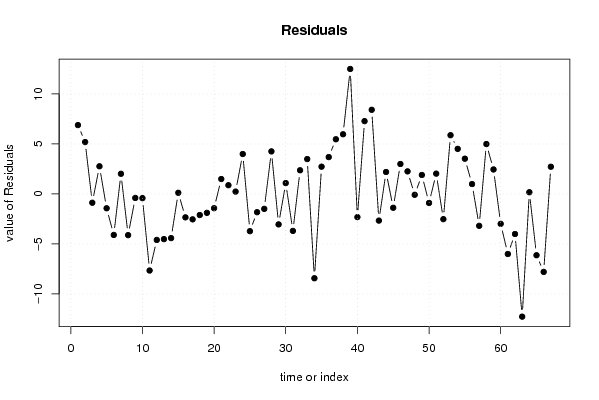
Multiple Linear Regression - Actuals, Interpolation, and Residuals
Time or IndexActualsInterpolationForecastResidualsPrediction Error
1104.297.3124716553296.88752834467097
2103.298.01247165532885.18752834467121
3112.7113.579138321995-0.879138321995444
4106.4103.6351190476192.76488095238095
5102.6104.035119047619-1.43511904761904
6110.6114.701785714286-4.10178571428572
795.293.1851190476192.01488095238098
88993.1214285714286-4.12142857142856
9112.5112.901428571429-0.401428571428566
10116.8117.221428571429-0.42142857142853
11107.2114.861428571429-7.66142857142855
12113.6118.201428571429-4.60142857142857
13101.8106.318934240363-4.51893424036275
14102.6107.018934240363-4.41893424036281
15122.7122.5856009070290.114399092970537
16110.3112.641581632653-2.34158163265306
17110.5113.041581632653-2.54158163265305
18121.6123.708248299320-2.10824829931972
19100.3102.191581632653-1.89158163265306
20100.7102.127891156463-1.42789115646258
21123.4121.9078911564631.49210884353742
22127.1126.2278911564630.872108843537406
23124.1123.8678911564630.232108843537413
24131.2127.2078911564633.9921088435374
25111.6115.325396825397-3.72539682539679
26114.2116.025396825397-1.82539682539682
27130.1131.592063492063-1.49206349206350
28125.9121.6480442176874.25195578231293
29119122.048044217687-3.04804421768708
30133.8132.7147108843541.08528911564627
31107.5111.198044217687-3.69804421768708
32113.5111.1343537414972.36564625850339
33134.4130.9143537414973.48564625850340
34126.8135.234353741497-8.43435374149661
35135.6132.8743537414972.72564625850339
36139.9136.2143537414973.68564625850340
37129.8124.3318594104315.46814058956921
38131125.0318594104315.96814058956915
39153.1140.59852607709812.5014739229025
40134.1136.418622448980-2.31862244897959
41144.1136.8186224489807.28137755102042
42155.9147.4852891156468.41471088435376
43123.3125.968622448980-2.66862244897959
44128.1125.9049319727892.19506802721088
45144.3145.684931972789-1.38493197278910
46153150.0049319727892.99506802721088
47149.9147.6449319727892.25506802721089
48150.9150.984931972789-0.0849319727891088
49141139.1024376417231.89756235827669
50138.9139.802437641723-0.90243764172335
51157.4155.369104308392.03089569160999
52142.9145.425085034014-2.5250850340136
53151.7145.8250850340145.87491496598639
54161156.4917517006804.50824829931973
55138.5134.9750850340143.52491496598639
56135.9134.9113945578230.988605442176873
57151.5154.691394557823-3.19139455782314
58164159.0113945578234.98860544217685
59159.1156.6513945578232.44860544217686
60157159.991394557823-2.99139455782314
61142.1148.108900226757-6.00890022675734
62144.8148.808900226757-4.00890022675737
63152.1164.375566893424-12.2755668934240
64154.6154.4315476190480.168452380952364
65148.7154.831547619048-6.13154761904764
66157.7165.498214285714-7.79821428571431
67146.7143.9815476190482.71845238095236

\begin{tabular}{lllllllll}
\hline
Multiple Linear Regression - Actuals, Interpolation, and Residuals \tabularnewline
Time or Index & Actuals & InterpolationForecast & ResidualsPrediction Error \tabularnewline
1 & 104.2 & 97.312471655329 & 6.88752834467097 \tabularnewline
2 & 103.2 & 98.0124716553288 & 5.18752834467121 \tabularnewline
3 & 112.7 & 113.579138321995 & -0.879138321995444 \tabularnewline
4 & 106.4 & 103.635119047619 & 2.76488095238095 \tabularnewline
5 & 102.6 & 104.035119047619 & -1.43511904761904 \tabularnewline
6 & 110.6 & 114.701785714286 & -4.10178571428572 \tabularnewline
7 & 95.2 & 93.185119047619 & 2.01488095238098 \tabularnewline
8 & 89 & 93.1214285714286 & -4.12142857142856 \tabularnewline
9 & 112.5 & 112.901428571429 & -0.401428571428566 \tabularnewline
10 & 116.8 & 117.221428571429 & -0.42142857142853 \tabularnewline
11 & 107.2 & 114.861428571429 & -7.66142857142855 \tabularnewline
12 & 113.6 & 118.201428571429 & -4.60142857142857 \tabularnewline
13 & 101.8 & 106.318934240363 & -4.51893424036275 \tabularnewline
14 & 102.6 & 107.018934240363 & -4.41893424036281 \tabularnewline
15 & 122.7 & 122.585600907029 & 0.114399092970537 \tabularnewline
16 & 110.3 & 112.641581632653 & -2.34158163265306 \tabularnewline
17 & 110.5 & 113.041581632653 & -2.54158163265305 \tabularnewline
18 & 121.6 & 123.708248299320 & -2.10824829931972 \tabularnewline
19 & 100.3 & 102.191581632653 & -1.89158163265306 \tabularnewline
20 & 100.7 & 102.127891156463 & -1.42789115646258 \tabularnewline
21 & 123.4 & 121.907891156463 & 1.49210884353742 \tabularnewline
22 & 127.1 & 126.227891156463 & 0.872108843537406 \tabularnewline
23 & 124.1 & 123.867891156463 & 0.232108843537413 \tabularnewline
24 & 131.2 & 127.207891156463 & 3.9921088435374 \tabularnewline
25 & 111.6 & 115.325396825397 & -3.72539682539679 \tabularnewline
26 & 114.2 & 116.025396825397 & -1.82539682539682 \tabularnewline
27 & 130.1 & 131.592063492063 & -1.49206349206350 \tabularnewline
28 & 125.9 & 121.648044217687 & 4.25195578231293 \tabularnewline
29 & 119 & 122.048044217687 & -3.04804421768708 \tabularnewline
30 & 133.8 & 132.714710884354 & 1.08528911564627 \tabularnewline
31 & 107.5 & 111.198044217687 & -3.69804421768708 \tabularnewline
32 & 113.5 & 111.134353741497 & 2.36564625850339 \tabularnewline
33 & 134.4 & 130.914353741497 & 3.48564625850340 \tabularnewline
34 & 126.8 & 135.234353741497 & -8.43435374149661 \tabularnewline
35 & 135.6 & 132.874353741497 & 2.72564625850339 \tabularnewline
36 & 139.9 & 136.214353741497 & 3.68564625850340 \tabularnewline
37 & 129.8 & 124.331859410431 & 5.46814058956921 \tabularnewline
38 & 131 & 125.031859410431 & 5.96814058956915 \tabularnewline
39 & 153.1 & 140.598526077098 & 12.5014739229025 \tabularnewline
40 & 134.1 & 136.418622448980 & -2.31862244897959 \tabularnewline
41 & 144.1 & 136.818622448980 & 7.28137755102042 \tabularnewline
42 & 155.9 & 147.485289115646 & 8.41471088435376 \tabularnewline
43 & 123.3 & 125.968622448980 & -2.66862244897959 \tabularnewline
44 & 128.1 & 125.904931972789 & 2.19506802721088 \tabularnewline
45 & 144.3 & 145.684931972789 & -1.38493197278910 \tabularnewline
46 & 153 & 150.004931972789 & 2.99506802721088 \tabularnewline
47 & 149.9 & 147.644931972789 & 2.25506802721089 \tabularnewline
48 & 150.9 & 150.984931972789 & -0.0849319727891088 \tabularnewline
49 & 141 & 139.102437641723 & 1.89756235827669 \tabularnewline
50 & 138.9 & 139.802437641723 & -0.90243764172335 \tabularnewline
51 & 157.4 & 155.36910430839 & 2.03089569160999 \tabularnewline
52 & 142.9 & 145.425085034014 & -2.5250850340136 \tabularnewline
53 & 151.7 & 145.825085034014 & 5.87491496598639 \tabularnewline
54 & 161 & 156.491751700680 & 4.50824829931973 \tabularnewline
55 & 138.5 & 134.975085034014 & 3.52491496598639 \tabularnewline
56 & 135.9 & 134.911394557823 & 0.988605442176873 \tabularnewline
57 & 151.5 & 154.691394557823 & -3.19139455782314 \tabularnewline
58 & 164 & 159.011394557823 & 4.98860544217685 \tabularnewline
59 & 159.1 & 156.651394557823 & 2.44860544217686 \tabularnewline
60 & 157 & 159.991394557823 & -2.99139455782314 \tabularnewline
61 & 142.1 & 148.108900226757 & -6.00890022675734 \tabularnewline
62 & 144.8 & 148.808900226757 & -4.00890022675737 \tabularnewline
63 & 152.1 & 164.375566893424 & -12.2755668934240 \tabularnewline
64 & 154.6 & 154.431547619048 & 0.168452380952364 \tabularnewline
65 & 148.7 & 154.831547619048 & -6.13154761904764 \tabularnewline
66 & 157.7 & 165.498214285714 & -7.79821428571431 \tabularnewline
67 & 146.7 & 143.981547619048 & 2.71845238095236 \tabularnewline
\hline
\end{tabular}
%Source: https://freestatistics.org/blog/index.php?pk=25535&T=4

[TABLE]
[ROW][C]Multiple Linear Regression - Actuals, Interpolation, and Residuals[/C][/ROW]
[ROW][C]Time or Index[/C][C]Actuals[/C][C]InterpolationForecast[/C][C]ResidualsPrediction Error[/C][/ROW]
[ROW][C]1[/C][C]104.2[/C][C]97.312471655329[/C][C]6.88752834467097[/C][/ROW]
[ROW][C]2[/C][C]103.2[/C][C]98.0124716553288[/C][C]5.18752834467121[/C][/ROW]
[ROW][C]3[/C][C]112.7[/C][C]113.579138321995[/C][C]-0.879138321995444[/C][/ROW]
[ROW][C]4[/C][C]106.4[/C][C]103.635119047619[/C][C]2.76488095238095[/C][/ROW]
[ROW][C]5[/C][C]102.6[/C][C]104.035119047619[/C][C]-1.43511904761904[/C][/ROW]
[ROW][C]6[/C][C]110.6[/C][C]114.701785714286[/C][C]-4.10178571428572[/C][/ROW]
[ROW][C]7[/C][C]95.2[/C][C]93.185119047619[/C][C]2.01488095238098[/C][/ROW]
[ROW][C]8[/C][C]89[/C][C]93.1214285714286[/C][C]-4.12142857142856[/C][/ROW]
[ROW][C]9[/C][C]112.5[/C][C]112.901428571429[/C][C]-0.401428571428566[/C][/ROW]
[ROW][C]10[/C][C]116.8[/C][C]117.221428571429[/C][C]-0.42142857142853[/C][/ROW]
[ROW][C]11[/C][C]107.2[/C][C]114.861428571429[/C][C]-7.66142857142855[/C][/ROW]
[ROW][C]12[/C][C]113.6[/C][C]118.201428571429[/C][C]-4.60142857142857[/C][/ROW]
[ROW][C]13[/C][C]101.8[/C][C]106.318934240363[/C][C]-4.51893424036275[/C][/ROW]
[ROW][C]14[/C][C]102.6[/C][C]107.018934240363[/C][C]-4.41893424036281[/C][/ROW]
[ROW][C]15[/C][C]122.7[/C][C]122.585600907029[/C][C]0.114399092970537[/C][/ROW]
[ROW][C]16[/C][C]110.3[/C][C]112.641581632653[/C][C]-2.34158163265306[/C][/ROW]
[ROW][C]17[/C][C]110.5[/C][C]113.041581632653[/C][C]-2.54158163265305[/C][/ROW]
[ROW][C]18[/C][C]121.6[/C][C]123.708248299320[/C][C]-2.10824829931972[/C][/ROW]
[ROW][C]19[/C][C]100.3[/C][C]102.191581632653[/C][C]-1.89158163265306[/C][/ROW]
[ROW][C]20[/C][C]100.7[/C][C]102.127891156463[/C][C]-1.42789115646258[/C][/ROW]
[ROW][C]21[/C][C]123.4[/C][C]121.907891156463[/C][C]1.49210884353742[/C][/ROW]
[ROW][C]22[/C][C]127.1[/C][C]126.227891156463[/C][C]0.872108843537406[/C][/ROW]
[ROW][C]23[/C][C]124.1[/C][C]123.867891156463[/C][C]0.232108843537413[/C][/ROW]
[ROW][C]24[/C][C]131.2[/C][C]127.207891156463[/C][C]3.9921088435374[/C][/ROW]
[ROW][C]25[/C][C]111.6[/C][C]115.325396825397[/C][C]-3.72539682539679[/C][/ROW]
[ROW][C]26[/C][C]114.2[/C][C]116.025396825397[/C][C]-1.82539682539682[/C][/ROW]
[ROW][C]27[/C][C]130.1[/C][C]131.592063492063[/C][C]-1.49206349206350[/C][/ROW]
[ROW][C]28[/C][C]125.9[/C][C]121.648044217687[/C][C]4.25195578231293[/C][/ROW]
[ROW][C]29[/C][C]119[/C][C]122.048044217687[/C][C]-3.04804421768708[/C][/ROW]
[ROW][C]30[/C][C]133.8[/C][C]132.714710884354[/C][C]1.08528911564627[/C][/ROW]
[ROW][C]31[/C][C]107.5[/C][C]111.198044217687[/C][C]-3.69804421768708[/C][/ROW]
[ROW][C]32[/C][C]113.5[/C][C]111.134353741497[/C][C]2.36564625850339[/C][/ROW]
[ROW][C]33[/C][C]134.4[/C][C]130.914353741497[/C][C]3.48564625850340[/C][/ROW]
[ROW][C]34[/C][C]126.8[/C][C]135.234353741497[/C][C]-8.43435374149661[/C][/ROW]
[ROW][C]35[/C][C]135.6[/C][C]132.874353741497[/C][C]2.72564625850339[/C][/ROW]
[ROW][C]36[/C][C]139.9[/C][C]136.214353741497[/C][C]3.68564625850340[/C][/ROW]
[ROW][C]37[/C][C]129.8[/C][C]124.331859410431[/C][C]5.46814058956921[/C][/ROW]
[ROW][C]38[/C][C]131[/C][C]125.031859410431[/C][C]5.96814058956915[/C][/ROW]
[ROW][C]39[/C][C]153.1[/C][C]140.598526077098[/C][C]12.5014739229025[/C][/ROW]
[ROW][C]40[/C][C]134.1[/C][C]136.418622448980[/C][C]-2.31862244897959[/C][/ROW]
[ROW][C]41[/C][C]144.1[/C][C]136.818622448980[/C][C]7.28137755102042[/C][/ROW]
[ROW][C]42[/C][C]155.9[/C][C]147.485289115646[/C][C]8.41471088435376[/C][/ROW]
[ROW][C]43[/C][C]123.3[/C][C]125.968622448980[/C][C]-2.66862244897959[/C][/ROW]
[ROW][C]44[/C][C]128.1[/C][C]125.904931972789[/C][C]2.19506802721088[/C][/ROW]
[ROW][C]45[/C][C]144.3[/C][C]145.684931972789[/C][C]-1.38493197278910[/C][/ROW]
[ROW][C]46[/C][C]153[/C][C]150.004931972789[/C][C]2.99506802721088[/C][/ROW]
[ROW][C]47[/C][C]149.9[/C][C]147.644931972789[/C][C]2.25506802721089[/C][/ROW]
[ROW][C]48[/C][C]150.9[/C][C]150.984931972789[/C][C]-0.0849319727891088[/C][/ROW]
[ROW][C]49[/C][C]141[/C][C]139.102437641723[/C][C]1.89756235827669[/C][/ROW]
[ROW][C]50[/C][C]138.9[/C][C]139.802437641723[/C][C]-0.90243764172335[/C][/ROW]
[ROW][C]51[/C][C]157.4[/C][C]155.36910430839[/C][C]2.03089569160999[/C][/ROW]
[ROW][C]52[/C][C]142.9[/C][C]145.425085034014[/C][C]-2.5250850340136[/C][/ROW]
[ROW][C]53[/C][C]151.7[/C][C]145.825085034014[/C][C]5.87491496598639[/C][/ROW]
[ROW][C]54[/C][C]161[/C][C]156.491751700680[/C][C]4.50824829931973[/C][/ROW]
[ROW][C]55[/C][C]138.5[/C][C]134.975085034014[/C][C]3.52491496598639[/C][/ROW]
[ROW][C]56[/C][C]135.9[/C][C]134.911394557823[/C][C]0.988605442176873[/C][/ROW]
[ROW][C]57[/C][C]151.5[/C][C]154.691394557823[/C][C]-3.19139455782314[/C][/ROW]
[ROW][C]58[/C][C]164[/C][C]159.011394557823[/C][C]4.98860544217685[/C][/ROW]
[ROW][C]59[/C][C]159.1[/C][C]156.651394557823[/C][C]2.44860544217686[/C][/ROW]
[ROW][C]60[/C][C]157[/C][C]159.991394557823[/C][C]-2.99139455782314[/C][/ROW]
[ROW][C]61[/C][C]142.1[/C][C]148.108900226757[/C][C]-6.00890022675734[/C][/ROW]
[ROW][C]62[/C][C]144.8[/C][C]148.808900226757[/C][C]-4.00890022675737[/C][/ROW]
[ROW][C]63[/C][C]152.1[/C][C]164.375566893424[/C][C]-12.2755668934240[/C][/ROW]
[ROW][C]64[/C][C]154.6[/C][C]154.431547619048[/C][C]0.168452380952364[/C][/ROW]
[ROW][C]65[/C][C]148.7[/C][C]154.831547619048[/C][C]-6.13154761904764[/C][/ROW]
[ROW][C]66[/C][C]157.7[/C][C]165.498214285714[/C][C]-7.79821428571431[/C][/ROW]
[ROW][C]67[/C][C]146.7[/C][C]143.981547619048[/C][C]2.71845238095236[/C][/ROW]
[/TABLE]
Source: https://freestatistics.org/blog/index.php?pk=25535&T=4

Globally Unique Identifier (entire table): ba.freestatistics.org/blog/index.php?pk=25535&T=4

As an alternative you can also use a QR Code:  

The GUIDs for individual cells are displayed in the table below:

Multiple Linear Regression - Actuals, Interpolation, and Residuals
Time or IndexActualsInterpolationForecastResidualsPrediction Error
1104.297.3124716553296.88752834467097
2103.298.01247165532885.18752834467121
3112.7113.579138321995-0.879138321995444
4106.4103.6351190476192.76488095238095
5102.6104.035119047619-1.43511904761904
6110.6114.701785714286-4.10178571428572
795.293.1851190476192.01488095238098
88993.1214285714286-4.12142857142856
9112.5112.901428571429-0.401428571428566
10116.8117.221428571429-0.42142857142853
11107.2114.861428571429-7.66142857142855
12113.6118.201428571429-4.60142857142857
13101.8106.318934240363-4.51893424036275
14102.6107.018934240363-4.41893424036281
15122.7122.5856009070290.114399092970537
16110.3112.641581632653-2.34158163265306
17110.5113.041581632653-2.54158163265305
18121.6123.708248299320-2.10824829931972
19100.3102.191581632653-1.89158163265306
20100.7102.127891156463-1.42789115646258
21123.4121.9078911564631.49210884353742
22127.1126.2278911564630.872108843537406
23124.1123.8678911564630.232108843537413
24131.2127.2078911564633.9921088435374
25111.6115.325396825397-3.72539682539679
26114.2116.025396825397-1.82539682539682
27130.1131.592063492063-1.49206349206350
28125.9121.6480442176874.25195578231293
29119122.048044217687-3.04804421768708
30133.8132.7147108843541.08528911564627
31107.5111.198044217687-3.69804421768708
32113.5111.1343537414972.36564625850339
33134.4130.9143537414973.48564625850340
34126.8135.234353741497-8.43435374149661
35135.6132.8743537414972.72564625850339
36139.9136.2143537414973.68564625850340
37129.8124.3318594104315.46814058956921
38131125.0318594104315.96814058956915
39153.1140.59852607709812.5014739229025
40134.1136.418622448980-2.31862244897959
41144.1136.8186224489807.28137755102042
42155.9147.4852891156468.41471088435376
43123.3125.968622448980-2.66862244897959
44128.1125.9049319727892.19506802721088
45144.3145.684931972789-1.38493197278910
46153150.0049319727892.99506802721088
47149.9147.6449319727892.25506802721089
48150.9150.984931972789-0.0849319727891088
49141139.1024376417231.89756235827669
50138.9139.802437641723-0.90243764172335
51157.4155.369104308392.03089569160999
52142.9145.425085034014-2.5250850340136
53151.7145.8250850340145.87491496598639
54161156.4917517006804.50824829931973
55138.5134.9750850340143.52491496598639
56135.9134.9113945578230.988605442176873
57151.5154.691394557823-3.19139455782314
58164159.0113945578234.98860544217685
59159.1156.6513945578232.44860544217686
60157159.991394557823-2.99139455782314
61142.1148.108900226757-6.00890022675734
62144.8148.808900226757-4.00890022675737
63152.1164.375566893424-12.2755668934240
64154.6154.4315476190480.168452380952364
65148.7154.831547619048-6.13154761904764
66157.7165.498214285714-7.79821428571431
67146.7143.9815476190482.71845238095236


Parameters (Session):
par1 = 1 ; par2 = Include Monthly Dummies ; par3 = Linear Trend ;
Parameters (R input):
par1 = 1 ; par2 = Include Monthly Dummies ; par3 = Linear Trend ;
R code (references can be found in the software module):
library(lattice)
par1 <- as.numeric(par1)
x <- t(y)
k <- length(x[1,])
n <- length(x[,1])
x1 <- cbind(x[,par1], x[,1:k!=par1])
mycolnames <- c(colnames(x)[par1], colnames(x)[1:k!=par1])
colnames(x1) <- mycolnames #colnames(x)[par1]
x <- x1
if (par3 == 'First Differences'){
x2 <- array(0, dim=c(n-1,k), dimnames=list(1:(n-1), paste('(1-B)',colnames(x),sep='')))
for (i in 1:n-1) {
for (j in 1:k) {
x2[i,j] <- x[i+1,j] - x[i,j]
}
}
x <- x2
}
if (par2 == 'Include Monthly Dummies'){
x2 <- array(0, dim=c(n,11), dimnames=list(1:n, paste('M', seq(1:11), sep ='')))
for (i in 1:11){
x2[seq(i,n,12),i] <- 1
}
x <- cbind(x, x2)
}
if (par2 == 'Include Quarterly Dummies'){
x2 <- array(0, dim=c(n,3), dimnames=list(1:n, paste('Q', seq(1:3), sep ='')))
for (i in 1:3){
x2[seq(i,n,4),i] <- 1
}
x <- cbind(x, x2)
}
k <- length(x[1,])
if (par3 == 'Linear Trend'){
x <- cbind(x, c(1:n))
colnames(x)[k+1] <- 't'
}
x
k <- length(x[1,])
df <- as.data.frame(x)
(mylm <- lm(df))
(mysum <- summary(mylm))
bitmap(file='test0.png')
plot(x[,1], type='l', main='Actuals and Interpolation', ylab='value of Actuals and Interpolation (dots)', xlab='time or index')
points(x[,1]-mysum$resid)
grid()
dev.off()
bitmap(file='test1.png')
plot(mysum$resid, type='b', pch=19, main='Residuals', ylab='value of Residuals', xlab='time or index')
grid()
dev.off()
bitmap(file='test2.png')
hist(mysum$resid, main='Residual Histogram', xlab='values of Residuals')
grid()
dev.off()
bitmap(file='test3.png')
densityplot(~mysum$resid,col='black',main='Residual Density Plot', xlab='values of Residuals')
dev.off()
bitmap(file='test4.png')
qqnorm(mysum$resid, main='Residual Normal Q-Q Plot')
grid()
dev.off()
(myerror <- as.ts(mysum$resid))
bitmap(file='test5.png')
dum <- cbind(lag(myerror,k=1),myerror)
dum
dum1 <- dum[2:length(myerror),]
dum1
z <- as.data.frame(dum1)
z
plot(z,main=paste('Residual Lag plot, lowess, and regression line'), ylab='values of Residuals', xlab='lagged values of Residuals')
lines(lowess(z))
abline(lm(z))
grid()
dev.off()
bitmap(file='test6.png')
acf(mysum$resid, lag.max=length(mysum$resid)/2, main='Residual Autocorrelation Function')
grid()
dev.off()
bitmap(file='test7.png')
pacf(mysum$resid, lag.max=length(mysum$resid)/2, main='Residual Partial Autocorrelation Function')
grid()
dev.off()
bitmap(file='test8.png')
opar <- par(mfrow = c(2,2), oma = c(0, 0, 1.1, 0))
plot(mylm, las = 1, sub='Residual Diagnostics')
par(opar)
dev.off()
load(file='createtable')
a<-table.start()
a<-table.row.start(a)
a<-table.element(a, 'Multiple Linear Regression - Estimated Regression Equation', 1, TRUE)
a<-table.row.end(a)
myeq <- colnames(x)[1]
myeq <- paste(myeq, '[t] = ', sep='')
for (i in 1:k){
if (mysum$coefficients[i,1] > 0) myeq <- paste(myeq, '+', '')
myeq <- paste(myeq, mysum$coefficients[i,1], sep=' ')
if (rownames(mysum$coefficients)[i] != '(Intercept)') {
myeq <- paste(myeq, rownames(mysum$coefficients)[i], sep='')
if (rownames(mysum$coefficients)[i] != 't') myeq <- paste(myeq, '[t]', sep='')
}
}
myeq <- paste(myeq, ' + e[t]')
a<-table.row.start(a)
a<-table.element(a, myeq)
a<-table.row.end(a)
a<-table.end(a)
table.save(a,file='mytable1.tab')
a<-table.start()
a<-table.row.start(a)
a<-table.element(a,hyperlink('ols1.htm','Multiple Linear Regression - Ordinary Least Squares',''), 6, TRUE)
a<-table.row.end(a)
a<-table.row.start(a)
a<-table.element(a,'Variable',header=TRUE)
a<-table.element(a,'Parameter',header=TRUE)
a<-table.element(a,'S.D.',header=TRUE)
a<-table.element(a,'T-STAT
H0: parameter = 0',header=TRUE)
a<-table.element(a,'2-tail p-value',header=TRUE)
a<-table.element(a,'1-tail p-value',header=TRUE)
a<-table.row.end(a)
for (i in 1:k){
a<-table.row.start(a)
a<-table.element(a,rownames(mysum$coefficients)[i],header=TRUE)
a<-table.element(a,mysum$coefficients[i,1])
a<-table.element(a, round(mysum$coefficients[i,2],6))
a<-table.element(a, round(mysum$coefficients[i,3],4))
a<-table.element(a, round(mysum$coefficients[i,4],6))
a<-table.element(a, round(mysum$coefficients[i,4]/2,6))
a<-table.row.end(a)
}
a<-table.end(a)
table.save(a,file='mytable2.tab')
a<-table.start()
a<-table.row.start(a)
a<-table.element(a, 'Multiple Linear Regression - Regression Statistics', 2, TRUE)
a<-table.row.end(a)
a<-table.row.start(a)
a<-table.element(a, 'Multiple R',1,TRUE)
a<-table.element(a, sqrt(mysum$r.squared))
a<-table.row.end(a)
a<-table.row.start(a)
a<-table.element(a, 'R-squared',1,TRUE)
a<-table.element(a, mysum$r.squared)
a<-table.row.end(a)
a<-table.row.start(a)
a<-table.element(a, 'Adjusted R-squared',1,TRUE)
a<-table.element(a, mysum$adj.r.squared)
a<-table.row.end(a)
a<-table.row.start(a)
a<-table.element(a, 'F-TEST (value)',1,TRUE)
a<-table.element(a, mysum$fstatistic[1])
a<-table.row.end(a)
a<-table.row.start(a)
a<-table.element(a, 'F-TEST (DF numerator)',1,TRUE)
a<-table.element(a, mysum$fstatistic[2])
a<-table.row.end(a)
a<-table.row.start(a)
a<-table.element(a, 'F-TEST (DF denominator)',1,TRUE)
a<-table.element(a, mysum$fstatistic[3])
a<-table.row.end(a)
a<-table.row.start(a)
a<-table.element(a, 'p-value',1,TRUE)
a<-table.element(a, 1-pf(mysum$fstatistic[1],mysum$fstatistic[2],mysum$fstatistic[3]))
a<-table.row.end(a)
a<-table.row.start(a)
a<-table.element(a, 'Multiple Linear Regression - Residual Statistics', 2, TRUE)
a<-table.row.end(a)
a<-table.row.start(a)
a<-table.element(a, 'Residual Standard Deviation',1,TRUE)
a<-table.element(a, mysum$sigma)
a<-table.row.end(a)
a<-table.row.start(a)
a<-table.element(a, 'Sum Squared Residuals',1,TRUE)
a<-table.element(a, sum(myerror*myerror))
a<-table.row.end(a)
a<-table.end(a)
table.save(a,file='mytable3.tab')
a<-table.start()
a<-table.row.start(a)
a<-table.element(a, 'Multiple Linear Regression - Actuals, Interpolation, and Residuals', 4, TRUE)
a<-table.row.end(a)
a<-table.row.start(a)
a<-table.element(a, 'Time or Index', 1, TRUE)
a<-table.element(a, 'Actuals', 1, TRUE)
a<-table.element(a, 'Interpolation
Forecast', 1, TRUE)
a<-table.element(a, 'Residuals
Prediction Error', 1, TRUE)
a<-table.row.end(a)
for (i in 1:n) {
a<-table.row.start(a)
a<-table.element(a,i, 1, TRUE)
a<-table.element(a,x[i])
a<-table.element(a,x[i]-mysum$resid[i])
a<-table.element(a,mysum$resid[i])
a<-table.row.end(a)
}
a<-table.end(a)
table.save(a,file='mytable4.tab')