Free Statistics

of Irreproducible Research!

Author's title

Author*The author of this computation has been verified*
R Software Modulerwasp_multipleregression.wasp
Title produced by softwareMultiple Regression
Date of computationMon, 24 Nov 2008 13:42:13 -0700
Cite this page as followsStatistical Computations at FreeStatistics.org, Office for Research Development and Education, URL https://freestatistics.org/blog/index.php?v=date/2008/Nov/24/t1227559651po80z6kq8wai37k.htm/, Retrieved Mon, 13 May 2024 21:02:08 +0000
Statistical Computations at FreeStatistics.org, Office for Research Development and Education, URL https://freestatistics.org/blog/index.php?pk=25527, Retrieved Mon, 13 May 2024 21:02:08 +0000
QR Codes:

Original text written by user:
IsPrivate?No (this computation is public)
User-defined keywordsMultiple Lineair Regression
Estimated Impact163
Family? (F = Feedback message, R = changed R code, M = changed R Module, P = changed Parameters, D = changed Data)
-     [Multiple Regression] [Multiple Lineair ...] [2008-11-23 13:54:18] [b635de6fc42b001d22cbe6e730fec936]
F   P   [Multiple Regression] [Multiple Lineair ...] [2008-11-24 10:32:50] [b635de6fc42b001d22cbe6e730fec936]
F    D      [Multiple Regression] [Multiple Lineair ...] [2008-11-24 20:42:13] [f4b2017b314c03698059f43b95818e67] [Current]
Feedback Forum
2008-11-30 16:14:40 [Michael Van Spaandonck] [reply
In dit model is rekening gehouden met seasonal dummies en een lineaire trend

Volgens de Adjusted R-square valt 69% van de schommelingen te verklaren door middel van dit model. Aangezien de p-waarde echter 2,76 bedraagt mag gesteld worden dat deze 69% niet significant verschilt van nulhypothese H0 = 0.
Dit wordt niet behandeld door de student.

Wanneer we de tabel van de ordinary least squares bekijken zien we dat de meeste parameters (maandwaarden) negatief zijn, wat wil zeggen dat er in deze maanden een lager percentage geldt dan in de referentiemaand. Slechts 2 zijn positief, wat duidt op een hoger percentage.
Wordt niet behandeld in het document.

Zoals gezegd is de parameter voor de nulhypothese 0, wat wil zeggen dat we ervan uit gaan dat de beurscrash niet van invloed is op de werkloosheid.
Er wordt terecht gekozen voor een eenzijdige test. 9 maanden hebben daarbij een p-waarde die hoger ligt dan 5%, wat betekent dat deze wijzigingen in het maandelijkse werkloosheidscijfer waarschijnlijk toe te schrijven zijn aan het toeval.
De student vermeldt slechts dat de p-waarden positief zijn, zonder hieruit verder conclusies te trekken.

De grafiek van Actuals & Interpolation vertoont een aflopend verloop.
In principe benaderen de voorspellingen (interpolations, de stippen) de actuals (lijn) vrij goed, maar tussen waarnemingen 20 en 34 zijn de afwijkingen vrij groot.
Wordt niet behandeld in het document.

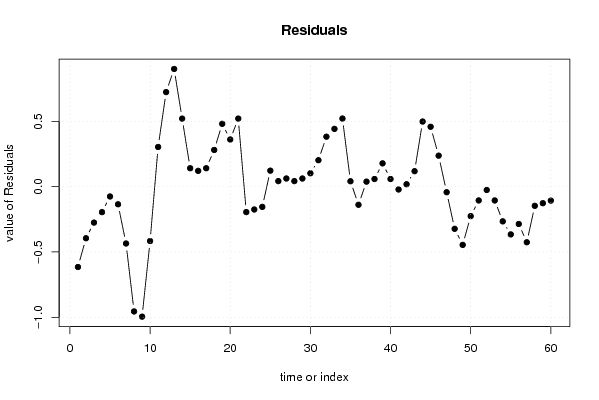
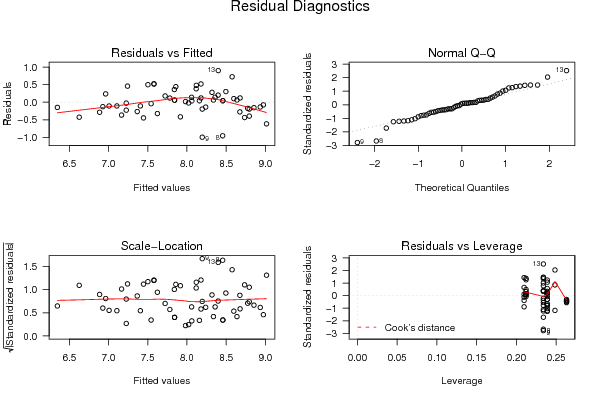
Er mag gesteld worden dat het gemiddelde van de residuals 0 benadert. Dit betekent in een verdergaande analyse in feite dat er een fixed variation is.
De student komt ook tot deze conclusie.

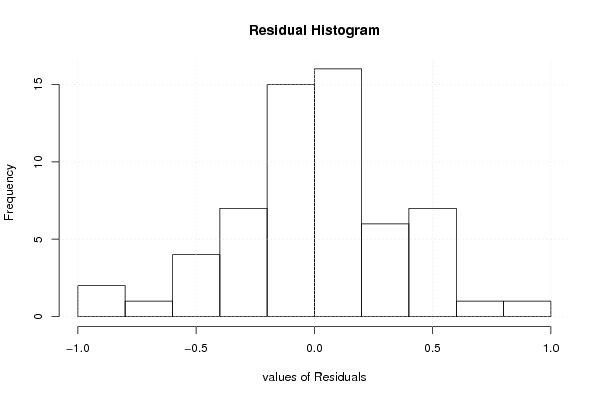
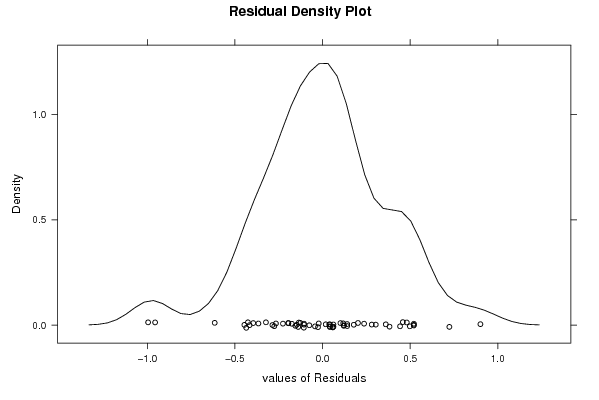
Histogram en density plot geven geven een vrij goede normaalverdeling weer. Dit betekent in een verdergaande analyse in feite dat er een fixed distribution is.
Studnet stelt dat dit het geval is.

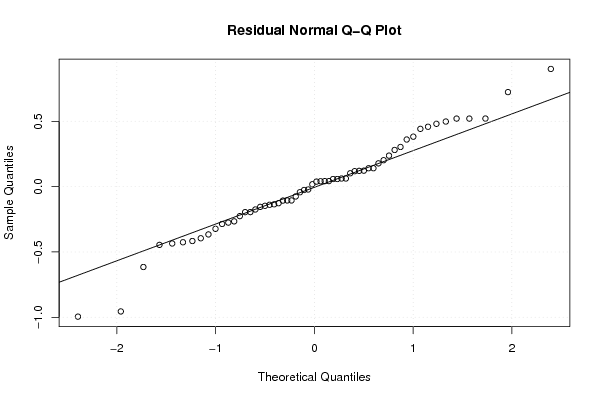
Op het Q-Q plot zien we dat de punten vrij dicht bij de rechte liggen. Deze grafiek bevestigt dus de overige twee.
Wordt niet besproken door de student.

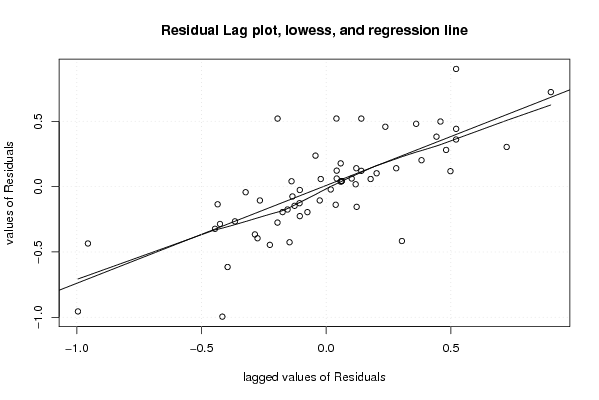
Het residuals lag plot geeft een lage correlatie weer tussen de voorspellingsfout nu en de voorspellingsfout van de voorgaande maand.
Student stelt dat dit het geval is.

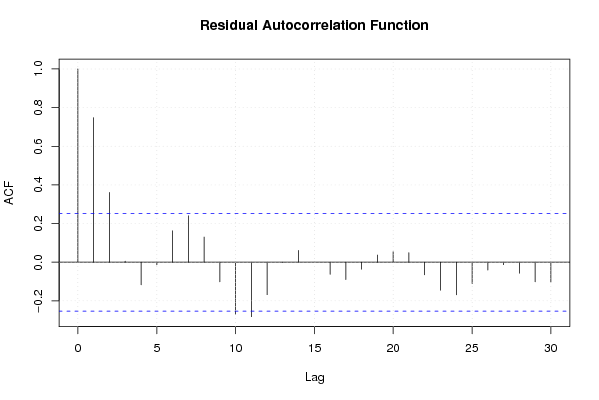
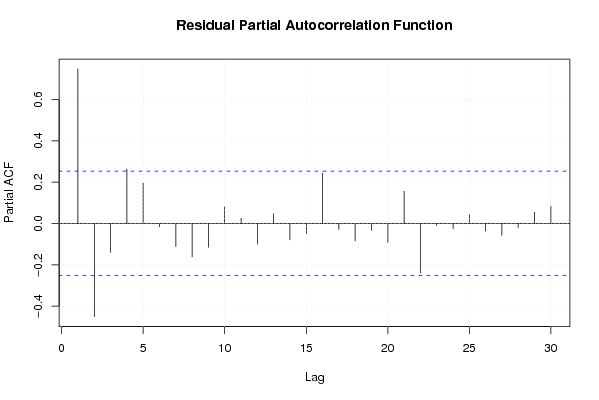
Tot slot de grafiek van de autocorrelatie.
Bij een lag van 12 zien we dat de autocorrelatie binnen het interval valt, en dat er dus van toeval geen sprake is.
Wordt ook door de student geconcludeerd.

Post a new message
Dataseries X:
8.4	0
8.4	0
8.4	0
8.6	0
8.9	0
8.8	0
8.3	0
7.5	0
7.2	0
7.5	0
8.8	0
9.3	0
9.3	0
8.7	0
8.2	0
8.3	0
8.5	0
8.6	0
8.6	0
8.2	0
8.1	0
8	1
8.6	1
8.7	1
8.8	1
8.5	1
8.4	1
8.5	1
8.7	1
8.7	1
8.6	1
8.5	1
8.3	1
8.1	1
8.2	1
8.1	1
8.1	1
7.9	1
7.9	1
7.9	1
8	1
8	1
7.9	1
8	1
7.7	1
7.2	1
7.5	1
7.3	1
7	1
7	1
7	1
7.2	1
7.3	1
7.1	1
6.8	1
6.6	1
6.2	1
6.2	1
6.8	1
6.9	1


Summary of computational transaction
Raw Inputview raw input (R code)
Raw Outputview raw output of R engine
Computing time3 seconds
R Server'George Udny Yule' @ 72.249.76.132

\begin{tabular}{lllllllll}
\hline
Summary of computational transaction \tabularnewline
Raw Input & view raw input (R code)  \tabularnewline
Raw Output & view raw output of R engine  \tabularnewline
Computing time & 3 seconds \tabularnewline
R Server & 'George Udny Yule' @ 72.249.76.132 \tabularnewline
\hline
\end{tabular}
%Source: https://freestatistics.org/blog/index.php?pk=25527&T=0

[TABLE]
[ROW][C]Summary of computational transaction[/C][/ROW]
[ROW][C]Raw Input[/C][C]view raw input (R code) [/C][/ROW]
[ROW][C]Raw Output[/C][C]view raw output of R engine [/C][/ROW]
[ROW][C]Computing time[/C][C]3 seconds[/C][/ROW]
[ROW][C]R Server[/C][C]'George Udny Yule' @ 72.249.76.132[/C][/ROW]
[/TABLE]
Source: https://freestatistics.org/blog/index.php?pk=25527&T=0

Globally Unique Identifier (entire table): ba.freestatistics.org/blog/index.php?pk=25527&T=0

As an alternative you can also use a QR Code:  

The GUIDs for individual cells are displayed in the table below:

Summary of computational transaction
Raw Inputview raw input (R code)
Raw Outputview raw output of R engine
Computing time3 seconds
R Server'George Udny Yule' @ 72.249.76.132


Multiple Linear Regression - Estimated Regression Equation
Totaal%werkzoekenden[t] = + 9.19236363636363 + 0.894545454545455stockmarketcrashfollowedbyeconomicdepression[t] -0.125757575757581M1[t] -0.294424242424242M2[t] -0.363090909090908M3[t] -0.191757575757574M4[t] + 0.0395757575757589M5[t] + 0.0509090909090923M6[t] -0.0977575757575742M7[t] -0.326424242424242M8[t] -0.535090909090908M9[t] -0.762666666666665M10[t] -0.131333333333332M11[t] -0.0513333333333333t + e[t]

\begin{tabular}{lllllllll}
\hline
Multiple Linear Regression - Estimated Regression Equation \tabularnewline
Totaal%werkzoekenden[t] =  +  9.19236363636363 +  0.894545454545455stockmarketcrashfollowedbyeconomicdepression[t] -0.125757575757581M1[t] -0.294424242424242M2[t] -0.363090909090908M3[t] -0.191757575757574M4[t] +  0.0395757575757589M5[t] +  0.0509090909090923M6[t] -0.0977575757575742M7[t] -0.326424242424242M8[t] -0.535090909090908M9[t] -0.762666666666665M10[t] -0.131333333333332M11[t] -0.0513333333333333t  + e[t] \tabularnewline
\hline
\end{tabular}
%Source: https://freestatistics.org/blog/index.php?pk=25527&T=1

[TABLE]
[ROW][C]Multiple Linear Regression - Estimated Regression Equation[/C][/ROW]
[ROW][C]Totaal%werkzoekenden[t] =  +  9.19236363636363 +  0.894545454545455stockmarketcrashfollowedbyeconomicdepression[t] -0.125757575757581M1[t] -0.294424242424242M2[t] -0.363090909090908M3[t] -0.191757575757574M4[t] +  0.0395757575757589M5[t] +  0.0509090909090923M6[t] -0.0977575757575742M7[t] -0.326424242424242M8[t] -0.535090909090908M9[t] -0.762666666666665M10[t] -0.131333333333332M11[t] -0.0513333333333333t  + e[t][/C][/ROW]
[/TABLE]
Source: https://freestatistics.org/blog/index.php?pk=25527&T=1

Globally Unique Identifier (entire table): ba.freestatistics.org/blog/index.php?pk=25527&T=1

As an alternative you can also use a QR Code:  

The GUIDs for individual cells are displayed in the table below:

Multiple Linear Regression - Estimated Regression Equation
Totaal%werkzoekenden[t] = + 9.19236363636363 + 0.894545454545455stockmarketcrashfollowedbyeconomicdepression[t] -0.125757575757581M1[t] -0.294424242424242M2[t] -0.363090909090908M3[t] -0.191757575757574M4[t] + 0.0395757575757589M5[t] + 0.0509090909090923M6[t] -0.0977575757575742M7[t] -0.326424242424242M8[t] -0.535090909090908M9[t] -0.762666666666665M10[t] -0.131333333333332M11[t] -0.0513333333333333t + e[t]


Multiple Linear Regression - Ordinary Least Squares
VariableParameterS.D.T-STATH0: parameter = 02-tail p-value1-tail p-value
(Intercept)9.192363636363630.21420842.913200
stockmarketcrashfollowedbyeconomicdepression0.8945454545454550.2010664.4495.4e-052.7e-05
M1-0.1257575757575810.260735-0.48230.6318670.315933
M2-0.2944242424242420.260202-1.13150.2636990.13185
M3-0.3630909090909080.259786-1.39770.1689210.084461
M4-0.1917575757575740.259489-0.7390.4636720.231836
M50.03957575757575890.259310.15260.8793660.439683
M60.05090909090909230.259250.19640.8451850.422593
M7-0.09775757575757420.25931-0.3770.7079140.353957
M8-0.3264242424242420.259489-1.2580.2147570.107379
M9-0.5350909090909080.259786-2.05970.0451080.022554
M10-0.7626666666666650.258513-2.95020.0049810.00249
M11-0.1313333333333320.258334-0.50840.6136120.306806
t-0.05133333333333330.005557-9.237300

\begin{tabular}{lllllllll}
\hline
Multiple Linear Regression - Ordinary Least Squares \tabularnewline
Variable & Parameter & S.D. & T-STATH0: parameter = 0 & 2-tail p-value & 1-tail p-value \tabularnewline
(Intercept) & 9.19236363636363 & 0.214208 & 42.9132 & 0 & 0 \tabularnewline
stockmarketcrashfollowedbyeconomicdepression & 0.894545454545455 & 0.201066 & 4.449 & 5.4e-05 & 2.7e-05 \tabularnewline
M1 & -0.125757575757581 & 0.260735 & -0.4823 & 0.631867 & 0.315933 \tabularnewline
M2 & -0.294424242424242 & 0.260202 & -1.1315 & 0.263699 & 0.13185 \tabularnewline
M3 & -0.363090909090908 & 0.259786 & -1.3977 & 0.168921 & 0.084461 \tabularnewline
M4 & -0.191757575757574 & 0.259489 & -0.739 & 0.463672 & 0.231836 \tabularnewline
M5 & 0.0395757575757589 & 0.25931 & 0.1526 & 0.879366 & 0.439683 \tabularnewline
M6 & 0.0509090909090923 & 0.25925 & 0.1964 & 0.845185 & 0.422593 \tabularnewline
M7 & -0.0977575757575742 & 0.25931 & -0.377 & 0.707914 & 0.353957 \tabularnewline
M8 & -0.326424242424242 & 0.259489 & -1.258 & 0.214757 & 0.107379 \tabularnewline
M9 & -0.535090909090908 & 0.259786 & -2.0597 & 0.045108 & 0.022554 \tabularnewline
M10 & -0.762666666666665 & 0.258513 & -2.9502 & 0.004981 & 0.00249 \tabularnewline
M11 & -0.131333333333332 & 0.258334 & -0.5084 & 0.613612 & 0.306806 \tabularnewline
t & -0.0513333333333333 & 0.005557 & -9.2373 & 0 & 0 \tabularnewline
\hline
\end{tabular}
%Source: https://freestatistics.org/blog/index.php?pk=25527&T=2

[TABLE]
[ROW][C]Multiple Linear Regression - Ordinary Least Squares[/C][/ROW]
[ROW][C]Variable[/C][C]Parameter[/C][C]S.D.[/C][C]T-STATH0: parameter = 0[/C][C]2-tail p-value[/C][C]1-tail p-value[/C][/ROW]
[ROW][C](Intercept)[/C][C]9.19236363636363[/C][C]0.214208[/C][C]42.9132[/C][C]0[/C][C]0[/C][/ROW]
[ROW][C]stockmarketcrashfollowedbyeconomicdepression[/C][C]0.894545454545455[/C][C]0.201066[/C][C]4.449[/C][C]5.4e-05[/C][C]2.7e-05[/C][/ROW]
[ROW][C]M1[/C][C]-0.125757575757581[/C][C]0.260735[/C][C]-0.4823[/C][C]0.631867[/C][C]0.315933[/C][/ROW]
[ROW][C]M2[/C][C]-0.294424242424242[/C][C]0.260202[/C][C]-1.1315[/C][C]0.263699[/C][C]0.13185[/C][/ROW]
[ROW][C]M3[/C][C]-0.363090909090908[/C][C]0.259786[/C][C]-1.3977[/C][C]0.168921[/C][C]0.084461[/C][/ROW]
[ROW][C]M4[/C][C]-0.191757575757574[/C][C]0.259489[/C][C]-0.739[/C][C]0.463672[/C][C]0.231836[/C][/ROW]
[ROW][C]M5[/C][C]0.0395757575757589[/C][C]0.25931[/C][C]0.1526[/C][C]0.879366[/C][C]0.439683[/C][/ROW]
[ROW][C]M6[/C][C]0.0509090909090923[/C][C]0.25925[/C][C]0.1964[/C][C]0.845185[/C][C]0.422593[/C][/ROW]
[ROW][C]M7[/C][C]-0.0977575757575742[/C][C]0.25931[/C][C]-0.377[/C][C]0.707914[/C][C]0.353957[/C][/ROW]
[ROW][C]M8[/C][C]-0.326424242424242[/C][C]0.259489[/C][C]-1.258[/C][C]0.214757[/C][C]0.107379[/C][/ROW]
[ROW][C]M9[/C][C]-0.535090909090908[/C][C]0.259786[/C][C]-2.0597[/C][C]0.045108[/C][C]0.022554[/C][/ROW]
[ROW][C]M10[/C][C]-0.762666666666665[/C][C]0.258513[/C][C]-2.9502[/C][C]0.004981[/C][C]0.00249[/C][/ROW]
[ROW][C]M11[/C][C]-0.131333333333332[/C][C]0.258334[/C][C]-0.5084[/C][C]0.613612[/C][C]0.306806[/C][/ROW]
[ROW][C]t[/C][C]-0.0513333333333333[/C][C]0.005557[/C][C]-9.2373[/C][C]0[/C][C]0[/C][/ROW]
[/TABLE]
Source: https://freestatistics.org/blog/index.php?pk=25527&T=2

Globally Unique Identifier (entire table): ba.freestatistics.org/blog/index.php?pk=25527&T=2

As an alternative you can also use a QR Code:  

The GUIDs for individual cells are displayed in the table below:

Multiple Linear Regression - Ordinary Least Squares
VariableParameterS.D.T-STATH0: parameter = 02-tail p-value1-tail p-value
(Intercept)9.192363636363630.21420842.913200
stockmarketcrashfollowedbyeconomicdepression0.8945454545454550.2010664.4495.4e-052.7e-05
M1-0.1257575757575810.260735-0.48230.6318670.315933
M2-0.2944242424242420.260202-1.13150.2636990.13185
M3-0.3630909090909080.259786-1.39770.1689210.084461
M4-0.1917575757575740.259489-0.7390.4636720.231836
M50.03957575757575890.259310.15260.8793660.439683
M60.05090909090909230.259250.19640.8451850.422593
M7-0.09775757575757420.25931-0.3770.7079140.353957
M8-0.3264242424242420.259489-1.2580.2147570.107379
M9-0.5350909090909080.259786-2.05970.0451080.022554
M10-0.7626666666666650.258513-2.95020.0049810.00249
M11-0.1313333333333320.258334-0.50840.6136120.306806
t-0.05133333333333330.005557-9.237300


Multiple Linear Regression - Regression Statistics
Multiple R0.872093262063936
R-squared0.760546657737317
Adjusted R-squared0.692875061010907
F-TEST (value)11.2387869435405
F-TEST (DF numerator)13
F-TEST (DF denominator)46
p-value2.76699552159698e-10
Multiple Linear Regression - Residual Statistics
Residual Standard Deviation0.408367036333293
Sum Squared Residuals7.67112727272732

\begin{tabular}{lllllllll}
\hline
Multiple Linear Regression - Regression Statistics \tabularnewline
Multiple R & 0.872093262063936 \tabularnewline
R-squared & 0.760546657737317 \tabularnewline
Adjusted R-squared & 0.692875061010907 \tabularnewline
F-TEST (value) & 11.2387869435405 \tabularnewline
F-TEST (DF numerator) & 13 \tabularnewline
F-TEST (DF denominator) & 46 \tabularnewline
p-value & 2.76699552159698e-10 \tabularnewline
Multiple Linear Regression - Residual Statistics \tabularnewline
Residual Standard Deviation & 0.408367036333293 \tabularnewline
Sum Squared Residuals & 7.67112727272732 \tabularnewline
\hline
\end{tabular}
%Source: https://freestatistics.org/blog/index.php?pk=25527&T=3

[TABLE]
[ROW][C]Multiple Linear Regression - Regression Statistics[/C][/ROW]
[ROW][C]Multiple R[/C][C]0.872093262063936[/C][/ROW]
[ROW][C]R-squared[/C][C]0.760546657737317[/C][/ROW]
[ROW][C]Adjusted R-squared[/C][C]0.692875061010907[/C][/ROW]
[ROW][C]F-TEST (value)[/C][C]11.2387869435405[/C][/ROW]
[ROW][C]F-TEST (DF numerator)[/C][C]13[/C][/ROW]
[ROW][C]F-TEST (DF denominator)[/C][C]46[/C][/ROW]
[ROW][C]p-value[/C][C]2.76699552159698e-10[/C][/ROW]
[ROW][C]Multiple Linear Regression - Residual Statistics[/C][/ROW]
[ROW][C]Residual Standard Deviation[/C][C]0.408367036333293[/C][/ROW]
[ROW][C]Sum Squared Residuals[/C][C]7.67112727272732[/C][/ROW]
[/TABLE]
Source: https://freestatistics.org/blog/index.php?pk=25527&T=3

Globally Unique Identifier (entire table): ba.freestatistics.org/blog/index.php?pk=25527&T=3

As an alternative you can also use a QR Code:  

The GUIDs for individual cells are displayed in the table below:

Multiple Linear Regression - Regression Statistics
Multiple R0.872093262063936
R-squared0.760546657737317
Adjusted R-squared0.692875061010907
F-TEST (value)11.2387869435405
F-TEST (DF numerator)13
F-TEST (DF denominator)46
p-value2.76699552159698e-10
Multiple Linear Regression - Residual Statistics
Residual Standard Deviation0.408367036333293
Sum Squared Residuals7.67112727272732


Multiple Linear Regression - Actuals, Interpolation, and Residuals
Time or IndexActualsInterpolationForecastResidualsPrediction Error
18.49.01527272727275-0.615272727272753
28.48.79527272727273-0.395272727272731
38.48.67527272727273-0.275272727272727
48.68.79527272727273-0.195272727272726
58.98.97527272727273-0.0752727272727255
68.88.93527272727273-0.135272727272725
78.38.73527272727273-0.435272727272726
87.58.45527272727272-0.955272727272725
97.28.19527272727273-0.995272727272727
107.57.91636363636363-0.416363636363634
118.88.496363636363630.303636363636366
129.38.576363636363630.723636363636367
139.38.399272727272720.90072727272728
148.78.179272727272720.520727272727274
158.28.059272727272730.140727272727273
168.38.179272727272730.120727272727274
178.58.359272727272730.140727272727273
188.68.319272727272730.280727272727273
198.68.119272727272730.480727272727273
208.27.839272727272730.360727272727273
218.17.579272727272730.520727272727273
2288.1949090909091-0.194909090909090
238.68.77490909090909-0.17490909090909
248.78.85490909090909-0.15490909090909
258.88.677818181818170.122181818181826
268.58.457818181818180.0421818181818194
278.48.337818181818180.0621818181818188
288.58.457818181818180.0421818181818181
298.78.637818181818180.0621818181818174
308.78.597818181818180.102181818181817
318.68.397818181818180.202181818181818
328.58.117818181818180.382181818181818
338.37.857818181818180.442181818181819
348.17.578909090909090.521090909090909
358.28.158909090909090.041090909090909
368.18.23890909090909-0.13890909090909
378.18.061818181818180.038181818181824
387.97.841818181818180.0581818181818191
397.97.721818181818180.178181818181818
407.97.841818181818180.0581818181818178
4188.02181818181818-0.0218181818181824
4287.981818181818180.0181818181818173
437.97.781818181818180.118181818181818
4487.501818181818180.498181818181818
457.77.241818181818180.458181818181817
467.26.962909090909090.237090909090908
477.57.54290909090909-0.0429090909090911
487.37.62290909090909-0.322909090909091
4977.44581818181818-0.445818181818176
5077.22581818181818-0.225818181818182
5177.10581818181818-0.105818181818183
527.27.22581818181818-0.0258181818181832
537.37.40581818181818-0.105818181818184
547.17.36581818181818-0.265818181818184
556.87.16581818181818-0.365818181818184
566.66.88581818181818-0.285818181818183
576.26.62581818181818-0.425818181818183
586.26.34690909090909-0.146909090909092
596.86.92690909090909-0.126909090909092
606.97.00690909090909-0.106909090909091

\begin{tabular}{lllllllll}
\hline
Multiple Linear Regression - Actuals, Interpolation, and Residuals \tabularnewline
Time or Index & Actuals & InterpolationForecast & ResidualsPrediction Error \tabularnewline
1 & 8.4 & 9.01527272727275 & -0.615272727272753 \tabularnewline
2 & 8.4 & 8.79527272727273 & -0.395272727272731 \tabularnewline
3 & 8.4 & 8.67527272727273 & -0.275272727272727 \tabularnewline
4 & 8.6 & 8.79527272727273 & -0.195272727272726 \tabularnewline
5 & 8.9 & 8.97527272727273 & -0.0752727272727255 \tabularnewline
6 & 8.8 & 8.93527272727273 & -0.135272727272725 \tabularnewline
7 & 8.3 & 8.73527272727273 & -0.435272727272726 \tabularnewline
8 & 7.5 & 8.45527272727272 & -0.955272727272725 \tabularnewline
9 & 7.2 & 8.19527272727273 & -0.995272727272727 \tabularnewline
10 & 7.5 & 7.91636363636363 & -0.416363636363634 \tabularnewline
11 & 8.8 & 8.49636363636363 & 0.303636363636366 \tabularnewline
12 & 9.3 & 8.57636363636363 & 0.723636363636367 \tabularnewline
13 & 9.3 & 8.39927272727272 & 0.90072727272728 \tabularnewline
14 & 8.7 & 8.17927272727272 & 0.520727272727274 \tabularnewline
15 & 8.2 & 8.05927272727273 & 0.140727272727273 \tabularnewline
16 & 8.3 & 8.17927272727273 & 0.120727272727274 \tabularnewline
17 & 8.5 & 8.35927272727273 & 0.140727272727273 \tabularnewline
18 & 8.6 & 8.31927272727273 & 0.280727272727273 \tabularnewline
19 & 8.6 & 8.11927272727273 & 0.480727272727273 \tabularnewline
20 & 8.2 & 7.83927272727273 & 0.360727272727273 \tabularnewline
21 & 8.1 & 7.57927272727273 & 0.520727272727273 \tabularnewline
22 & 8 & 8.1949090909091 & -0.194909090909090 \tabularnewline
23 & 8.6 & 8.77490909090909 & -0.17490909090909 \tabularnewline
24 & 8.7 & 8.85490909090909 & -0.15490909090909 \tabularnewline
25 & 8.8 & 8.67781818181817 & 0.122181818181826 \tabularnewline
26 & 8.5 & 8.45781818181818 & 0.0421818181818194 \tabularnewline
27 & 8.4 & 8.33781818181818 & 0.0621818181818188 \tabularnewline
28 & 8.5 & 8.45781818181818 & 0.0421818181818181 \tabularnewline
29 & 8.7 & 8.63781818181818 & 0.0621818181818174 \tabularnewline
30 & 8.7 & 8.59781818181818 & 0.102181818181817 \tabularnewline
31 & 8.6 & 8.39781818181818 & 0.202181818181818 \tabularnewline
32 & 8.5 & 8.11781818181818 & 0.382181818181818 \tabularnewline
33 & 8.3 & 7.85781818181818 & 0.442181818181819 \tabularnewline
34 & 8.1 & 7.57890909090909 & 0.521090909090909 \tabularnewline
35 & 8.2 & 8.15890909090909 & 0.041090909090909 \tabularnewline
36 & 8.1 & 8.23890909090909 & -0.13890909090909 \tabularnewline
37 & 8.1 & 8.06181818181818 & 0.038181818181824 \tabularnewline
38 & 7.9 & 7.84181818181818 & 0.0581818181818191 \tabularnewline
39 & 7.9 & 7.72181818181818 & 0.178181818181818 \tabularnewline
40 & 7.9 & 7.84181818181818 & 0.0581818181818178 \tabularnewline
41 & 8 & 8.02181818181818 & -0.0218181818181824 \tabularnewline
42 & 8 & 7.98181818181818 & 0.0181818181818173 \tabularnewline
43 & 7.9 & 7.78181818181818 & 0.118181818181818 \tabularnewline
44 & 8 & 7.50181818181818 & 0.498181818181818 \tabularnewline
45 & 7.7 & 7.24181818181818 & 0.458181818181817 \tabularnewline
46 & 7.2 & 6.96290909090909 & 0.237090909090908 \tabularnewline
47 & 7.5 & 7.54290909090909 & -0.0429090909090911 \tabularnewline
48 & 7.3 & 7.62290909090909 & -0.322909090909091 \tabularnewline
49 & 7 & 7.44581818181818 & -0.445818181818176 \tabularnewline
50 & 7 & 7.22581818181818 & -0.225818181818182 \tabularnewline
51 & 7 & 7.10581818181818 & -0.105818181818183 \tabularnewline
52 & 7.2 & 7.22581818181818 & -0.0258181818181832 \tabularnewline
53 & 7.3 & 7.40581818181818 & -0.105818181818184 \tabularnewline
54 & 7.1 & 7.36581818181818 & -0.265818181818184 \tabularnewline
55 & 6.8 & 7.16581818181818 & -0.365818181818184 \tabularnewline
56 & 6.6 & 6.88581818181818 & -0.285818181818183 \tabularnewline
57 & 6.2 & 6.62581818181818 & -0.425818181818183 \tabularnewline
58 & 6.2 & 6.34690909090909 & -0.146909090909092 \tabularnewline
59 & 6.8 & 6.92690909090909 & -0.126909090909092 \tabularnewline
60 & 6.9 & 7.00690909090909 & -0.106909090909091 \tabularnewline
\hline
\end{tabular}
%Source: https://freestatistics.org/blog/index.php?pk=25527&T=4

[TABLE]
[ROW][C]Multiple Linear Regression - Actuals, Interpolation, and Residuals[/C][/ROW]
[ROW][C]Time or Index[/C][C]Actuals[/C][C]InterpolationForecast[/C][C]ResidualsPrediction Error[/C][/ROW]
[ROW][C]1[/C][C]8.4[/C][C]9.01527272727275[/C][C]-0.615272727272753[/C][/ROW]
[ROW][C]2[/C][C]8.4[/C][C]8.79527272727273[/C][C]-0.395272727272731[/C][/ROW]
[ROW][C]3[/C][C]8.4[/C][C]8.67527272727273[/C][C]-0.275272727272727[/C][/ROW]
[ROW][C]4[/C][C]8.6[/C][C]8.79527272727273[/C][C]-0.195272727272726[/C][/ROW]
[ROW][C]5[/C][C]8.9[/C][C]8.97527272727273[/C][C]-0.0752727272727255[/C][/ROW]
[ROW][C]6[/C][C]8.8[/C][C]8.93527272727273[/C][C]-0.135272727272725[/C][/ROW]
[ROW][C]7[/C][C]8.3[/C][C]8.73527272727273[/C][C]-0.435272727272726[/C][/ROW]
[ROW][C]8[/C][C]7.5[/C][C]8.45527272727272[/C][C]-0.955272727272725[/C][/ROW]
[ROW][C]9[/C][C]7.2[/C][C]8.19527272727273[/C][C]-0.995272727272727[/C][/ROW]
[ROW][C]10[/C][C]7.5[/C][C]7.91636363636363[/C][C]-0.416363636363634[/C][/ROW]
[ROW][C]11[/C][C]8.8[/C][C]8.49636363636363[/C][C]0.303636363636366[/C][/ROW]
[ROW][C]12[/C][C]9.3[/C][C]8.57636363636363[/C][C]0.723636363636367[/C][/ROW]
[ROW][C]13[/C][C]9.3[/C][C]8.39927272727272[/C][C]0.90072727272728[/C][/ROW]
[ROW][C]14[/C][C]8.7[/C][C]8.17927272727272[/C][C]0.520727272727274[/C][/ROW]
[ROW][C]15[/C][C]8.2[/C][C]8.05927272727273[/C][C]0.140727272727273[/C][/ROW]
[ROW][C]16[/C][C]8.3[/C][C]8.17927272727273[/C][C]0.120727272727274[/C][/ROW]
[ROW][C]17[/C][C]8.5[/C][C]8.35927272727273[/C][C]0.140727272727273[/C][/ROW]
[ROW][C]18[/C][C]8.6[/C][C]8.31927272727273[/C][C]0.280727272727273[/C][/ROW]
[ROW][C]19[/C][C]8.6[/C][C]8.11927272727273[/C][C]0.480727272727273[/C][/ROW]
[ROW][C]20[/C][C]8.2[/C][C]7.83927272727273[/C][C]0.360727272727273[/C][/ROW]
[ROW][C]21[/C][C]8.1[/C][C]7.57927272727273[/C][C]0.520727272727273[/C][/ROW]
[ROW][C]22[/C][C]8[/C][C]8.1949090909091[/C][C]-0.194909090909090[/C][/ROW]
[ROW][C]23[/C][C]8.6[/C][C]8.77490909090909[/C][C]-0.17490909090909[/C][/ROW]
[ROW][C]24[/C][C]8.7[/C][C]8.85490909090909[/C][C]-0.15490909090909[/C][/ROW]
[ROW][C]25[/C][C]8.8[/C][C]8.67781818181817[/C][C]0.122181818181826[/C][/ROW]
[ROW][C]26[/C][C]8.5[/C][C]8.45781818181818[/C][C]0.0421818181818194[/C][/ROW]
[ROW][C]27[/C][C]8.4[/C][C]8.33781818181818[/C][C]0.0621818181818188[/C][/ROW]
[ROW][C]28[/C][C]8.5[/C][C]8.45781818181818[/C][C]0.0421818181818181[/C][/ROW]
[ROW][C]29[/C][C]8.7[/C][C]8.63781818181818[/C][C]0.0621818181818174[/C][/ROW]
[ROW][C]30[/C][C]8.7[/C][C]8.59781818181818[/C][C]0.102181818181817[/C][/ROW]
[ROW][C]31[/C][C]8.6[/C][C]8.39781818181818[/C][C]0.202181818181818[/C][/ROW]
[ROW][C]32[/C][C]8.5[/C][C]8.11781818181818[/C][C]0.382181818181818[/C][/ROW]
[ROW][C]33[/C][C]8.3[/C][C]7.85781818181818[/C][C]0.442181818181819[/C][/ROW]
[ROW][C]34[/C][C]8.1[/C][C]7.57890909090909[/C][C]0.521090909090909[/C][/ROW]
[ROW][C]35[/C][C]8.2[/C][C]8.15890909090909[/C][C]0.041090909090909[/C][/ROW]
[ROW][C]36[/C][C]8.1[/C][C]8.23890909090909[/C][C]-0.13890909090909[/C][/ROW]
[ROW][C]37[/C][C]8.1[/C][C]8.06181818181818[/C][C]0.038181818181824[/C][/ROW]
[ROW][C]38[/C][C]7.9[/C][C]7.84181818181818[/C][C]0.0581818181818191[/C][/ROW]
[ROW][C]39[/C][C]7.9[/C][C]7.72181818181818[/C][C]0.178181818181818[/C][/ROW]
[ROW][C]40[/C][C]7.9[/C][C]7.84181818181818[/C][C]0.0581818181818178[/C][/ROW]
[ROW][C]41[/C][C]8[/C][C]8.02181818181818[/C][C]-0.0218181818181824[/C][/ROW]
[ROW][C]42[/C][C]8[/C][C]7.98181818181818[/C][C]0.0181818181818173[/C][/ROW]
[ROW][C]43[/C][C]7.9[/C][C]7.78181818181818[/C][C]0.118181818181818[/C][/ROW]
[ROW][C]44[/C][C]8[/C][C]7.50181818181818[/C][C]0.498181818181818[/C][/ROW]
[ROW][C]45[/C][C]7.7[/C][C]7.24181818181818[/C][C]0.458181818181817[/C][/ROW]
[ROW][C]46[/C][C]7.2[/C][C]6.96290909090909[/C][C]0.237090909090908[/C][/ROW]
[ROW][C]47[/C][C]7.5[/C][C]7.54290909090909[/C][C]-0.0429090909090911[/C][/ROW]
[ROW][C]48[/C][C]7.3[/C][C]7.62290909090909[/C][C]-0.322909090909091[/C][/ROW]
[ROW][C]49[/C][C]7[/C][C]7.44581818181818[/C][C]-0.445818181818176[/C][/ROW]
[ROW][C]50[/C][C]7[/C][C]7.22581818181818[/C][C]-0.225818181818182[/C][/ROW]
[ROW][C]51[/C][C]7[/C][C]7.10581818181818[/C][C]-0.105818181818183[/C][/ROW]
[ROW][C]52[/C][C]7.2[/C][C]7.22581818181818[/C][C]-0.0258181818181832[/C][/ROW]
[ROW][C]53[/C][C]7.3[/C][C]7.40581818181818[/C][C]-0.105818181818184[/C][/ROW]
[ROW][C]54[/C][C]7.1[/C][C]7.36581818181818[/C][C]-0.265818181818184[/C][/ROW]
[ROW][C]55[/C][C]6.8[/C][C]7.16581818181818[/C][C]-0.365818181818184[/C][/ROW]
[ROW][C]56[/C][C]6.6[/C][C]6.88581818181818[/C][C]-0.285818181818183[/C][/ROW]
[ROW][C]57[/C][C]6.2[/C][C]6.62581818181818[/C][C]-0.425818181818183[/C][/ROW]
[ROW][C]58[/C][C]6.2[/C][C]6.34690909090909[/C][C]-0.146909090909092[/C][/ROW]
[ROW][C]59[/C][C]6.8[/C][C]6.92690909090909[/C][C]-0.126909090909092[/C][/ROW]
[ROW][C]60[/C][C]6.9[/C][C]7.00690909090909[/C][C]-0.106909090909091[/C][/ROW]
[/TABLE]
Source: https://freestatistics.org/blog/index.php?pk=25527&T=4

Globally Unique Identifier (entire table): ba.freestatistics.org/blog/index.php?pk=25527&T=4

As an alternative you can also use a QR Code:  

The GUIDs for individual cells are displayed in the table below:

Multiple Linear Regression - Actuals, Interpolation, and Residuals
Time or IndexActualsInterpolationForecastResidualsPrediction Error
18.49.01527272727275-0.615272727272753
28.48.79527272727273-0.395272727272731
38.48.67527272727273-0.275272727272727
48.68.79527272727273-0.195272727272726
58.98.97527272727273-0.0752727272727255
68.88.93527272727273-0.135272727272725
78.38.73527272727273-0.435272727272726
87.58.45527272727272-0.955272727272725
97.28.19527272727273-0.995272727272727
107.57.91636363636363-0.416363636363634
118.88.496363636363630.303636363636366
129.38.576363636363630.723636363636367
139.38.399272727272720.90072727272728
148.78.179272727272720.520727272727274
158.28.059272727272730.140727272727273
168.38.179272727272730.120727272727274
178.58.359272727272730.140727272727273
188.68.319272727272730.280727272727273
198.68.119272727272730.480727272727273
208.27.839272727272730.360727272727273
218.17.579272727272730.520727272727273
2288.1949090909091-0.194909090909090
238.68.77490909090909-0.17490909090909
248.78.85490909090909-0.15490909090909
258.88.677818181818170.122181818181826
268.58.457818181818180.0421818181818194
278.48.337818181818180.0621818181818188
288.58.457818181818180.0421818181818181
298.78.637818181818180.0621818181818174
308.78.597818181818180.102181818181817
318.68.397818181818180.202181818181818
328.58.117818181818180.382181818181818
338.37.857818181818180.442181818181819
348.17.578909090909090.521090909090909
358.28.158909090909090.041090909090909
368.18.23890909090909-0.13890909090909
378.18.061818181818180.038181818181824
387.97.841818181818180.0581818181818191
397.97.721818181818180.178181818181818
407.97.841818181818180.0581818181818178
4188.02181818181818-0.0218181818181824
4287.981818181818180.0181818181818173
437.97.781818181818180.118181818181818
4487.501818181818180.498181818181818
457.77.241818181818180.458181818181817
467.26.962909090909090.237090909090908
477.57.54290909090909-0.0429090909090911
487.37.62290909090909-0.322909090909091
4977.44581818181818-0.445818181818176
5077.22581818181818-0.225818181818182
5177.10581818181818-0.105818181818183
527.27.22581818181818-0.0258181818181832
537.37.40581818181818-0.105818181818184
547.17.36581818181818-0.265818181818184
556.87.16581818181818-0.365818181818184
566.66.88581818181818-0.285818181818183
576.26.62581818181818-0.425818181818183
586.26.34690909090909-0.146909090909092
596.86.92690909090909-0.126909090909092
606.97.00690909090909-0.106909090909091


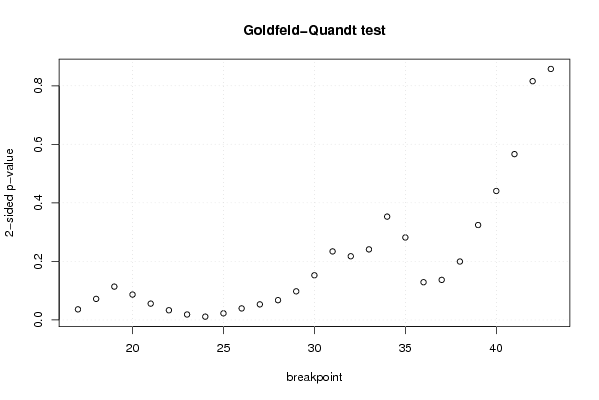
Goldfeld-Quandt test for Heteroskedasticity
p-valuesAlternative Hypothesis
breakpoint indexgreater2-sidedless
170.9819596884413970.03608062311720680.0180403115586034
180.964085740130910.07182851973818040.0359142598690902
190.943135327327630.1137293453447400.0568646726723701
200.9566996146078230.08660077078435460.0433003853921773
210.9721901281479010.05561974370419770.0278098718520988
220.983500077373180.03299984525364080.0164999226268204
230.9907307371937080.01853852561258430.00926926280629217
240.9944441749852990.01111165002940250.00555582501470126
250.9887408569024540.02251828619509140.0112591430975457
260.980352867358970.03929426528206080.0196471326410304
270.9734376657588020.05312466848239530.0265623342411976
280.966253285038730.06749342992254070.0337467149612703
290.9511782466790550.09764350664189050.0488217533209452
300.9237619768874010.1524760462251980.0762380231125988
310.8829705811888930.2340588376222130.117029418811107
320.8912624027052440.2174751945895120.108737597294756
330.8795442564804260.2409114870391490.120455743519574
340.8235557383594070.3528885232811870.176444261640593
350.8591625422217010.2816749155565980.140837457778299
360.9355982518340330.1288034963319330.0644017481659666
370.9316180478107870.1367639043784250.0683819521892127
380.9002642038628070.1994715922743860.0997357961371932
390.8379467414218960.3241065171562070.162053258578104
400.7797628982182680.4404742035634650.220237101781732
410.7167839580856260.5664320838287480.283216041914374
420.5921784476719830.8156431046560340.407821552328017
430.4287143207449570.8574286414899140.571285679255043

\begin{tabular}{lllllllll}
\hline
Goldfeld-Quandt test for Heteroskedasticity \tabularnewline
p-values & Alternative Hypothesis \tabularnewline
breakpoint index & greater & 2-sided & less \tabularnewline
17 & 0.981959688441397 & 0.0360806231172068 & 0.0180403115586034 \tabularnewline
18 & 0.96408574013091 & 0.0718285197381804 & 0.0359142598690902 \tabularnewline
19 & 0.94313532732763 & 0.113729345344740 & 0.0568646726723701 \tabularnewline
20 & 0.956699614607823 & 0.0866007707843546 & 0.0433003853921773 \tabularnewline
21 & 0.972190128147901 & 0.0556197437041977 & 0.0278098718520988 \tabularnewline
22 & 0.98350007737318 & 0.0329998452536408 & 0.0164999226268204 \tabularnewline
23 & 0.990730737193708 & 0.0185385256125843 & 0.00926926280629217 \tabularnewline
24 & 0.994444174985299 & 0.0111116500294025 & 0.00555582501470126 \tabularnewline
25 & 0.988740856902454 & 0.0225182861950914 & 0.0112591430975457 \tabularnewline
26 & 0.98035286735897 & 0.0392942652820608 & 0.0196471326410304 \tabularnewline
27 & 0.973437665758802 & 0.0531246684823953 & 0.0265623342411976 \tabularnewline
28 & 0.96625328503873 & 0.0674934299225407 & 0.0337467149612703 \tabularnewline
29 & 0.951178246679055 & 0.0976435066418905 & 0.0488217533209452 \tabularnewline
30 & 0.923761976887401 & 0.152476046225198 & 0.0762380231125988 \tabularnewline
31 & 0.882970581188893 & 0.234058837622213 & 0.117029418811107 \tabularnewline
32 & 0.891262402705244 & 0.217475194589512 & 0.108737597294756 \tabularnewline
33 & 0.879544256480426 & 0.240911487039149 & 0.120455743519574 \tabularnewline
34 & 0.823555738359407 & 0.352888523281187 & 0.176444261640593 \tabularnewline
35 & 0.859162542221701 & 0.281674915556598 & 0.140837457778299 \tabularnewline
36 & 0.935598251834033 & 0.128803496331933 & 0.0644017481659666 \tabularnewline
37 & 0.931618047810787 & 0.136763904378425 & 0.0683819521892127 \tabularnewline
38 & 0.900264203862807 & 0.199471592274386 & 0.0997357961371932 \tabularnewline
39 & 0.837946741421896 & 0.324106517156207 & 0.162053258578104 \tabularnewline
40 & 0.779762898218268 & 0.440474203563465 & 0.220237101781732 \tabularnewline
41 & 0.716783958085626 & 0.566432083828748 & 0.283216041914374 \tabularnewline
42 & 0.592178447671983 & 0.815643104656034 & 0.407821552328017 \tabularnewline
43 & 0.428714320744957 & 0.857428641489914 & 0.571285679255043 \tabularnewline
\hline
\end{tabular}
%Source: https://freestatistics.org/blog/index.php?pk=25527&T=5

[TABLE]
[ROW][C]Goldfeld-Quandt test for Heteroskedasticity[/C][/ROW]
[ROW][C]p-values[/C][C]Alternative Hypothesis[/C][/ROW]
[ROW][C]breakpoint index[/C][C]greater[/C][C]2-sided[/C][C]less[/C][/ROW]
[ROW][C]17[/C][C]0.981959688441397[/C][C]0.0360806231172068[/C][C]0.0180403115586034[/C][/ROW]
[ROW][C]18[/C][C]0.96408574013091[/C][C]0.0718285197381804[/C][C]0.0359142598690902[/C][/ROW]
[ROW][C]19[/C][C]0.94313532732763[/C][C]0.113729345344740[/C][C]0.0568646726723701[/C][/ROW]
[ROW][C]20[/C][C]0.956699614607823[/C][C]0.0866007707843546[/C][C]0.0433003853921773[/C][/ROW]
[ROW][C]21[/C][C]0.972190128147901[/C][C]0.0556197437041977[/C][C]0.0278098718520988[/C][/ROW]
[ROW][C]22[/C][C]0.98350007737318[/C][C]0.0329998452536408[/C][C]0.0164999226268204[/C][/ROW]
[ROW][C]23[/C][C]0.990730737193708[/C][C]0.0185385256125843[/C][C]0.00926926280629217[/C][/ROW]
[ROW][C]24[/C][C]0.994444174985299[/C][C]0.0111116500294025[/C][C]0.00555582501470126[/C][/ROW]
[ROW][C]25[/C][C]0.988740856902454[/C][C]0.0225182861950914[/C][C]0.0112591430975457[/C][/ROW]
[ROW][C]26[/C][C]0.98035286735897[/C][C]0.0392942652820608[/C][C]0.0196471326410304[/C][/ROW]
[ROW][C]27[/C][C]0.973437665758802[/C][C]0.0531246684823953[/C][C]0.0265623342411976[/C][/ROW]
[ROW][C]28[/C][C]0.96625328503873[/C][C]0.0674934299225407[/C][C]0.0337467149612703[/C][/ROW]
[ROW][C]29[/C][C]0.951178246679055[/C][C]0.0976435066418905[/C][C]0.0488217533209452[/C][/ROW]
[ROW][C]30[/C][C]0.923761976887401[/C][C]0.152476046225198[/C][C]0.0762380231125988[/C][/ROW]
[ROW][C]31[/C][C]0.882970581188893[/C][C]0.234058837622213[/C][C]0.117029418811107[/C][/ROW]
[ROW][C]32[/C][C]0.891262402705244[/C][C]0.217475194589512[/C][C]0.108737597294756[/C][/ROW]
[ROW][C]33[/C][C]0.879544256480426[/C][C]0.240911487039149[/C][C]0.120455743519574[/C][/ROW]
[ROW][C]34[/C][C]0.823555738359407[/C][C]0.352888523281187[/C][C]0.176444261640593[/C][/ROW]
[ROW][C]35[/C][C]0.859162542221701[/C][C]0.281674915556598[/C][C]0.140837457778299[/C][/ROW]
[ROW][C]36[/C][C]0.935598251834033[/C][C]0.128803496331933[/C][C]0.0644017481659666[/C][/ROW]
[ROW][C]37[/C][C]0.931618047810787[/C][C]0.136763904378425[/C][C]0.0683819521892127[/C][/ROW]
[ROW][C]38[/C][C]0.900264203862807[/C][C]0.199471592274386[/C][C]0.0997357961371932[/C][/ROW]
[ROW][C]39[/C][C]0.837946741421896[/C][C]0.324106517156207[/C][C]0.162053258578104[/C][/ROW]
[ROW][C]40[/C][C]0.779762898218268[/C][C]0.440474203563465[/C][C]0.220237101781732[/C][/ROW]
[ROW][C]41[/C][C]0.716783958085626[/C][C]0.566432083828748[/C][C]0.283216041914374[/C][/ROW]
[ROW][C]42[/C][C]0.592178447671983[/C][C]0.815643104656034[/C][C]0.407821552328017[/C][/ROW]
[ROW][C]43[/C][C]0.428714320744957[/C][C]0.857428641489914[/C][C]0.571285679255043[/C][/ROW]
[/TABLE]
Source: https://freestatistics.org/blog/index.php?pk=25527&T=5

Globally Unique Identifier (entire table): ba.freestatistics.org/blog/index.php?pk=25527&T=5

As an alternative you can also use a QR Code:  

The GUIDs for individual cells are displayed in the table below:

Goldfeld-Quandt test for Heteroskedasticity
p-valuesAlternative Hypothesis
breakpoint indexgreater2-sidedless
170.9819596884413970.03608062311720680.0180403115586034
180.964085740130910.07182851973818040.0359142598690902
190.943135327327630.1137293453447400.0568646726723701
200.9566996146078230.08660077078435460.0433003853921773
210.9721901281479010.05561974370419770.0278098718520988
220.983500077373180.03299984525364080.0164999226268204
230.9907307371937080.01853852561258430.00926926280629217
240.9944441749852990.01111165002940250.00555582501470126
250.9887408569024540.02251828619509140.0112591430975457
260.980352867358970.03929426528206080.0196471326410304
270.9734376657588020.05312466848239530.0265623342411976
280.966253285038730.06749342992254070.0337467149612703
290.9511782466790550.09764350664189050.0488217533209452
300.9237619768874010.1524760462251980.0762380231125988
310.8829705811888930.2340588376222130.117029418811107
320.8912624027052440.2174751945895120.108737597294756
330.8795442564804260.2409114870391490.120455743519574
340.8235557383594070.3528885232811870.176444261640593
350.8591625422217010.2816749155565980.140837457778299
360.9355982518340330.1288034963319330.0644017481659666
370.9316180478107870.1367639043784250.0683819521892127
380.9002642038628070.1994715922743860.0997357961371932
390.8379467414218960.3241065171562070.162053258578104
400.7797628982182680.4404742035634650.220237101781732
410.7167839580856260.5664320838287480.283216041914374
420.5921784476719830.8156431046560340.407821552328017
430.4287143207449570.8574286414899140.571285679255043


Meta Analysis of Goldfeld-Quandt test for Heteroskedasticity
Description# significant tests% significant testsOK/NOK
1% type I error level00OK
5% type I error level60.222222222222222NOK
10% type I error level120.444444444444444NOK

\begin{tabular}{lllllllll}
\hline
Meta Analysis of Goldfeld-Quandt test for Heteroskedasticity \tabularnewline
Description & # significant tests & % significant tests & OK/NOK \tabularnewline
1% type I error level & 0 & 0 & OK \tabularnewline
5% type I error level & 6 & 0.222222222222222 & NOK \tabularnewline
10% type I error level & 12 & 0.444444444444444 & NOK \tabularnewline
\hline
\end{tabular}
%Source: https://freestatistics.org/blog/index.php?pk=25527&T=6

[TABLE]
[ROW][C]Meta Analysis of Goldfeld-Quandt test for Heteroskedasticity[/C][/ROW]
[ROW][C]Description[/C][C]# significant tests[/C][C]% significant tests[/C][C]OK/NOK[/C][/ROW]
[ROW][C]1% type I error level[/C][C]0[/C][C]0[/C][C]OK[/C][/ROW]
[ROW][C]5% type I error level[/C][C]6[/C][C]0.222222222222222[/C][C]NOK[/C][/ROW]
[ROW][C]10% type I error level[/C][C]12[/C][C]0.444444444444444[/C][C]NOK[/C][/ROW]
[/TABLE]
Source: https://freestatistics.org/blog/index.php?pk=25527&T=6

Globally Unique Identifier (entire table): ba.freestatistics.org/blog/index.php?pk=25527&T=6

As an alternative you can also use a QR Code:  

The GUIDs for individual cells are displayed in the table below:

Meta Analysis of Goldfeld-Quandt test for Heteroskedasticity
Description# significant tests% significant testsOK/NOK
1% type I error level00OK
5% type I error level60.222222222222222NOK
10% type I error level120.444444444444444NOK


Parameters (Session):
par1 = 1 ; par2 = Include Monthly Dummies ; par3 = Linear Trend ;
Parameters (R input):
par1 = 1 ; par2 = Include Monthly Dummies ; par3 = Linear Trend ;
R code (references can be found in the software module):
library(lattice)
library(lmtest)
n25 <- 25 #minimum number of obs. for Goldfeld-Quandt test
par1 <- as.numeric(par1)
x <- t(y)
k <- length(x[1,])
n <- length(x[,1])
x1 <- cbind(x[,par1], x[,1:k!=par1])
mycolnames <- c(colnames(x)[par1], colnames(x)[1:k!=par1])
colnames(x1) <- mycolnames #colnames(x)[par1]
x <- x1
if (par3 == 'First Differences'){
x2 <- array(0, dim=c(n-1,k), dimnames=list(1:(n-1), paste('(1-B)',colnames(x),sep='')))
for (i in 1:n-1) {
for (j in 1:k) {
x2[i,j] <- x[i+1,j] - x[i,j]
}
}
x <- x2
}
if (par2 == 'Include Monthly Dummies'){
x2 <- array(0, dim=c(n,11), dimnames=list(1:n, paste('M', seq(1:11), sep ='')))
for (i in 1:11){
x2[seq(i,n,12),i] <- 1
}
x <- cbind(x, x2)
}
if (par2 == 'Include Quarterly Dummies'){
x2 <- array(0, dim=c(n,3), dimnames=list(1:n, paste('Q', seq(1:3), sep ='')))
for (i in 1:3){
x2[seq(i,n,4),i] <- 1
}
x <- cbind(x, x2)
}
k <- length(x[1,])
if (par3 == 'Linear Trend'){
x <- cbind(x, c(1:n))
colnames(x)[k+1] <- 't'
}
x
k <- length(x[1,])
df <- as.data.frame(x)
(mylm <- lm(df))
(mysum <- summary(mylm))
if (n > n25) {
kp3 <- k + 3
nmkm3 <- n - k - 3
gqarr <- array(NA, dim=c(nmkm3-kp3+1,3))
numgqtests <- 0
numsignificant1 <- 0
numsignificant5 <- 0
numsignificant10 <- 0
for (mypoint in kp3:nmkm3) {
j <- 0
numgqtests <- numgqtests + 1
for (myalt in c('greater', 'two.sided', 'less')) {
j <- j + 1
gqarr[mypoint-kp3+1,j] <- gqtest(mylm, point=mypoint, alternative=myalt)$p.value
}
if (gqarr[mypoint-kp3+1,2] < 0.01) numsignificant1 <- numsignificant1 + 1
if (gqarr[mypoint-kp3+1,2] < 0.05) numsignificant5 <- numsignificant5 + 1
if (gqarr[mypoint-kp3+1,2] < 0.10) numsignificant10 <- numsignificant10 + 1
}
gqarr
}
bitmap(file='test0.png')
plot(x[,1], type='l', main='Actuals and Interpolation', ylab='value of Actuals and Interpolation (dots)', xlab='time or index')
points(x[,1]-mysum$resid)
grid()
dev.off()
bitmap(file='test1.png')
plot(mysum$resid, type='b', pch=19, main='Residuals', ylab='value of Residuals', xlab='time or index')
grid()
dev.off()
bitmap(file='test2.png')
hist(mysum$resid, main='Residual Histogram', xlab='values of Residuals')
grid()
dev.off()
bitmap(file='test3.png')
densityplot(~mysum$resid,col='black',main='Residual Density Plot', xlab='values of Residuals')
dev.off()
bitmap(file='test4.png')
qqnorm(mysum$resid, main='Residual Normal Q-Q Plot')
qqline(mysum$resid)
grid()
dev.off()
(myerror <- as.ts(mysum$resid))
bitmap(file='test5.png')
dum <- cbind(lag(myerror,k=1),myerror)
dum
dum1 <- dum[2:length(myerror),]
dum1
z <- as.data.frame(dum1)
z
plot(z,main=paste('Residual Lag plot, lowess, and regression line'), ylab='values of Residuals', xlab='lagged values of Residuals')
lines(lowess(z))
abline(lm(z))
grid()
dev.off()
bitmap(file='test6.png')
acf(mysum$resid, lag.max=length(mysum$resid)/2, main='Residual Autocorrelation Function')
grid()
dev.off()
bitmap(file='test7.png')
pacf(mysum$resid, lag.max=length(mysum$resid)/2, main='Residual Partial Autocorrelation Function')
grid()
dev.off()
bitmap(file='test8.png')
opar <- par(mfrow = c(2,2), oma = c(0, 0, 1.1, 0))
plot(mylm, las = 1, sub='Residual Diagnostics')
par(opar)
dev.off()
if (n > n25) {
bitmap(file='test9.png')
plot(kp3:nmkm3,gqarr[,2], main='Goldfeld-Quandt test',ylab='2-sided p-value',xlab='breakpoint')
grid()
dev.off()
}
load(file='createtable')
a<-table.start()
a<-table.row.start(a)
a<-table.element(a, 'Multiple Linear Regression - Estimated Regression Equation', 1, TRUE)
a<-table.row.end(a)
myeq <- colnames(x)[1]
myeq <- paste(myeq, '[t] = ', sep='')
for (i in 1:k){
if (mysum$coefficients[i,1] > 0) myeq <- paste(myeq, '+', '')
myeq <- paste(myeq, mysum$coefficients[i,1], sep=' ')
if (rownames(mysum$coefficients)[i] != '(Intercept)') {
myeq <- paste(myeq, rownames(mysum$coefficients)[i], sep='')
if (rownames(mysum$coefficients)[i] != 't') myeq <- paste(myeq, '[t]', sep='')
}
}
myeq <- paste(myeq, ' + e[t]')
a<-table.row.start(a)
a<-table.element(a, myeq)
a<-table.row.end(a)
a<-table.end(a)
table.save(a,file='mytable1.tab')
a<-table.start()
a<-table.row.start(a)
a<-table.element(a,hyperlink('ols1.htm','Multiple Linear Regression - Ordinary Least Squares',''), 6, TRUE)
a<-table.row.end(a)
a<-table.row.start(a)
a<-table.element(a,'Variable',header=TRUE)
a<-table.element(a,'Parameter',header=TRUE)
a<-table.element(a,'S.D.',header=TRUE)
a<-table.element(a,'T-STAT
H0: parameter = 0',header=TRUE)
a<-table.element(a,'2-tail p-value',header=TRUE)
a<-table.element(a,'1-tail p-value',header=TRUE)
a<-table.row.end(a)
for (i in 1:k){
a<-table.row.start(a)
a<-table.element(a,rownames(mysum$coefficients)[i],header=TRUE)
a<-table.element(a,mysum$coefficients[i,1])
a<-table.element(a, round(mysum$coefficients[i,2],6))
a<-table.element(a, round(mysum$coefficients[i,3],4))
a<-table.element(a, round(mysum$coefficients[i,4],6))
a<-table.element(a, round(mysum$coefficients[i,4]/2,6))
a<-table.row.end(a)
}
a<-table.end(a)
table.save(a,file='mytable2.tab')
a<-table.start()
a<-table.row.start(a)
a<-table.element(a, 'Multiple Linear Regression - Regression Statistics', 2, TRUE)
a<-table.row.end(a)
a<-table.row.start(a)
a<-table.element(a, 'Multiple R',1,TRUE)
a<-table.element(a, sqrt(mysum$r.squared))
a<-table.row.end(a)
a<-table.row.start(a)
a<-table.element(a, 'R-squared',1,TRUE)
a<-table.element(a, mysum$r.squared)
a<-table.row.end(a)
a<-table.row.start(a)
a<-table.element(a, 'Adjusted R-squared',1,TRUE)
a<-table.element(a, mysum$adj.r.squared)
a<-table.row.end(a)
a<-table.row.start(a)
a<-table.element(a, 'F-TEST (value)',1,TRUE)
a<-table.element(a, mysum$fstatistic[1])
a<-table.row.end(a)
a<-table.row.start(a)
a<-table.element(a, 'F-TEST (DF numerator)',1,TRUE)
a<-table.element(a, mysum$fstatistic[2])
a<-table.row.end(a)
a<-table.row.start(a)
a<-table.element(a, 'F-TEST (DF denominator)',1,TRUE)
a<-table.element(a, mysum$fstatistic[3])
a<-table.row.end(a)
a<-table.row.start(a)
a<-table.element(a, 'p-value',1,TRUE)
a<-table.element(a, 1-pf(mysum$fstatistic[1],mysum$fstatistic[2],mysum$fstatistic[3]))
a<-table.row.end(a)
a<-table.row.start(a)
a<-table.element(a, 'Multiple Linear Regression - Residual Statistics', 2, TRUE)
a<-table.row.end(a)
a<-table.row.start(a)
a<-table.element(a, 'Residual Standard Deviation',1,TRUE)
a<-table.element(a, mysum$sigma)
a<-table.row.end(a)
a<-table.row.start(a)
a<-table.element(a, 'Sum Squared Residuals',1,TRUE)
a<-table.element(a, sum(myerror*myerror))
a<-table.row.end(a)
a<-table.end(a)
table.save(a,file='mytable3.tab')
a<-table.start()
a<-table.row.start(a)
a<-table.element(a, 'Multiple Linear Regression - Actuals, Interpolation, and Residuals', 4, TRUE)
a<-table.row.end(a)
a<-table.row.start(a)
a<-table.element(a, 'Time or Index', 1, TRUE)
a<-table.element(a, 'Actuals', 1, TRUE)
a<-table.element(a, 'Interpolation
Forecast', 1, TRUE)
a<-table.element(a, 'Residuals
Prediction Error', 1, TRUE)
a<-table.row.end(a)
for (i in 1:n) {
a<-table.row.start(a)
a<-table.element(a,i, 1, TRUE)
a<-table.element(a,x[i])
a<-table.element(a,x[i]-mysum$resid[i])
a<-table.element(a,mysum$resid[i])
a<-table.row.end(a)
}
a<-table.end(a)
table.save(a,file='mytable4.tab')
if (n > n25) {
a<-table.start()
a<-table.row.start(a)
a<-table.element(a,'Goldfeld-Quandt test for Heteroskedasticity',4,TRUE)
a<-table.row.end(a)
a<-table.row.start(a)
a<-table.element(a,'p-values',header=TRUE)
a<-table.element(a,'Alternative Hypothesis',3,header=TRUE)
a<-table.row.end(a)
a<-table.row.start(a)
a<-table.element(a,'breakpoint index',header=TRUE)
a<-table.element(a,'greater',header=TRUE)
a<-table.element(a,'2-sided',header=TRUE)
a<-table.element(a,'less',header=TRUE)
a<-table.row.end(a)
for (mypoint in kp3:nmkm3) {
a<-table.row.start(a)
a<-table.element(a,mypoint,header=TRUE)
a<-table.element(a,gqarr[mypoint-kp3+1,1])
a<-table.element(a,gqarr[mypoint-kp3+1,2])
a<-table.element(a,gqarr[mypoint-kp3+1,3])
a<-table.row.end(a)
}
a<-table.end(a)
table.save(a,file='mytable5.tab')
a<-table.start()
a<-table.row.start(a)
a<-table.element(a,'Meta Analysis of Goldfeld-Quandt test for Heteroskedasticity',4,TRUE)
a<-table.row.end(a)
a<-table.row.start(a)
a<-table.element(a,'Description',header=TRUE)
a<-table.element(a,'# significant tests',header=TRUE)
a<-table.element(a,'% significant tests',header=TRUE)
a<-table.element(a,'OK/NOK',header=TRUE)
a<-table.row.end(a)
a<-table.row.start(a)
a<-table.element(a,'1% type I error level',header=TRUE)
a<-table.element(a,numsignificant1)
a<-table.element(a,numsignificant1/numgqtests)
if (numsignificant1/numgqtests < 0.01) dum <- 'OK' else dum <- 'NOK'
a<-table.element(a,dum)
a<-table.row.end(a)
a<-table.row.start(a)
a<-table.element(a,'5% type I error level',header=TRUE)
a<-table.element(a,numsignificant5)
a<-table.element(a,numsignificant5/numgqtests)
if (numsignificant5/numgqtests < 0.05) dum <- 'OK' else dum <- 'NOK'
a<-table.element(a,dum)
a<-table.row.end(a)
a<-table.row.start(a)
a<-table.element(a,'10% type I error level',header=TRUE)
a<-table.element(a,numsignificant10)
a<-table.element(a,numsignificant10/numgqtests)
if (numsignificant10/numgqtests < 0.1) dum <- 'OK' else dum <- 'NOK'
a<-table.element(a,dum)
a<-table.row.end(a)
a<-table.end(a)
table.save(a,file='mytable6.tab')
}