Free Statistics

of Irreproducible Research!

Author's title

Author*The author of this computation has been verified*
R Software Modulerwasp_multipleregression.wasp
Title produced by softwareMultiple Regression
Date of computationMon, 24 Nov 2008 12:53:03 -0700
Cite this page as followsStatistical Computations at FreeStatistics.org, Office for Research Development and Education, URL https://freestatistics.org/blog/index.php?v=date/2008/Nov/24/t1227556438tc84biqf53aca8h.htm/, Retrieved Tue, 14 May 2024 08:13:14 +0000
Statistical Computations at FreeStatistics.org, Office for Research Development and Education, URL https://freestatistics.org/blog/index.php?pk=25508, Retrieved Tue, 14 May 2024 08:13:14 +0000
QR Codes:

Original text written by user:
IsPrivate?No (this computation is public)
User-defined keywords
Estimated Impact170
Family? (F = Feedback message, R = changed R code, M = changed R Module, P = changed Parameters, D = changed Data)
F     [Multiple Regression] [] [2007-11-19 19:55:31] [b731da8b544846036771bbf9bf2f34ce]
F    D  [Multiple Regression] [Q3 invloed rookve...] [2008-11-23 18:38:26] [ed2ba3b6182103c15c0ab511ae4e6284]
F   P     [Multiple Regression] [Q3 invloed rookve...] [2008-11-23 19:01:30] [ed2ba3b6182103c15c0ab511ae4e6284]
F             [Multiple Regression] [q3] [2008-11-24 19:53:03] [577b699a0819d2125728ba9ae2c57238] [Current]
Feedback Forum
2008-11-29 16:19:12 [Stijn Van de Velde] [reply
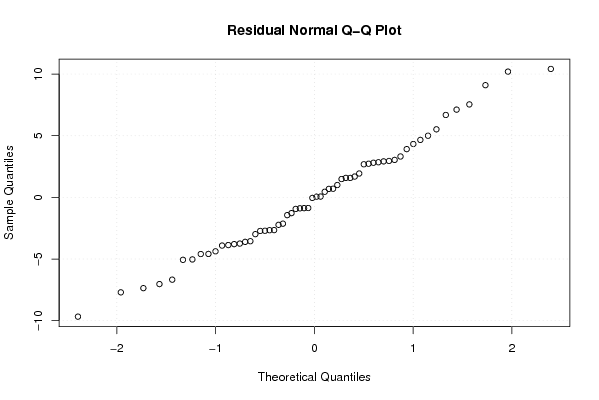
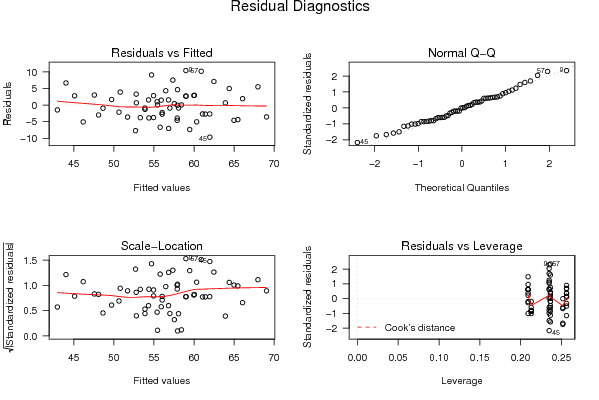
Ook hier ga ik akkoord. Er is weliswaar 50% van de schommeling te verklaren, toch is er nog niet aan alle assumpties voldaan (de residu's zijn niet normaal verdeeld).
2008-11-30 17:30:02 [An De Koninck] [reply
Het is correct dat een r-square waarde van 50% al een beter model is dan dat van 9%, maar voor de rest ga ik toch niet helemaal akkoord.
De student vertelt immers dat hij een lichte negatieve trend ziet, maar als je kijkt naar de referentie en de afwijkingen in de verschillende maanden zie je inderdaad mintekens voor de getallen staan, waardoor je kan zien dat het om een negatieve wijziging gaat, maar ook positieve wijzigingen. Als je immers kijkt naar M11 zie je dat deze een wijziging van 9,95... vertoont, wat dus veel meer is.

Post a new message
Dataseries X:
41.1	0
58	0
63	0
53.8	0
54.7	0
55.5	0
56.1	0
69.6	0
69.4	0
57.2	0
68	0
53.3	0
47.9	0
60.8	0
61.7	0
57.8	0
51.4	0
50.5	0
48.1	0
58.7	0
54	0
56.1	0
60.4	0
51.2	0
50.7	0
56.4	0
53.3	0
52.6	0
47.7	0
49.5	0
48.5	0
55.3	0
49.8	0
57.4	0
64.6	0
53	0
41.5	0
55.9	0
58.4	0
53.5	0
50.6	0
58.5	1
49.1	1
61.1	1
52.3	1
58.4	1
65.5	1
61.7	1
45.1	1
52.1	1
59.3	1
57.9	1
45	1
64.9	1
63.8	1
69.4	1
71.1	1
62.9	1
73.5	1
62.6	1


Summary of computational transaction
Raw Inputview raw input (R code)
Raw Outputview raw output of R engine
Computing time3 seconds
R Server'Gwilym Jenkins' @ 72.249.127.135

\begin{tabular}{lllllllll}
\hline
Summary of computational transaction \tabularnewline
Raw Input & view raw input (R code)  \tabularnewline
Raw Output & view raw output of R engine  \tabularnewline
Computing time & 3 seconds \tabularnewline
R Server & 'Gwilym Jenkins' @ 72.249.127.135 \tabularnewline
\hline
\end{tabular}
%Source: https://freestatistics.org/blog/index.php?pk=25508&T=0

[TABLE]
[ROW][C]Summary of computational transaction[/C][/ROW]
[ROW][C]Raw Input[/C][C]view raw input (R code) [/C][/ROW]
[ROW][C]Raw Output[/C][C]view raw output of R engine [/C][/ROW]
[ROW][C]Computing time[/C][C]3 seconds[/C][/ROW]
[ROW][C]R Server[/C][C]'Gwilym Jenkins' @ 72.249.127.135[/C][/ROW]
[/TABLE]
Source: https://freestatistics.org/blog/index.php?pk=25508&T=0

Globally Unique Identifier (entire table): ba.freestatistics.org/blog/index.php?pk=25508&T=0

As an alternative you can also use a QR Code:  

The GUIDs for individual cells are displayed in the table below:

Summary of computational transaction
Raw Inputview raw input (R code)
Raw Outputview raw output of R engine
Computing time3 seconds
R Server'Gwilym Jenkins' @ 72.249.127.135


Multiple Linear Regression - Estimated Regression Equation
Tabakproductie[t] = + 57.0989753320683 + 6.21726755218215rookverbod[t] -10.8422327640734M1[t] + 0.627375079063885M2[t] + 3.21698292220113M3[t] -0.713409234661605M4[t] -5.86380139152435M5[t] -1.11764705882353M6[t] -3.68803921568628M7[t] + 6.10156862745098M8[t] + 2.69117647058824M9[t] + 1.86078431372549M10[t] + 9.95039215686275M11[t] -0.0896078431372545t + e[t]

\begin{tabular}{lllllllll}
\hline
Multiple Linear Regression - Estimated Regression Equation \tabularnewline
Tabakproductie[t] =  +  57.0989753320683 +  6.21726755218215rookverbod[t] -10.8422327640734M1[t] +  0.627375079063885M2[t] +  3.21698292220113M3[t] -0.713409234661605M4[t] -5.86380139152435M5[t] -1.11764705882353M6[t] -3.68803921568628M7[t] +  6.10156862745098M8[t] +  2.69117647058824M9[t] +  1.86078431372549M10[t] +  9.95039215686275M11[t] -0.0896078431372545t  + e[t] \tabularnewline
\hline
\end{tabular}
%Source: https://freestatistics.org/blog/index.php?pk=25508&T=1

[TABLE]
[ROW][C]Multiple Linear Regression - Estimated Regression Equation[/C][/ROW]
[ROW][C]Tabakproductie[t] =  +  57.0989753320683 +  6.21726755218215rookverbod[t] -10.8422327640734M1[t] +  0.627375079063885M2[t] +  3.21698292220113M3[t] -0.713409234661605M4[t] -5.86380139152435M5[t] -1.11764705882353M6[t] -3.68803921568628M7[t] +  6.10156862745098M8[t] +  2.69117647058824M9[t] +  1.86078431372549M10[t] +  9.95039215686275M11[t] -0.0896078431372545t  + e[t][/C][/ROW]
[/TABLE]
Source: https://freestatistics.org/blog/index.php?pk=25508&T=1

Globally Unique Identifier (entire table): ba.freestatistics.org/blog/index.php?pk=25508&T=1

As an alternative you can also use a QR Code:  

The GUIDs for individual cells are displayed in the table below:

Multiple Linear Regression - Estimated Regression Equation
Tabakproductie[t] = + 57.0989753320683 + 6.21726755218215rookverbod[t] -10.8422327640734M1[t] + 0.627375079063885M2[t] + 3.21698292220113M3[t] -0.713409234661605M4[t] -5.86380139152435M5[t] -1.11764705882353M6[t] -3.68803921568628M7[t] + 6.10156862745098M8[t] + 2.69117647058824M9[t] + 1.86078431372549M10[t] + 9.95039215686275M11[t] -0.0896078431372545t + e[t]


Multiple Linear Regression - Ordinary Least Squares
VariableParameterS.D.T-STATH0: parameter = 02-tail p-value1-tail p-value
(Intercept)57.09897533206832.82404520.218900
rookverbod6.217267552182152.4320532.55640.0139430.006972
M1-10.84223276407343.25275-3.33330.0017020.000851
M20.6273750790638853.2468720.19320.8476340.423817
M33.216982922201133.2422940.99220.3262940.163147
M4-0.7134092346616053.239019-0.22030.8266470.413324
M5-5.863801391524353.237053-1.81150.0766010.038301
M6-1.117647058823533.247041-0.34420.7322610.36613
M7-3.688039215686283.239844-1.13830.2608730.130437
M86.101568627450983.2339431.88670.0655180.032759
M92.691176470588243.2293460.83340.4089540.204477
M101.860784313725493.2260580.57680.5668880.283444
M119.950392156862753.2240843.08630.0034270.001714
t-0.08960784313725450.06515-1.37540.1756640.087832

\begin{tabular}{lllllllll}
\hline
Multiple Linear Regression - Ordinary Least Squares \tabularnewline
Variable & Parameter & S.D. & T-STATH0: parameter = 0 & 2-tail p-value & 1-tail p-value \tabularnewline
(Intercept) & 57.0989753320683 & 2.824045 & 20.2189 & 0 & 0 \tabularnewline
rookverbod & 6.21726755218215 & 2.432053 & 2.5564 & 0.013943 & 0.006972 \tabularnewline
M1 & -10.8422327640734 & 3.25275 & -3.3333 & 0.001702 & 0.000851 \tabularnewline
M2 & 0.627375079063885 & 3.246872 & 0.1932 & 0.847634 & 0.423817 \tabularnewline
M3 & 3.21698292220113 & 3.242294 & 0.9922 & 0.326294 & 0.163147 \tabularnewline
M4 & -0.713409234661605 & 3.239019 & -0.2203 & 0.826647 & 0.413324 \tabularnewline
M5 & -5.86380139152435 & 3.237053 & -1.8115 & 0.076601 & 0.038301 \tabularnewline
M6 & -1.11764705882353 & 3.247041 & -0.3442 & 0.732261 & 0.36613 \tabularnewline
M7 & -3.68803921568628 & 3.239844 & -1.1383 & 0.260873 & 0.130437 \tabularnewline
M8 & 6.10156862745098 & 3.233943 & 1.8867 & 0.065518 & 0.032759 \tabularnewline
M9 & 2.69117647058824 & 3.229346 & 0.8334 & 0.408954 & 0.204477 \tabularnewline
M10 & 1.86078431372549 & 3.226058 & 0.5768 & 0.566888 & 0.283444 \tabularnewline
M11 & 9.95039215686275 & 3.224084 & 3.0863 & 0.003427 & 0.001714 \tabularnewline
t & -0.0896078431372545 & 0.06515 & -1.3754 & 0.175664 & 0.087832 \tabularnewline
\hline
\end{tabular}
%Source: https://freestatistics.org/blog/index.php?pk=25508&T=2

[TABLE]
[ROW][C]Multiple Linear Regression - Ordinary Least Squares[/C][/ROW]
[ROW][C]Variable[/C][C]Parameter[/C][C]S.D.[/C][C]T-STATH0: parameter = 0[/C][C]2-tail p-value[/C][C]1-tail p-value[/C][/ROW]
[ROW][C](Intercept)[/C][C]57.0989753320683[/C][C]2.824045[/C][C]20.2189[/C][C]0[/C][C]0[/C][/ROW]
[ROW][C]rookverbod[/C][C]6.21726755218215[/C][C]2.432053[/C][C]2.5564[/C][C]0.013943[/C][C]0.006972[/C][/ROW]
[ROW][C]M1[/C][C]-10.8422327640734[/C][C]3.25275[/C][C]-3.3333[/C][C]0.001702[/C][C]0.000851[/C][/ROW]
[ROW][C]M2[/C][C]0.627375079063885[/C][C]3.246872[/C][C]0.1932[/C][C]0.847634[/C][C]0.423817[/C][/ROW]
[ROW][C]M3[/C][C]3.21698292220113[/C][C]3.242294[/C][C]0.9922[/C][C]0.326294[/C][C]0.163147[/C][/ROW]
[ROW][C]M4[/C][C]-0.713409234661605[/C][C]3.239019[/C][C]-0.2203[/C][C]0.826647[/C][C]0.413324[/C][/ROW]
[ROW][C]M5[/C][C]-5.86380139152435[/C][C]3.237053[/C][C]-1.8115[/C][C]0.076601[/C][C]0.038301[/C][/ROW]
[ROW][C]M6[/C][C]-1.11764705882353[/C][C]3.247041[/C][C]-0.3442[/C][C]0.732261[/C][C]0.36613[/C][/ROW]
[ROW][C]M7[/C][C]-3.68803921568628[/C][C]3.239844[/C][C]-1.1383[/C][C]0.260873[/C][C]0.130437[/C][/ROW]
[ROW][C]M8[/C][C]6.10156862745098[/C][C]3.233943[/C][C]1.8867[/C][C]0.065518[/C][C]0.032759[/C][/ROW]
[ROW][C]M9[/C][C]2.69117647058824[/C][C]3.229346[/C][C]0.8334[/C][C]0.408954[/C][C]0.204477[/C][/ROW]
[ROW][C]M10[/C][C]1.86078431372549[/C][C]3.226058[/C][C]0.5768[/C][C]0.566888[/C][C]0.283444[/C][/ROW]
[ROW][C]M11[/C][C]9.95039215686275[/C][C]3.224084[/C][C]3.0863[/C][C]0.003427[/C][C]0.001714[/C][/ROW]
[ROW][C]t[/C][C]-0.0896078431372545[/C][C]0.06515[/C][C]-1.3754[/C][C]0.175664[/C][C]0.087832[/C][/ROW]
[/TABLE]
Source: https://freestatistics.org/blog/index.php?pk=25508&T=2

Globally Unique Identifier (entire table): ba.freestatistics.org/blog/index.php?pk=25508&T=2

As an alternative you can also use a QR Code:  

The GUIDs for individual cells are displayed in the table below:

Multiple Linear Regression - Ordinary Least Squares
VariableParameterS.D.T-STATH0: parameter = 02-tail p-value1-tail p-value
(Intercept)57.09897533206832.82404520.218900
rookverbod6.217267552182152.4320532.55640.0139430.006972
M1-10.84223276407343.25275-3.33330.0017020.000851
M20.6273750790638853.2468720.19320.8476340.423817
M33.216982922201133.2422940.99220.3262940.163147
M4-0.7134092346616053.239019-0.22030.8266470.413324
M5-5.863801391524353.237053-1.81150.0766010.038301
M6-1.117647058823533.247041-0.34420.7322610.36613
M7-3.688039215686283.239844-1.13830.2608730.130437
M86.101568627450983.2339431.88670.0655180.032759
M92.691176470588243.2293460.83340.4089540.204477
M101.860784313725493.2260580.57680.5668880.283444
M119.950392156862753.2240843.08630.0034270.001714
t-0.08960784313725450.06515-1.37540.1756640.087832


Multiple Linear Regression - Regression Statistics
Multiple R0.78401888630232
R-squared0.614685614078729
Adjusted R-squared0.505792418057501
F-TEST (value)5.64484868236301
F-TEST (DF numerator)13
F-TEST (DF denominator)46
p-value5.22449834428063e-06
Multiple Linear Regression - Residual Statistics
Residual Standard Deviation5.09668393303671
Sum Squared Residuals1194.90460721063

\begin{tabular}{lllllllll}
\hline
Multiple Linear Regression - Regression Statistics \tabularnewline
Multiple R & 0.78401888630232 \tabularnewline
R-squared & 0.614685614078729 \tabularnewline
Adjusted R-squared & 0.505792418057501 \tabularnewline
F-TEST (value) & 5.64484868236301 \tabularnewline
F-TEST (DF numerator) & 13 \tabularnewline
F-TEST (DF denominator) & 46 \tabularnewline
p-value & 5.22449834428063e-06 \tabularnewline
Multiple Linear Regression - Residual Statistics \tabularnewline
Residual Standard Deviation & 5.09668393303671 \tabularnewline
Sum Squared Residuals & 1194.90460721063 \tabularnewline
\hline
\end{tabular}
%Source: https://freestatistics.org/blog/index.php?pk=25508&T=3

[TABLE]
[ROW][C]Multiple Linear Regression - Regression Statistics[/C][/ROW]
[ROW][C]Multiple R[/C][C]0.78401888630232[/C][/ROW]
[ROW][C]R-squared[/C][C]0.614685614078729[/C][/ROW]
[ROW][C]Adjusted R-squared[/C][C]0.505792418057501[/C][/ROW]
[ROW][C]F-TEST (value)[/C][C]5.64484868236301[/C][/ROW]
[ROW][C]F-TEST (DF numerator)[/C][C]13[/C][/ROW]
[ROW][C]F-TEST (DF denominator)[/C][C]46[/C][/ROW]
[ROW][C]p-value[/C][C]5.22449834428063e-06[/C][/ROW]
[ROW][C]Multiple Linear Regression - Residual Statistics[/C][/ROW]
[ROW][C]Residual Standard Deviation[/C][C]5.09668393303671[/C][/ROW]
[ROW][C]Sum Squared Residuals[/C][C]1194.90460721063[/C][/ROW]
[/TABLE]
Source: https://freestatistics.org/blog/index.php?pk=25508&T=3

Globally Unique Identifier (entire table): ba.freestatistics.org/blog/index.php?pk=25508&T=3

As an alternative you can also use a QR Code:  

The GUIDs for individual cells are displayed in the table below:

Multiple Linear Regression - Regression Statistics
Multiple R0.78401888630232
R-squared0.614685614078729
Adjusted R-squared0.505792418057501
F-TEST (value)5.64484868236301
F-TEST (DF numerator)13
F-TEST (DF denominator)46
p-value5.22449834428063e-06
Multiple Linear Regression - Residual Statistics
Residual Standard Deviation5.09668393303671
Sum Squared Residuals1194.90460721063


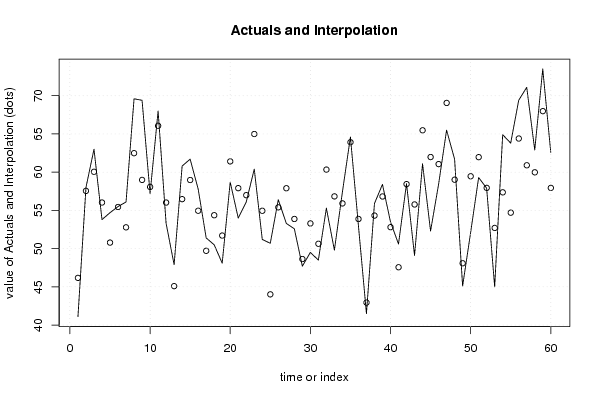
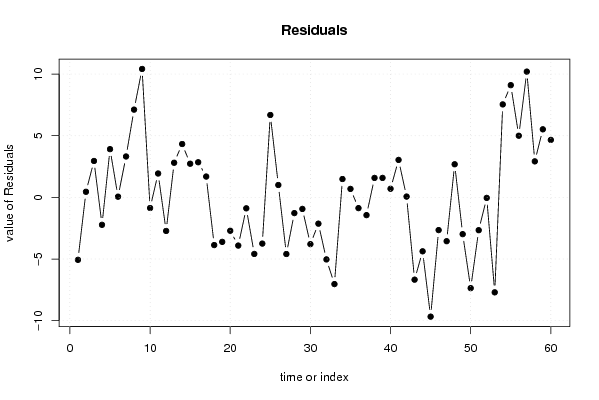
Multiple Linear Regression - Actuals, Interpolation, and Residuals
Time or IndexActualsInterpolationForecastResidualsPrediction Error
141.146.1671347248578-5.06713472485776
25857.54713472485770.452865275142323
36360.04713472485772.9528652751423
453.856.0271347248577-2.22713472485768
554.750.78713472485773.91286527514233
655.555.44368121442130.056318785578745
756.152.78368121442133.31631878557875
869.662.48368121442127.11631878557875
969.458.983681214421210.4163187855788
1057.258.0636812144213-0.863681214421248
116866.06368121442121.93631878557876
1253.356.0236812144212-2.72368121442125
1347.945.09184060721062.80815939278940
1460.856.47184060721064.32815939278937
1561.758.97184060721062.72815939278938
1657.854.95184060721062.84815939278938
1751.449.71184060721061.68815939278937
1850.554.3683870967742-3.86838709677419
1948.151.7083870967742-3.60838709677419
2058.761.4083870967742-2.70838709677419
215457.9083870967742-3.90838709677419
2256.156.9883870967742-0.888387096774191
2360.464.9883870967742-4.58838709677419
2451.254.9483870967742-3.74838709677419
2550.744.01654648956366.68345351043645
2656.455.39654648956361.00345351043643
2753.357.8965464895636-4.59654648956357
2852.653.8765464895636-1.27654648956357
2947.748.6365464895636-0.936546489563568
3049.553.2930929791271-3.79309297912714
3148.550.6330929791271-2.13309297912714
3255.360.3330929791271-5.03309297912714
3349.856.8330929791271-7.03309297912714
3457.455.91309297912711.48690702087286
3564.663.91309297912710.686907020872858
365353.8730929791271-0.873092979127138
3741.542.9412523719165-1.44125237191650
3855.954.32125237191651.57874762808349
3958.456.82125237191651.57874762808349
4053.552.80125237191650.698747628083489
4150.647.56125237191653.03874762808348
4258.558.43506641366220.0649335863377624
4349.155.7750664136622-6.67506641366224
4461.165.4750664136622-4.37506641366224
4552.361.9750664136622-9.67506641366225
4658.461.0550664136622-2.65506641366224
4765.569.0550664136622-3.55506641366224
4861.759.01506641366222.68493358633777
4945.148.0832258064516-2.98322580645159
5052.159.4632258064516-7.36322580645161
5159.361.9632258064516-2.66322580645161
5257.957.9432258064516-0.0432258064516136
534552.7032258064516-7.70322580645162
5464.957.35977229601527.54022770398482
5563.854.69977229601529.10022770398481
5669.464.39977229601525.00022770398482
5771.160.899772296015210.2002277039848
5862.959.97977229601522.92022770398482
5973.567.97977229601525.52022770398482
6062.657.93977229601524.66022770398482

\begin{tabular}{lllllllll}
\hline
Multiple Linear Regression - Actuals, Interpolation, and Residuals \tabularnewline
Time or Index & Actuals & InterpolationForecast & ResidualsPrediction Error \tabularnewline
1 & 41.1 & 46.1671347248578 & -5.06713472485776 \tabularnewline
2 & 58 & 57.5471347248577 & 0.452865275142323 \tabularnewline
3 & 63 & 60.0471347248577 & 2.9528652751423 \tabularnewline
4 & 53.8 & 56.0271347248577 & -2.22713472485768 \tabularnewline
5 & 54.7 & 50.7871347248577 & 3.91286527514233 \tabularnewline
6 & 55.5 & 55.4436812144213 & 0.056318785578745 \tabularnewline
7 & 56.1 & 52.7836812144213 & 3.31631878557875 \tabularnewline
8 & 69.6 & 62.4836812144212 & 7.11631878557875 \tabularnewline
9 & 69.4 & 58.9836812144212 & 10.4163187855788 \tabularnewline
10 & 57.2 & 58.0636812144213 & -0.863681214421248 \tabularnewline
11 & 68 & 66.0636812144212 & 1.93631878557876 \tabularnewline
12 & 53.3 & 56.0236812144212 & -2.72368121442125 \tabularnewline
13 & 47.9 & 45.0918406072106 & 2.80815939278940 \tabularnewline
14 & 60.8 & 56.4718406072106 & 4.32815939278937 \tabularnewline
15 & 61.7 & 58.9718406072106 & 2.72815939278938 \tabularnewline
16 & 57.8 & 54.9518406072106 & 2.84815939278938 \tabularnewline
17 & 51.4 & 49.7118406072106 & 1.68815939278937 \tabularnewline
18 & 50.5 & 54.3683870967742 & -3.86838709677419 \tabularnewline
19 & 48.1 & 51.7083870967742 & -3.60838709677419 \tabularnewline
20 & 58.7 & 61.4083870967742 & -2.70838709677419 \tabularnewline
21 & 54 & 57.9083870967742 & -3.90838709677419 \tabularnewline
22 & 56.1 & 56.9883870967742 & -0.888387096774191 \tabularnewline
23 & 60.4 & 64.9883870967742 & -4.58838709677419 \tabularnewline
24 & 51.2 & 54.9483870967742 & -3.74838709677419 \tabularnewline
25 & 50.7 & 44.0165464895636 & 6.68345351043645 \tabularnewline
26 & 56.4 & 55.3965464895636 & 1.00345351043643 \tabularnewline
27 & 53.3 & 57.8965464895636 & -4.59654648956357 \tabularnewline
28 & 52.6 & 53.8765464895636 & -1.27654648956357 \tabularnewline
29 & 47.7 & 48.6365464895636 & -0.936546489563568 \tabularnewline
30 & 49.5 & 53.2930929791271 & -3.79309297912714 \tabularnewline
31 & 48.5 & 50.6330929791271 & -2.13309297912714 \tabularnewline
32 & 55.3 & 60.3330929791271 & -5.03309297912714 \tabularnewline
33 & 49.8 & 56.8330929791271 & -7.03309297912714 \tabularnewline
34 & 57.4 & 55.9130929791271 & 1.48690702087286 \tabularnewline
35 & 64.6 & 63.9130929791271 & 0.686907020872858 \tabularnewline
36 & 53 & 53.8730929791271 & -0.873092979127138 \tabularnewline
37 & 41.5 & 42.9412523719165 & -1.44125237191650 \tabularnewline
38 & 55.9 & 54.3212523719165 & 1.57874762808349 \tabularnewline
39 & 58.4 & 56.8212523719165 & 1.57874762808349 \tabularnewline
40 & 53.5 & 52.8012523719165 & 0.698747628083489 \tabularnewline
41 & 50.6 & 47.5612523719165 & 3.03874762808348 \tabularnewline
42 & 58.5 & 58.4350664136622 & 0.0649335863377624 \tabularnewline
43 & 49.1 & 55.7750664136622 & -6.67506641366224 \tabularnewline
44 & 61.1 & 65.4750664136622 & -4.37506641366224 \tabularnewline
45 & 52.3 & 61.9750664136622 & -9.67506641366225 \tabularnewline
46 & 58.4 & 61.0550664136622 & -2.65506641366224 \tabularnewline
47 & 65.5 & 69.0550664136622 & -3.55506641366224 \tabularnewline
48 & 61.7 & 59.0150664136622 & 2.68493358633777 \tabularnewline
49 & 45.1 & 48.0832258064516 & -2.98322580645159 \tabularnewline
50 & 52.1 & 59.4632258064516 & -7.36322580645161 \tabularnewline
51 & 59.3 & 61.9632258064516 & -2.66322580645161 \tabularnewline
52 & 57.9 & 57.9432258064516 & -0.0432258064516136 \tabularnewline
53 & 45 & 52.7032258064516 & -7.70322580645162 \tabularnewline
54 & 64.9 & 57.3597722960152 & 7.54022770398482 \tabularnewline
55 & 63.8 & 54.6997722960152 & 9.10022770398481 \tabularnewline
56 & 69.4 & 64.3997722960152 & 5.00022770398482 \tabularnewline
57 & 71.1 & 60.8997722960152 & 10.2002277039848 \tabularnewline
58 & 62.9 & 59.9797722960152 & 2.92022770398482 \tabularnewline
59 & 73.5 & 67.9797722960152 & 5.52022770398482 \tabularnewline
60 & 62.6 & 57.9397722960152 & 4.66022770398482 \tabularnewline
\hline
\end{tabular}
%Source: https://freestatistics.org/blog/index.php?pk=25508&T=4

[TABLE]
[ROW][C]Multiple Linear Regression - Actuals, Interpolation, and Residuals[/C][/ROW]
[ROW][C]Time or Index[/C][C]Actuals[/C][C]InterpolationForecast[/C][C]ResidualsPrediction Error[/C][/ROW]
[ROW][C]1[/C][C]41.1[/C][C]46.1671347248578[/C][C]-5.06713472485776[/C][/ROW]
[ROW][C]2[/C][C]58[/C][C]57.5471347248577[/C][C]0.452865275142323[/C][/ROW]
[ROW][C]3[/C][C]63[/C][C]60.0471347248577[/C][C]2.9528652751423[/C][/ROW]
[ROW][C]4[/C][C]53.8[/C][C]56.0271347248577[/C][C]-2.22713472485768[/C][/ROW]
[ROW][C]5[/C][C]54.7[/C][C]50.7871347248577[/C][C]3.91286527514233[/C][/ROW]
[ROW][C]6[/C][C]55.5[/C][C]55.4436812144213[/C][C]0.056318785578745[/C][/ROW]
[ROW][C]7[/C][C]56.1[/C][C]52.7836812144213[/C][C]3.31631878557875[/C][/ROW]
[ROW][C]8[/C][C]69.6[/C][C]62.4836812144212[/C][C]7.11631878557875[/C][/ROW]
[ROW][C]9[/C][C]69.4[/C][C]58.9836812144212[/C][C]10.4163187855788[/C][/ROW]
[ROW][C]10[/C][C]57.2[/C][C]58.0636812144213[/C][C]-0.863681214421248[/C][/ROW]
[ROW][C]11[/C][C]68[/C][C]66.0636812144212[/C][C]1.93631878557876[/C][/ROW]
[ROW][C]12[/C][C]53.3[/C][C]56.0236812144212[/C][C]-2.72368121442125[/C][/ROW]
[ROW][C]13[/C][C]47.9[/C][C]45.0918406072106[/C][C]2.80815939278940[/C][/ROW]
[ROW][C]14[/C][C]60.8[/C][C]56.4718406072106[/C][C]4.32815939278937[/C][/ROW]
[ROW][C]15[/C][C]61.7[/C][C]58.9718406072106[/C][C]2.72815939278938[/C][/ROW]
[ROW][C]16[/C][C]57.8[/C][C]54.9518406072106[/C][C]2.84815939278938[/C][/ROW]
[ROW][C]17[/C][C]51.4[/C][C]49.7118406072106[/C][C]1.68815939278937[/C][/ROW]
[ROW][C]18[/C][C]50.5[/C][C]54.3683870967742[/C][C]-3.86838709677419[/C][/ROW]
[ROW][C]19[/C][C]48.1[/C][C]51.7083870967742[/C][C]-3.60838709677419[/C][/ROW]
[ROW][C]20[/C][C]58.7[/C][C]61.4083870967742[/C][C]-2.70838709677419[/C][/ROW]
[ROW][C]21[/C][C]54[/C][C]57.9083870967742[/C][C]-3.90838709677419[/C][/ROW]
[ROW][C]22[/C][C]56.1[/C][C]56.9883870967742[/C][C]-0.888387096774191[/C][/ROW]
[ROW][C]23[/C][C]60.4[/C][C]64.9883870967742[/C][C]-4.58838709677419[/C][/ROW]
[ROW][C]24[/C][C]51.2[/C][C]54.9483870967742[/C][C]-3.74838709677419[/C][/ROW]
[ROW][C]25[/C][C]50.7[/C][C]44.0165464895636[/C][C]6.68345351043645[/C][/ROW]
[ROW][C]26[/C][C]56.4[/C][C]55.3965464895636[/C][C]1.00345351043643[/C][/ROW]
[ROW][C]27[/C][C]53.3[/C][C]57.8965464895636[/C][C]-4.59654648956357[/C][/ROW]
[ROW][C]28[/C][C]52.6[/C][C]53.8765464895636[/C][C]-1.27654648956357[/C][/ROW]
[ROW][C]29[/C][C]47.7[/C][C]48.6365464895636[/C][C]-0.936546489563568[/C][/ROW]
[ROW][C]30[/C][C]49.5[/C][C]53.2930929791271[/C][C]-3.79309297912714[/C][/ROW]
[ROW][C]31[/C][C]48.5[/C][C]50.6330929791271[/C][C]-2.13309297912714[/C][/ROW]
[ROW][C]32[/C][C]55.3[/C][C]60.3330929791271[/C][C]-5.03309297912714[/C][/ROW]
[ROW][C]33[/C][C]49.8[/C][C]56.8330929791271[/C][C]-7.03309297912714[/C][/ROW]
[ROW][C]34[/C][C]57.4[/C][C]55.9130929791271[/C][C]1.48690702087286[/C][/ROW]
[ROW][C]35[/C][C]64.6[/C][C]63.9130929791271[/C][C]0.686907020872858[/C][/ROW]
[ROW][C]36[/C][C]53[/C][C]53.8730929791271[/C][C]-0.873092979127138[/C][/ROW]
[ROW][C]37[/C][C]41.5[/C][C]42.9412523719165[/C][C]-1.44125237191650[/C][/ROW]
[ROW][C]38[/C][C]55.9[/C][C]54.3212523719165[/C][C]1.57874762808349[/C][/ROW]
[ROW][C]39[/C][C]58.4[/C][C]56.8212523719165[/C][C]1.57874762808349[/C][/ROW]
[ROW][C]40[/C][C]53.5[/C][C]52.8012523719165[/C][C]0.698747628083489[/C][/ROW]
[ROW][C]41[/C][C]50.6[/C][C]47.5612523719165[/C][C]3.03874762808348[/C][/ROW]
[ROW][C]42[/C][C]58.5[/C][C]58.4350664136622[/C][C]0.0649335863377624[/C][/ROW]
[ROW][C]43[/C][C]49.1[/C][C]55.7750664136622[/C][C]-6.67506641366224[/C][/ROW]
[ROW][C]44[/C][C]61.1[/C][C]65.4750664136622[/C][C]-4.37506641366224[/C][/ROW]
[ROW][C]45[/C][C]52.3[/C][C]61.9750664136622[/C][C]-9.67506641366225[/C][/ROW]
[ROW][C]46[/C][C]58.4[/C][C]61.0550664136622[/C][C]-2.65506641366224[/C][/ROW]
[ROW][C]47[/C][C]65.5[/C][C]69.0550664136622[/C][C]-3.55506641366224[/C][/ROW]
[ROW][C]48[/C][C]61.7[/C][C]59.0150664136622[/C][C]2.68493358633777[/C][/ROW]
[ROW][C]49[/C][C]45.1[/C][C]48.0832258064516[/C][C]-2.98322580645159[/C][/ROW]
[ROW][C]50[/C][C]52.1[/C][C]59.4632258064516[/C][C]-7.36322580645161[/C][/ROW]
[ROW][C]51[/C][C]59.3[/C][C]61.9632258064516[/C][C]-2.66322580645161[/C][/ROW]
[ROW][C]52[/C][C]57.9[/C][C]57.9432258064516[/C][C]-0.0432258064516136[/C][/ROW]
[ROW][C]53[/C][C]45[/C][C]52.7032258064516[/C][C]-7.70322580645162[/C][/ROW]
[ROW][C]54[/C][C]64.9[/C][C]57.3597722960152[/C][C]7.54022770398482[/C][/ROW]
[ROW][C]55[/C][C]63.8[/C][C]54.6997722960152[/C][C]9.10022770398481[/C][/ROW]
[ROW][C]56[/C][C]69.4[/C][C]64.3997722960152[/C][C]5.00022770398482[/C][/ROW]
[ROW][C]57[/C][C]71.1[/C][C]60.8997722960152[/C][C]10.2002277039848[/C][/ROW]
[ROW][C]58[/C][C]62.9[/C][C]59.9797722960152[/C][C]2.92022770398482[/C][/ROW]
[ROW][C]59[/C][C]73.5[/C][C]67.9797722960152[/C][C]5.52022770398482[/C][/ROW]
[ROW][C]60[/C][C]62.6[/C][C]57.9397722960152[/C][C]4.66022770398482[/C][/ROW]
[/TABLE]
Source: https://freestatistics.org/blog/index.php?pk=25508&T=4

Globally Unique Identifier (entire table): ba.freestatistics.org/blog/index.php?pk=25508&T=4

As an alternative you can also use a QR Code:  

The GUIDs for individual cells are displayed in the table below:

Multiple Linear Regression - Actuals, Interpolation, and Residuals
Time or IndexActualsInterpolationForecastResidualsPrediction Error
141.146.1671347248578-5.06713472485776
25857.54713472485770.452865275142323
36360.04713472485772.9528652751423
453.856.0271347248577-2.22713472485768
554.750.78713472485773.91286527514233
655.555.44368121442130.056318785578745
756.152.78368121442133.31631878557875
869.662.48368121442127.11631878557875
969.458.983681214421210.4163187855788
1057.258.0636812144213-0.863681214421248
116866.06368121442121.93631878557876
1253.356.0236812144212-2.72368121442125
1347.945.09184060721062.80815939278940
1460.856.47184060721064.32815939278937
1561.758.97184060721062.72815939278938
1657.854.95184060721062.84815939278938
1751.449.71184060721061.68815939278937
1850.554.3683870967742-3.86838709677419
1948.151.7083870967742-3.60838709677419
2058.761.4083870967742-2.70838709677419
215457.9083870967742-3.90838709677419
2256.156.9883870967742-0.888387096774191
2360.464.9883870967742-4.58838709677419
2451.254.9483870967742-3.74838709677419
2550.744.01654648956366.68345351043645
2656.455.39654648956361.00345351043643
2753.357.8965464895636-4.59654648956357
2852.653.8765464895636-1.27654648956357
2947.748.6365464895636-0.936546489563568
3049.553.2930929791271-3.79309297912714
3148.550.6330929791271-2.13309297912714
3255.360.3330929791271-5.03309297912714
3349.856.8330929791271-7.03309297912714
3457.455.91309297912711.48690702087286
3564.663.91309297912710.686907020872858
365353.8730929791271-0.873092979127138
3741.542.9412523719165-1.44125237191650
3855.954.32125237191651.57874762808349
3958.456.82125237191651.57874762808349
4053.552.80125237191650.698747628083489
4150.647.56125237191653.03874762808348
4258.558.43506641366220.0649335863377624
4349.155.7750664136622-6.67506641366224
4461.165.4750664136622-4.37506641366224
4552.361.9750664136622-9.67506641366225
4658.461.0550664136622-2.65506641366224
4765.569.0550664136622-3.55506641366224
4861.759.01506641366222.68493358633777
4945.148.0832258064516-2.98322580645159
5052.159.4632258064516-7.36322580645161
5159.361.9632258064516-2.66322580645161
5257.957.9432258064516-0.0432258064516136
534552.7032258064516-7.70322580645162
5464.957.35977229601527.54022770398482
5563.854.69977229601529.10022770398481
5669.464.39977229601525.00022770398482
5771.160.899772296015210.2002277039848
5862.959.97977229601522.92022770398482
5973.567.97977229601525.52022770398482
6062.657.93977229601524.66022770398482


Parameters (Session):
par1 = 1 ; par2 = Include Monthly Dummies ; par3 = Linear Trend ;
Parameters (R input):
par1 = 1 ; par2 = Include Monthly Dummies ; par3 = Linear Trend ;
R code (references can be found in the software module):
library(lattice)
par1 <- as.numeric(par1)
x <- t(y)
k <- length(x[1,])
n <- length(x[,1])
x1 <- cbind(x[,par1], x[,1:k!=par1])
mycolnames <- c(colnames(x)[par1], colnames(x)[1:k!=par1])
colnames(x1) <- mycolnames #colnames(x)[par1]
x <- x1
if (par3 == 'First Differences'){
x2 <- array(0, dim=c(n-1,k), dimnames=list(1:(n-1), paste('(1-B)',colnames(x),sep='')))
for (i in 1:n-1) {
for (j in 1:k) {
x2[i,j] <- x[i+1,j] - x[i,j]
}
}
x <- x2
}
if (par2 == 'Include Monthly Dummies'){
x2 <- array(0, dim=c(n,11), dimnames=list(1:n, paste('M', seq(1:11), sep ='')))
for (i in 1:11){
x2[seq(i,n,12),i] <- 1
}
x <- cbind(x, x2)
}
if (par2 == 'Include Quarterly Dummies'){
x2 <- array(0, dim=c(n,3), dimnames=list(1:n, paste('Q', seq(1:3), sep ='')))
for (i in 1:3){
x2[seq(i,n,4),i] <- 1
}
x <- cbind(x, x2)
}
k <- length(x[1,])
if (par3 == 'Linear Trend'){
x <- cbind(x, c(1:n))
colnames(x)[k+1] <- 't'
}
x
k <- length(x[1,])
df <- as.data.frame(x)
(mylm <- lm(df))
(mysum <- summary(mylm))
bitmap(file='test0.png')
plot(x[,1], type='l', main='Actuals and Interpolation', ylab='value of Actuals and Interpolation (dots)', xlab='time or index')
points(x[,1]-mysum$resid)
grid()
dev.off()
bitmap(file='test1.png')
plot(mysum$resid, type='b', pch=19, main='Residuals', ylab='value of Residuals', xlab='time or index')
grid()
dev.off()
bitmap(file='test2.png')
hist(mysum$resid, main='Residual Histogram', xlab='values of Residuals')
grid()
dev.off()
bitmap(file='test3.png')
densityplot(~mysum$resid,col='black',main='Residual Density Plot', xlab='values of Residuals')
dev.off()
bitmap(file='test4.png')
qqnorm(mysum$resid, main='Residual Normal Q-Q Plot')
grid()
dev.off()
(myerror <- as.ts(mysum$resid))
bitmap(file='test5.png')
dum <- cbind(lag(myerror,k=1),myerror)
dum
dum1 <- dum[2:length(myerror),]
dum1
z <- as.data.frame(dum1)
z
plot(z,main=paste('Residual Lag plot, lowess, and regression line'), ylab='values of Residuals', xlab='lagged values of Residuals')
lines(lowess(z))
abline(lm(z))
grid()
dev.off()
bitmap(file='test6.png')
acf(mysum$resid, lag.max=length(mysum$resid)/2, main='Residual Autocorrelation Function')
grid()
dev.off()
bitmap(file='test7.png')
pacf(mysum$resid, lag.max=length(mysum$resid)/2, main='Residual Partial Autocorrelation Function')
grid()
dev.off()
bitmap(file='test8.png')
opar <- par(mfrow = c(2,2), oma = c(0, 0, 1.1, 0))
plot(mylm, las = 1, sub='Residual Diagnostics')
par(opar)
dev.off()
load(file='createtable')
a<-table.start()
a<-table.row.start(a)
a<-table.element(a, 'Multiple Linear Regression - Estimated Regression Equation', 1, TRUE)
a<-table.row.end(a)
myeq <- colnames(x)[1]
myeq <- paste(myeq, '[t] = ', sep='')
for (i in 1:k){
if (mysum$coefficients[i,1] > 0) myeq <- paste(myeq, '+', '')
myeq <- paste(myeq, mysum$coefficients[i,1], sep=' ')
if (rownames(mysum$coefficients)[i] != '(Intercept)') {
myeq <- paste(myeq, rownames(mysum$coefficients)[i], sep='')
if (rownames(mysum$coefficients)[i] != 't') myeq <- paste(myeq, '[t]', sep='')
}
}
myeq <- paste(myeq, ' + e[t]')
a<-table.row.start(a)
a<-table.element(a, myeq)
a<-table.row.end(a)
a<-table.end(a)
table.save(a,file='mytable1.tab')
a<-table.start()
a<-table.row.start(a)
a<-table.element(a,hyperlink('ols1.htm','Multiple Linear Regression - Ordinary Least Squares',''), 6, TRUE)
a<-table.row.end(a)
a<-table.row.start(a)
a<-table.element(a,'Variable',header=TRUE)
a<-table.element(a,'Parameter',header=TRUE)
a<-table.element(a,'S.D.',header=TRUE)
a<-table.element(a,'T-STAT
H0: parameter = 0',header=TRUE)
a<-table.element(a,'2-tail p-value',header=TRUE)
a<-table.element(a,'1-tail p-value',header=TRUE)
a<-table.row.end(a)
for (i in 1:k){
a<-table.row.start(a)
a<-table.element(a,rownames(mysum$coefficients)[i],header=TRUE)
a<-table.element(a,mysum$coefficients[i,1])
a<-table.element(a, round(mysum$coefficients[i,2],6))
a<-table.element(a, round(mysum$coefficients[i,3],4))
a<-table.element(a, round(mysum$coefficients[i,4],6))
a<-table.element(a, round(mysum$coefficients[i,4]/2,6))
a<-table.row.end(a)
}
a<-table.end(a)
table.save(a,file='mytable2.tab')
a<-table.start()
a<-table.row.start(a)
a<-table.element(a, 'Multiple Linear Regression - Regression Statistics', 2, TRUE)
a<-table.row.end(a)
a<-table.row.start(a)
a<-table.element(a, 'Multiple R',1,TRUE)
a<-table.element(a, sqrt(mysum$r.squared))
a<-table.row.end(a)
a<-table.row.start(a)
a<-table.element(a, 'R-squared',1,TRUE)
a<-table.element(a, mysum$r.squared)
a<-table.row.end(a)
a<-table.row.start(a)
a<-table.element(a, 'Adjusted R-squared',1,TRUE)
a<-table.element(a, mysum$adj.r.squared)
a<-table.row.end(a)
a<-table.row.start(a)
a<-table.element(a, 'F-TEST (value)',1,TRUE)
a<-table.element(a, mysum$fstatistic[1])
a<-table.row.end(a)
a<-table.row.start(a)
a<-table.element(a, 'F-TEST (DF numerator)',1,TRUE)
a<-table.element(a, mysum$fstatistic[2])
a<-table.row.end(a)
a<-table.row.start(a)
a<-table.element(a, 'F-TEST (DF denominator)',1,TRUE)
a<-table.element(a, mysum$fstatistic[3])
a<-table.row.end(a)
a<-table.row.start(a)
a<-table.element(a, 'p-value',1,TRUE)
a<-table.element(a, 1-pf(mysum$fstatistic[1],mysum$fstatistic[2],mysum$fstatistic[3]))
a<-table.row.end(a)
a<-table.row.start(a)
a<-table.element(a, 'Multiple Linear Regression - Residual Statistics', 2, TRUE)
a<-table.row.end(a)
a<-table.row.start(a)
a<-table.element(a, 'Residual Standard Deviation',1,TRUE)
a<-table.element(a, mysum$sigma)
a<-table.row.end(a)
a<-table.row.start(a)
a<-table.element(a, 'Sum Squared Residuals',1,TRUE)
a<-table.element(a, sum(myerror*myerror))
a<-table.row.end(a)
a<-table.end(a)
table.save(a,file='mytable3.tab')
a<-table.start()
a<-table.row.start(a)
a<-table.element(a, 'Multiple Linear Regression - Actuals, Interpolation, and Residuals', 4, TRUE)
a<-table.row.end(a)
a<-table.row.start(a)
a<-table.element(a, 'Time or Index', 1, TRUE)
a<-table.element(a, 'Actuals', 1, TRUE)
a<-table.element(a, 'Interpolation
Forecast', 1, TRUE)
a<-table.element(a, 'Residuals
Prediction Error', 1, TRUE)
a<-table.row.end(a)
for (i in 1:n) {
a<-table.row.start(a)
a<-table.element(a,i, 1, TRUE)
a<-table.element(a,x[i])
a<-table.element(a,x[i]-mysum$resid[i])
a<-table.element(a,mysum$resid[i])
a<-table.row.end(a)
}
a<-table.end(a)
table.save(a,file='mytable4.tab')