Free Statistics

of Irreproducible Research!

Author's title

Author*The author of this computation has been verified*
R Software Modulerwasp_multipleregression.wasp
Title produced by softwareMultiple Regression
Date of computationMon, 24 Nov 2008 12:50:44 -0700
Cite this page as followsStatistical Computations at FreeStatistics.org, Office for Research Development and Education, URL https://freestatistics.org/blog/index.php?v=date/2008/Nov/24/t1227556302rknvgj6xbrceqjc.htm/, Retrieved Tue, 14 May 2024 01:29:09 +0000
Statistical Computations at FreeStatistics.org, Office for Research Development and Education, URL https://freestatistics.org/blog/index.php?pk=25505, Retrieved Tue, 14 May 2024 01:29:09 +0000
QR Codes:

Original text written by user:
IsPrivate?No (this computation is public)
User-defined keywords
Estimated Impact179
Family? (F = Feedback message, R = changed R code, M = changed R Module, P = changed Parameters, D = changed Data)
F     [Multiple Regression] [] [2007-11-19 19:55:31] [b731da8b544846036771bbf9bf2f34ce]
F    D  [Multiple Regression] [Q3 invloed rookve...] [2008-11-23 18:38:26] [ed2ba3b6182103c15c0ab511ae4e6284]
F           [Multiple Regression] [q3] [2008-11-24 19:50:44] [577b699a0819d2125728ba9ae2c57238] [Current]
Feedback Forum
2008-11-29 16:16:16 [Stijn Van de Velde] [reply
Ik ga akkoord met jouw uitleg. De 9% is inderdaad te laag.
2008-11-30 17:25:48 [An De Koninck] [reply
Ik ga ermee akkoord dat de 9% te weinig is. De overige 91% moet je immers aan het toeval wijten.
Met volgende zin ga ik echter niet akkoord: 'Dit zou men beter kunnen analyseren met statistieken over de consumptie van tabak in plaats van de productie'.
Dit kan ik uitleggen aan de hand van de vraag en aanbodfunctie. De productie spiegelt immers de vraag weer. Dus als er veel gevraagd wordt zal het aanbod ook stijgen, en als de vraag daalt zal het aanbod stijgen.
Dus werken met statistieken over de consumptie van tabak zal niet veel wijzigen aan het dummy-probleem.

Post a new message
Dataseries X:
41.1	0
58	0
63	0
53.8	0
54.7	0
55.5	0
56.1	0
69.6	0
69.4	0
57.2	0
68	0
53.3	0
47.9	0
60.8	0
61.7	0
57.8	0
51.4	0
50.5	0
48.1	0
58.7	0
54	0
56.1	0
60.4	0
51.2	0
50.7	0
56.4	0
53.3	0
52.6	0
47.7	0
49.5	0
48.5	0
55.3	0
49.8	0
57.4	0
64.6	0
53	0
41.5	0
55.9	0
58.4	0
53.5	0
50.6	0
58.5	1
49.1	1
61.1	1
52.3	1
58.4	1
65.5	1
61.7	1
45.1	1
52.1	1
59.3	1
57.9	1
45	1
64.9	1
63.8	1
69.4	1
71.1	1
62.9	1
73.5	1
62.6	1


Summary of computational transaction
Raw Inputview raw input (R code)
Raw Outputview raw output of R engine
Computing time5 seconds
R Server'Sir Ronald Aylmer Fisher' @ 193.190.124.24

\begin{tabular}{lllllllll}
\hline
Summary of computational transaction \tabularnewline
Raw Input & view raw input (R code)  \tabularnewline
Raw Output & view raw output of R engine  \tabularnewline
Computing time & 5 seconds \tabularnewline
R Server & 'Sir Ronald Aylmer Fisher' @ 193.190.124.24 \tabularnewline
\hline
\end{tabular}
%Source: https://freestatistics.org/blog/index.php?pk=25505&T=0

[TABLE]
[ROW][C]Summary of computational transaction[/C][/ROW]
[ROW][C]Raw Input[/C][C]view raw input (R code) [/C][/ROW]
[ROW][C]Raw Output[/C][C]view raw output of R engine [/C][/ROW]
[ROW][C]Computing time[/C][C]5 seconds[/C][/ROW]
[ROW][C]R Server[/C][C]'Sir Ronald Aylmer Fisher' @ 193.190.124.24[/C][/ROW]
[/TABLE]
Source: https://freestatistics.org/blog/index.php?pk=25505&T=0

Globally Unique Identifier (entire table): ba.freestatistics.org/blog/index.php?pk=25505&T=0

As an alternative you can also use a QR Code:  

The GUIDs for individual cells are displayed in the table below:

Summary of computational transaction
Raw Inputview raw input (R code)
Raw Outputview raw output of R engine
Computing time5 seconds
R Server'Sir Ronald Aylmer Fisher' @ 193.190.124.24


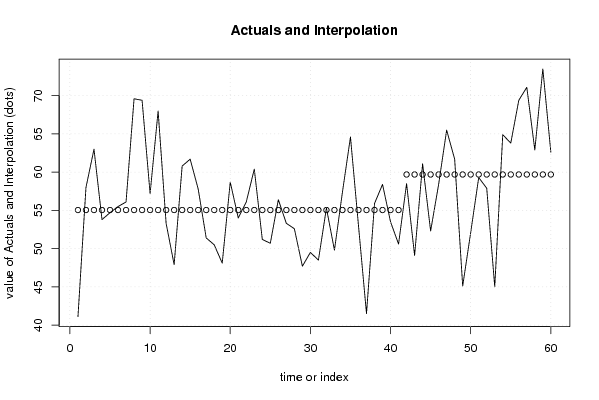
Multiple Linear Regression - Estimated Regression Equation
Tabakproductie[t] = + 55.0487804878049 + 4.64595635430039rookverbod[t] + e[t]

\begin{tabular}{lllllllll}
\hline
Multiple Linear Regression - Estimated Regression Equation \tabularnewline
Tabakproductie[t] =  +  55.0487804878049 +  4.64595635430039rookverbod[t]  + e[t] \tabularnewline
\hline
\end{tabular}
%Source: https://freestatistics.org/blog/index.php?pk=25505&T=1

[TABLE]
[ROW][C]Multiple Linear Regression - Estimated Regression Equation[/C][/ROW]
[ROW][C]Tabakproductie[t] =  +  55.0487804878049 +  4.64595635430039rookverbod[t]  + e[t][/C][/ROW]
[/TABLE]
Source: https://freestatistics.org/blog/index.php?pk=25505&T=1

Globally Unique Identifier (entire table): ba.freestatistics.org/blog/index.php?pk=25505&T=1

As an alternative you can also use a QR Code:  

The GUIDs for individual cells are displayed in the table below:

Multiple Linear Regression - Estimated Regression Equation
Tabakproductie[t] = + 55.0487804878049 + 4.64595635430039rookverbod[t] + e[t]


Multiple Linear Regression - Ordinary Least Squares
VariableParameterS.D.T-STATH0: parameter = 02-tail p-value1-tail p-value
(Intercept)55.04878048780491.08914550.543100
rookverbod4.645956354300391.9354622.40040.0196050.009802

\begin{tabular}{lllllllll}
\hline
Multiple Linear Regression - Ordinary Least Squares \tabularnewline
Variable & Parameter & S.D. & T-STATH0: parameter = 0 & 2-tail p-value & 1-tail p-value \tabularnewline
(Intercept) & 55.0487804878049 & 1.089145 & 50.5431 & 0 & 0 \tabularnewline
rookverbod & 4.64595635430039 & 1.935462 & 2.4004 & 0.019605 & 0.009802 \tabularnewline
\hline
\end{tabular}
%Source: https://freestatistics.org/blog/index.php?pk=25505&T=2

[TABLE]
[ROW][C]Multiple Linear Regression - Ordinary Least Squares[/C][/ROW]
[ROW][C]Variable[/C][C]Parameter[/C][C]S.D.[/C][C]T-STATH0: parameter = 0[/C][C]2-tail p-value[/C][C]1-tail p-value[/C][/ROW]
[ROW][C](Intercept)[/C][C]55.0487804878049[/C][C]1.089145[/C][C]50.5431[/C][C]0[/C][C]0[/C][/ROW]
[ROW][C]rookverbod[/C][C]4.64595635430039[/C][C]1.935462[/C][C]2.4004[/C][C]0.019605[/C][C]0.009802[/C][/ROW]
[/TABLE]
Source: https://freestatistics.org/blog/index.php?pk=25505&T=2

Globally Unique Identifier (entire table): ba.freestatistics.org/blog/index.php?pk=25505&T=2

As an alternative you can also use a QR Code:  

The GUIDs for individual cells are displayed in the table below:

Multiple Linear Regression - Ordinary Least Squares
VariableParameterS.D.T-STATH0: parameter = 02-tail p-value1-tail p-value
(Intercept)55.04878048780491.08914550.543100
rookverbod4.645956354300391.9354622.40040.0196050.009802


Multiple Linear Regression - Regression Statistics
Multiple R0.300614014507371
R-squared0.090368785718238
Adjusted R-squared0.0746854889202766
F-TEST (value)5.76210390470864
F-TEST (DF numerator)1
F-TEST (DF denominator)58
p-value0.0196047568983011
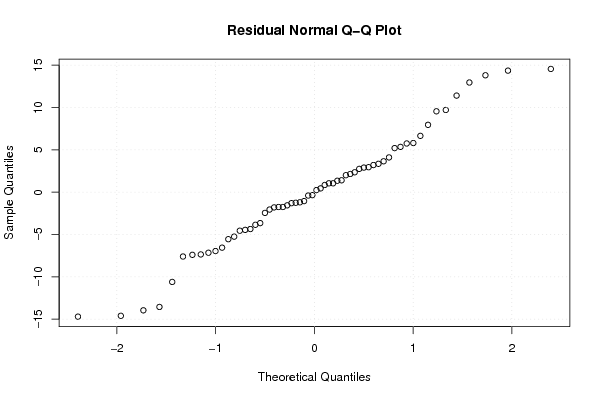
Multiple Linear Regression - Residual Statistics
Residual Standard Deviation6.97393164813844
Sum Squared Residuals2820.8719127086

\begin{tabular}{lllllllll}
\hline
Multiple Linear Regression - Regression Statistics \tabularnewline
Multiple R & 0.300614014507371 \tabularnewline
R-squared & 0.090368785718238 \tabularnewline
Adjusted R-squared & 0.0746854889202766 \tabularnewline
F-TEST (value) & 5.76210390470864 \tabularnewline
F-TEST (DF numerator) & 1 \tabularnewline
F-TEST (DF denominator) & 58 \tabularnewline
p-value & 0.0196047568983011 \tabularnewline
Multiple Linear Regression - Residual Statistics \tabularnewline
Residual Standard Deviation & 6.97393164813844 \tabularnewline
Sum Squared Residuals & 2820.8719127086 \tabularnewline
\hline
\end{tabular}
%Source: https://freestatistics.org/blog/index.php?pk=25505&T=3

[TABLE]
[ROW][C]Multiple Linear Regression - Regression Statistics[/C][/ROW]
[ROW][C]Multiple R[/C][C]0.300614014507371[/C][/ROW]
[ROW][C]R-squared[/C][C]0.090368785718238[/C][/ROW]
[ROW][C]Adjusted R-squared[/C][C]0.0746854889202766[/C][/ROW]
[ROW][C]F-TEST (value)[/C][C]5.76210390470864[/C][/ROW]
[ROW][C]F-TEST (DF numerator)[/C][C]1[/C][/ROW]
[ROW][C]F-TEST (DF denominator)[/C][C]58[/C][/ROW]
[ROW][C]p-value[/C][C]0.0196047568983011[/C][/ROW]
[ROW][C]Multiple Linear Regression - Residual Statistics[/C][/ROW]
[ROW][C]Residual Standard Deviation[/C][C]6.97393164813844[/C][/ROW]
[ROW][C]Sum Squared Residuals[/C][C]2820.8719127086[/C][/ROW]
[/TABLE]
Source: https://freestatistics.org/blog/index.php?pk=25505&T=3

Globally Unique Identifier (entire table): ba.freestatistics.org/blog/index.php?pk=25505&T=3

As an alternative you can also use a QR Code:  

The GUIDs for individual cells are displayed in the table below:

Multiple Linear Regression - Regression Statistics
Multiple R0.300614014507371
R-squared0.090368785718238
Adjusted R-squared0.0746854889202766
F-TEST (value)5.76210390470864
F-TEST (DF numerator)1
F-TEST (DF denominator)58
p-value0.0196047568983011
Multiple Linear Regression - Residual Statistics
Residual Standard Deviation6.97393164813844
Sum Squared Residuals2820.8719127086


Multiple Linear Regression - Actuals, Interpolation, and Residuals
Time or IndexActualsInterpolationForecastResidualsPrediction Error
141.155.0487804878049-13.9487804878049
25855.04878048780492.95121951219513
36355.04878048780497.95121951219512
453.855.0487804878049-1.24878048780488
554.755.0487804878049-0.348780487804873
655.555.04878048780490.451219512195124
756.155.04878048780491.05121951219513
869.655.048780487804914.5512195121951
969.455.048780487804914.3512195121951
1057.255.04878048780492.15121951219513
116855.048780487804912.9512195121951
1253.355.0487804878049-1.74878048780488
1347.955.0487804878049-7.14878048780488
1460.855.04878048780495.75121951219512
1561.755.04878048780496.65121951219513
1657.855.04878048780492.75121951219512
1751.455.0487804878049-3.64878048780488
1850.555.0487804878049-4.54878048780488
1948.155.0487804878049-6.94878048780487
2058.755.04878048780493.65121951219513
215455.0487804878049-1.04878048780488
2256.155.04878048780491.05121951219513
2360.455.04878048780495.35121951219512
2451.255.0487804878049-3.84878048780487
2550.755.0487804878049-4.34878048780487
2656.455.04878048780491.35121951219512
2753.355.0487804878049-1.74878048780488
2852.655.0487804878049-2.44878048780487
2947.755.0487804878049-7.34878048780487
3049.555.0487804878049-5.54878048780488
3148.555.0487804878049-6.54878048780488
3255.355.04878048780490.251219512195121
3349.855.0487804878049-5.24878048780488
3457.455.04878048780492.35121951219512
3564.655.04878048780499.55121951219512
365355.0487804878049-2.04878048780488
3741.555.0487804878049-13.5487804878049
3855.955.04878048780490.851219512195123
3958.455.04878048780493.35121951219512
4053.555.0487804878049-1.54878048780488
4150.655.0487804878049-4.44878048780487
4258.559.6947368421053-1.19473684210526
4349.159.6947368421053-10.5947368421053
4461.159.69473684210531.40526315789474
4552.359.6947368421053-7.39473684210527
4658.459.6947368421053-1.29473684210526
4765.559.69473684210535.80526315789474
4861.759.69473684210532.00526315789474
4945.159.6947368421053-14.5947368421053
5052.159.6947368421053-7.59473684210526
5159.359.6947368421053-0.394736842105266
5257.959.6947368421053-1.79473684210526
534559.6947368421053-14.6947368421053
5464.959.69473684210535.20526315789474
5563.859.69473684210534.10526315789473
5669.459.69473684210539.70526315789474
5771.159.694736842105311.4052631578947
5862.959.69473684210533.20526315789474
5973.559.694736842105313.8052631578947
6062.659.69473684210532.90526315789474

\begin{tabular}{lllllllll}
\hline
Multiple Linear Regression - Actuals, Interpolation, and Residuals \tabularnewline
Time or Index & Actuals & InterpolationForecast & ResidualsPrediction Error \tabularnewline
1 & 41.1 & 55.0487804878049 & -13.9487804878049 \tabularnewline
2 & 58 & 55.0487804878049 & 2.95121951219513 \tabularnewline
3 & 63 & 55.0487804878049 & 7.95121951219512 \tabularnewline
4 & 53.8 & 55.0487804878049 & -1.24878048780488 \tabularnewline
5 & 54.7 & 55.0487804878049 & -0.348780487804873 \tabularnewline
6 & 55.5 & 55.0487804878049 & 0.451219512195124 \tabularnewline
7 & 56.1 & 55.0487804878049 & 1.05121951219513 \tabularnewline
8 & 69.6 & 55.0487804878049 & 14.5512195121951 \tabularnewline
9 & 69.4 & 55.0487804878049 & 14.3512195121951 \tabularnewline
10 & 57.2 & 55.0487804878049 & 2.15121951219513 \tabularnewline
11 & 68 & 55.0487804878049 & 12.9512195121951 \tabularnewline
12 & 53.3 & 55.0487804878049 & -1.74878048780488 \tabularnewline
13 & 47.9 & 55.0487804878049 & -7.14878048780488 \tabularnewline
14 & 60.8 & 55.0487804878049 & 5.75121951219512 \tabularnewline
15 & 61.7 & 55.0487804878049 & 6.65121951219513 \tabularnewline
16 & 57.8 & 55.0487804878049 & 2.75121951219512 \tabularnewline
17 & 51.4 & 55.0487804878049 & -3.64878048780488 \tabularnewline
18 & 50.5 & 55.0487804878049 & -4.54878048780488 \tabularnewline
19 & 48.1 & 55.0487804878049 & -6.94878048780487 \tabularnewline
20 & 58.7 & 55.0487804878049 & 3.65121951219513 \tabularnewline
21 & 54 & 55.0487804878049 & -1.04878048780488 \tabularnewline
22 & 56.1 & 55.0487804878049 & 1.05121951219513 \tabularnewline
23 & 60.4 & 55.0487804878049 & 5.35121951219512 \tabularnewline
24 & 51.2 & 55.0487804878049 & -3.84878048780487 \tabularnewline
25 & 50.7 & 55.0487804878049 & -4.34878048780487 \tabularnewline
26 & 56.4 & 55.0487804878049 & 1.35121951219512 \tabularnewline
27 & 53.3 & 55.0487804878049 & -1.74878048780488 \tabularnewline
28 & 52.6 & 55.0487804878049 & -2.44878048780487 \tabularnewline
29 & 47.7 & 55.0487804878049 & -7.34878048780487 \tabularnewline
30 & 49.5 & 55.0487804878049 & -5.54878048780488 \tabularnewline
31 & 48.5 & 55.0487804878049 & -6.54878048780488 \tabularnewline
32 & 55.3 & 55.0487804878049 & 0.251219512195121 \tabularnewline
33 & 49.8 & 55.0487804878049 & -5.24878048780488 \tabularnewline
34 & 57.4 & 55.0487804878049 & 2.35121951219512 \tabularnewline
35 & 64.6 & 55.0487804878049 & 9.55121951219512 \tabularnewline
36 & 53 & 55.0487804878049 & -2.04878048780488 \tabularnewline
37 & 41.5 & 55.0487804878049 & -13.5487804878049 \tabularnewline
38 & 55.9 & 55.0487804878049 & 0.851219512195123 \tabularnewline
39 & 58.4 & 55.0487804878049 & 3.35121951219512 \tabularnewline
40 & 53.5 & 55.0487804878049 & -1.54878048780488 \tabularnewline
41 & 50.6 & 55.0487804878049 & -4.44878048780487 \tabularnewline
42 & 58.5 & 59.6947368421053 & -1.19473684210526 \tabularnewline
43 & 49.1 & 59.6947368421053 & -10.5947368421053 \tabularnewline
44 & 61.1 & 59.6947368421053 & 1.40526315789474 \tabularnewline
45 & 52.3 & 59.6947368421053 & -7.39473684210527 \tabularnewline
46 & 58.4 & 59.6947368421053 & -1.29473684210526 \tabularnewline
47 & 65.5 & 59.6947368421053 & 5.80526315789474 \tabularnewline
48 & 61.7 & 59.6947368421053 & 2.00526315789474 \tabularnewline
49 & 45.1 & 59.6947368421053 & -14.5947368421053 \tabularnewline
50 & 52.1 & 59.6947368421053 & -7.59473684210526 \tabularnewline
51 & 59.3 & 59.6947368421053 & -0.394736842105266 \tabularnewline
52 & 57.9 & 59.6947368421053 & -1.79473684210526 \tabularnewline
53 & 45 & 59.6947368421053 & -14.6947368421053 \tabularnewline
54 & 64.9 & 59.6947368421053 & 5.20526315789474 \tabularnewline
55 & 63.8 & 59.6947368421053 & 4.10526315789473 \tabularnewline
56 & 69.4 & 59.6947368421053 & 9.70526315789474 \tabularnewline
57 & 71.1 & 59.6947368421053 & 11.4052631578947 \tabularnewline
58 & 62.9 & 59.6947368421053 & 3.20526315789474 \tabularnewline
59 & 73.5 & 59.6947368421053 & 13.8052631578947 \tabularnewline
60 & 62.6 & 59.6947368421053 & 2.90526315789474 \tabularnewline
\hline
\end{tabular}
%Source: https://freestatistics.org/blog/index.php?pk=25505&T=4

[TABLE]
[ROW][C]Multiple Linear Regression - Actuals, Interpolation, and Residuals[/C][/ROW]
[ROW][C]Time or Index[/C][C]Actuals[/C][C]InterpolationForecast[/C][C]ResidualsPrediction Error[/C][/ROW]
[ROW][C]1[/C][C]41.1[/C][C]55.0487804878049[/C][C]-13.9487804878049[/C][/ROW]
[ROW][C]2[/C][C]58[/C][C]55.0487804878049[/C][C]2.95121951219513[/C][/ROW]
[ROW][C]3[/C][C]63[/C][C]55.0487804878049[/C][C]7.95121951219512[/C][/ROW]
[ROW][C]4[/C][C]53.8[/C][C]55.0487804878049[/C][C]-1.24878048780488[/C][/ROW]
[ROW][C]5[/C][C]54.7[/C][C]55.0487804878049[/C][C]-0.348780487804873[/C][/ROW]
[ROW][C]6[/C][C]55.5[/C][C]55.0487804878049[/C][C]0.451219512195124[/C][/ROW]
[ROW][C]7[/C][C]56.1[/C][C]55.0487804878049[/C][C]1.05121951219513[/C][/ROW]
[ROW][C]8[/C][C]69.6[/C][C]55.0487804878049[/C][C]14.5512195121951[/C][/ROW]
[ROW][C]9[/C][C]69.4[/C][C]55.0487804878049[/C][C]14.3512195121951[/C][/ROW]
[ROW][C]10[/C][C]57.2[/C][C]55.0487804878049[/C][C]2.15121951219513[/C][/ROW]
[ROW][C]11[/C][C]68[/C][C]55.0487804878049[/C][C]12.9512195121951[/C][/ROW]
[ROW][C]12[/C][C]53.3[/C][C]55.0487804878049[/C][C]-1.74878048780488[/C][/ROW]
[ROW][C]13[/C][C]47.9[/C][C]55.0487804878049[/C][C]-7.14878048780488[/C][/ROW]
[ROW][C]14[/C][C]60.8[/C][C]55.0487804878049[/C][C]5.75121951219512[/C][/ROW]
[ROW][C]15[/C][C]61.7[/C][C]55.0487804878049[/C][C]6.65121951219513[/C][/ROW]
[ROW][C]16[/C][C]57.8[/C][C]55.0487804878049[/C][C]2.75121951219512[/C][/ROW]
[ROW][C]17[/C][C]51.4[/C][C]55.0487804878049[/C][C]-3.64878048780488[/C][/ROW]
[ROW][C]18[/C][C]50.5[/C][C]55.0487804878049[/C][C]-4.54878048780488[/C][/ROW]
[ROW][C]19[/C][C]48.1[/C][C]55.0487804878049[/C][C]-6.94878048780487[/C][/ROW]
[ROW][C]20[/C][C]58.7[/C][C]55.0487804878049[/C][C]3.65121951219513[/C][/ROW]
[ROW][C]21[/C][C]54[/C][C]55.0487804878049[/C][C]-1.04878048780488[/C][/ROW]
[ROW][C]22[/C][C]56.1[/C][C]55.0487804878049[/C][C]1.05121951219513[/C][/ROW]
[ROW][C]23[/C][C]60.4[/C][C]55.0487804878049[/C][C]5.35121951219512[/C][/ROW]
[ROW][C]24[/C][C]51.2[/C][C]55.0487804878049[/C][C]-3.84878048780487[/C][/ROW]
[ROW][C]25[/C][C]50.7[/C][C]55.0487804878049[/C][C]-4.34878048780487[/C][/ROW]
[ROW][C]26[/C][C]56.4[/C][C]55.0487804878049[/C][C]1.35121951219512[/C][/ROW]
[ROW][C]27[/C][C]53.3[/C][C]55.0487804878049[/C][C]-1.74878048780488[/C][/ROW]
[ROW][C]28[/C][C]52.6[/C][C]55.0487804878049[/C][C]-2.44878048780487[/C][/ROW]
[ROW][C]29[/C][C]47.7[/C][C]55.0487804878049[/C][C]-7.34878048780487[/C][/ROW]
[ROW][C]30[/C][C]49.5[/C][C]55.0487804878049[/C][C]-5.54878048780488[/C][/ROW]
[ROW][C]31[/C][C]48.5[/C][C]55.0487804878049[/C][C]-6.54878048780488[/C][/ROW]
[ROW][C]32[/C][C]55.3[/C][C]55.0487804878049[/C][C]0.251219512195121[/C][/ROW]
[ROW][C]33[/C][C]49.8[/C][C]55.0487804878049[/C][C]-5.24878048780488[/C][/ROW]
[ROW][C]34[/C][C]57.4[/C][C]55.0487804878049[/C][C]2.35121951219512[/C][/ROW]
[ROW][C]35[/C][C]64.6[/C][C]55.0487804878049[/C][C]9.55121951219512[/C][/ROW]
[ROW][C]36[/C][C]53[/C][C]55.0487804878049[/C][C]-2.04878048780488[/C][/ROW]
[ROW][C]37[/C][C]41.5[/C][C]55.0487804878049[/C][C]-13.5487804878049[/C][/ROW]
[ROW][C]38[/C][C]55.9[/C][C]55.0487804878049[/C][C]0.851219512195123[/C][/ROW]
[ROW][C]39[/C][C]58.4[/C][C]55.0487804878049[/C][C]3.35121951219512[/C][/ROW]
[ROW][C]40[/C][C]53.5[/C][C]55.0487804878049[/C][C]-1.54878048780488[/C][/ROW]
[ROW][C]41[/C][C]50.6[/C][C]55.0487804878049[/C][C]-4.44878048780487[/C][/ROW]
[ROW][C]42[/C][C]58.5[/C][C]59.6947368421053[/C][C]-1.19473684210526[/C][/ROW]
[ROW][C]43[/C][C]49.1[/C][C]59.6947368421053[/C][C]-10.5947368421053[/C][/ROW]
[ROW][C]44[/C][C]61.1[/C][C]59.6947368421053[/C][C]1.40526315789474[/C][/ROW]
[ROW][C]45[/C][C]52.3[/C][C]59.6947368421053[/C][C]-7.39473684210527[/C][/ROW]
[ROW][C]46[/C][C]58.4[/C][C]59.6947368421053[/C][C]-1.29473684210526[/C][/ROW]
[ROW][C]47[/C][C]65.5[/C][C]59.6947368421053[/C][C]5.80526315789474[/C][/ROW]
[ROW][C]48[/C][C]61.7[/C][C]59.6947368421053[/C][C]2.00526315789474[/C][/ROW]
[ROW][C]49[/C][C]45.1[/C][C]59.6947368421053[/C][C]-14.5947368421053[/C][/ROW]
[ROW][C]50[/C][C]52.1[/C][C]59.6947368421053[/C][C]-7.59473684210526[/C][/ROW]
[ROW][C]51[/C][C]59.3[/C][C]59.6947368421053[/C][C]-0.394736842105266[/C][/ROW]
[ROW][C]52[/C][C]57.9[/C][C]59.6947368421053[/C][C]-1.79473684210526[/C][/ROW]
[ROW][C]53[/C][C]45[/C][C]59.6947368421053[/C][C]-14.6947368421053[/C][/ROW]
[ROW][C]54[/C][C]64.9[/C][C]59.6947368421053[/C][C]5.20526315789474[/C][/ROW]
[ROW][C]55[/C][C]63.8[/C][C]59.6947368421053[/C][C]4.10526315789473[/C][/ROW]
[ROW][C]56[/C][C]69.4[/C][C]59.6947368421053[/C][C]9.70526315789474[/C][/ROW]
[ROW][C]57[/C][C]71.1[/C][C]59.6947368421053[/C][C]11.4052631578947[/C][/ROW]
[ROW][C]58[/C][C]62.9[/C][C]59.6947368421053[/C][C]3.20526315789474[/C][/ROW]
[ROW][C]59[/C][C]73.5[/C][C]59.6947368421053[/C][C]13.8052631578947[/C][/ROW]
[ROW][C]60[/C][C]62.6[/C][C]59.6947368421053[/C][C]2.90526315789474[/C][/ROW]
[/TABLE]
Source: https://freestatistics.org/blog/index.php?pk=25505&T=4

Globally Unique Identifier (entire table): ba.freestatistics.org/blog/index.php?pk=25505&T=4

As an alternative you can also use a QR Code:  

The GUIDs for individual cells are displayed in the table below:

Multiple Linear Regression - Actuals, Interpolation, and Residuals
Time or IndexActualsInterpolationForecastResidualsPrediction Error
141.155.0487804878049-13.9487804878049
25855.04878048780492.95121951219513
36355.04878048780497.95121951219512
453.855.0487804878049-1.24878048780488
554.755.0487804878049-0.348780487804873
655.555.04878048780490.451219512195124
756.155.04878048780491.05121951219513
869.655.048780487804914.5512195121951
969.455.048780487804914.3512195121951
1057.255.04878048780492.15121951219513
116855.048780487804912.9512195121951
1253.355.0487804878049-1.74878048780488
1347.955.0487804878049-7.14878048780488
1460.855.04878048780495.75121951219512
1561.755.04878048780496.65121951219513
1657.855.04878048780492.75121951219512
1751.455.0487804878049-3.64878048780488
1850.555.0487804878049-4.54878048780488
1948.155.0487804878049-6.94878048780487
2058.755.04878048780493.65121951219513
215455.0487804878049-1.04878048780488
2256.155.04878048780491.05121951219513
2360.455.04878048780495.35121951219512
2451.255.0487804878049-3.84878048780487
2550.755.0487804878049-4.34878048780487
2656.455.04878048780491.35121951219512
2753.355.0487804878049-1.74878048780488
2852.655.0487804878049-2.44878048780487
2947.755.0487804878049-7.34878048780487
3049.555.0487804878049-5.54878048780488
3148.555.0487804878049-6.54878048780488
3255.355.04878048780490.251219512195121
3349.855.0487804878049-5.24878048780488
3457.455.04878048780492.35121951219512
3564.655.04878048780499.55121951219512
365355.0487804878049-2.04878048780488
3741.555.0487804878049-13.5487804878049
3855.955.04878048780490.851219512195123
3958.455.04878048780493.35121951219512
4053.555.0487804878049-1.54878048780488
4150.655.0487804878049-4.44878048780487
4258.559.6947368421053-1.19473684210526
4349.159.6947368421053-10.5947368421053
4461.159.69473684210531.40526315789474
4552.359.6947368421053-7.39473684210527
4658.459.6947368421053-1.29473684210526
4765.559.69473684210535.80526315789474
4861.759.69473684210532.00526315789474
4945.159.6947368421053-14.5947368421053
5052.159.6947368421053-7.59473684210526
5159.359.6947368421053-0.394736842105266
5257.959.6947368421053-1.79473684210526
534559.6947368421053-14.6947368421053
5464.959.69473684210535.20526315789474
5563.859.69473684210534.10526315789473
5669.459.69473684210539.70526315789474
5771.159.694736842105311.4052631578947
5862.959.69473684210533.20526315789474
5973.559.694736842105313.8052631578947
6062.659.69473684210532.90526315789474


Parameters (Session):
par1 = 1 ; par2 = Do not include Seasonal Dummies ; par3 = No Linear Trend ;
Parameters (R input):
par1 = 1 ; par2 = Do not include Seasonal Dummies ; par3 = No Linear Trend ;
R code (references can be found in the software module):
library(lattice)
par1 <- as.numeric(par1)
x <- t(y)
k <- length(x[1,])
n <- length(x[,1])
x1 <- cbind(x[,par1], x[,1:k!=par1])
mycolnames <- c(colnames(x)[par1], colnames(x)[1:k!=par1])
colnames(x1) <- mycolnames #colnames(x)[par1]
x <- x1
if (par3 == 'First Differences'){
x2 <- array(0, dim=c(n-1,k), dimnames=list(1:(n-1), paste('(1-B)',colnames(x),sep='')))
for (i in 1:n-1) {
for (j in 1:k) {
x2[i,j] <- x[i+1,j] - x[i,j]
}
}
x <- x2
}
if (par2 == 'Include Monthly Dummies'){
x2 <- array(0, dim=c(n,11), dimnames=list(1:n, paste('M', seq(1:11), sep ='')))
for (i in 1:11){
x2[seq(i,n,12),i] <- 1
}
x <- cbind(x, x2)
}
if (par2 == 'Include Quarterly Dummies'){
x2 <- array(0, dim=c(n,3), dimnames=list(1:n, paste('Q', seq(1:3), sep ='')))
for (i in 1:3){
x2[seq(i,n,4),i] <- 1
}
x <- cbind(x, x2)
}
k <- length(x[1,])
if (par3 == 'Linear Trend'){
x <- cbind(x, c(1:n))
colnames(x)[k+1] <- 't'
}
x
k <- length(x[1,])
df <- as.data.frame(x)
(mylm <- lm(df))
(mysum <- summary(mylm))
bitmap(file='test0.png')
plot(x[,1], type='l', main='Actuals and Interpolation', ylab='value of Actuals and Interpolation (dots)', xlab='time or index')
points(x[,1]-mysum$resid)
grid()
dev.off()
bitmap(file='test1.png')
plot(mysum$resid, type='b', pch=19, main='Residuals', ylab='value of Residuals', xlab='time or index')
grid()
dev.off()
bitmap(file='test2.png')
hist(mysum$resid, main='Residual Histogram', xlab='values of Residuals')
grid()
dev.off()
bitmap(file='test3.png')
densityplot(~mysum$resid,col='black',main='Residual Density Plot', xlab='values of Residuals')
dev.off()
bitmap(file='test4.png')
qqnorm(mysum$resid, main='Residual Normal Q-Q Plot')
grid()
dev.off()
(myerror <- as.ts(mysum$resid))
bitmap(file='test5.png')
dum <- cbind(lag(myerror,k=1),myerror)
dum
dum1 <- dum[2:length(myerror),]
dum1
z <- as.data.frame(dum1)
z
plot(z,main=paste('Residual Lag plot, lowess, and regression line'), ylab='values of Residuals', xlab='lagged values of Residuals')
lines(lowess(z))
abline(lm(z))
grid()
dev.off()
bitmap(file='test6.png')
acf(mysum$resid, lag.max=length(mysum$resid)/2, main='Residual Autocorrelation Function')
grid()
dev.off()
bitmap(file='test7.png')
pacf(mysum$resid, lag.max=length(mysum$resid)/2, main='Residual Partial Autocorrelation Function')
grid()
dev.off()
bitmap(file='test8.png')
opar <- par(mfrow = c(2,2), oma = c(0, 0, 1.1, 0))
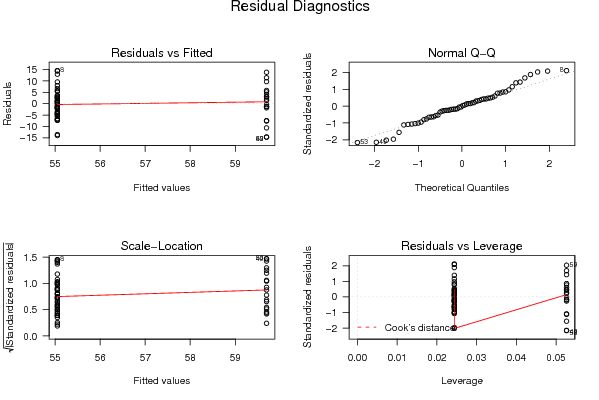
plot(mylm, las = 1, sub='Residual Diagnostics')
par(opar)
dev.off()
load(file='createtable')
a<-table.start()
a<-table.row.start(a)
a<-table.element(a, 'Multiple Linear Regression - Estimated Regression Equation', 1, TRUE)
a<-table.row.end(a)
myeq <- colnames(x)[1]
myeq <- paste(myeq, '[t] = ', sep='')
for (i in 1:k){
if (mysum$coefficients[i,1] > 0) myeq <- paste(myeq, '+', '')
myeq <- paste(myeq, mysum$coefficients[i,1], sep=' ')
if (rownames(mysum$coefficients)[i] != '(Intercept)') {
myeq <- paste(myeq, rownames(mysum$coefficients)[i], sep='')
if (rownames(mysum$coefficients)[i] != 't') myeq <- paste(myeq, '[t]', sep='')
}
}
myeq <- paste(myeq, ' + e[t]')
a<-table.row.start(a)
a<-table.element(a, myeq)
a<-table.row.end(a)
a<-table.end(a)
table.save(a,file='mytable1.tab')
a<-table.start()
a<-table.row.start(a)
a<-table.element(a,hyperlink('ols1.htm','Multiple Linear Regression - Ordinary Least Squares',''), 6, TRUE)
a<-table.row.end(a)
a<-table.row.start(a)
a<-table.element(a,'Variable',header=TRUE)
a<-table.element(a,'Parameter',header=TRUE)
a<-table.element(a,'S.D.',header=TRUE)
a<-table.element(a,'T-STAT
H0: parameter = 0',header=TRUE)
a<-table.element(a,'2-tail p-value',header=TRUE)
a<-table.element(a,'1-tail p-value',header=TRUE)
a<-table.row.end(a)
for (i in 1:k){
a<-table.row.start(a)
a<-table.element(a,rownames(mysum$coefficients)[i],header=TRUE)
a<-table.element(a,mysum$coefficients[i,1])
a<-table.element(a, round(mysum$coefficients[i,2],6))
a<-table.element(a, round(mysum$coefficients[i,3],4))
a<-table.element(a, round(mysum$coefficients[i,4],6))
a<-table.element(a, round(mysum$coefficients[i,4]/2,6))
a<-table.row.end(a)
}
a<-table.end(a)
table.save(a,file='mytable2.tab')
a<-table.start()
a<-table.row.start(a)
a<-table.element(a, 'Multiple Linear Regression - Regression Statistics', 2, TRUE)
a<-table.row.end(a)
a<-table.row.start(a)
a<-table.element(a, 'Multiple R',1,TRUE)
a<-table.element(a, sqrt(mysum$r.squared))
a<-table.row.end(a)
a<-table.row.start(a)
a<-table.element(a, 'R-squared',1,TRUE)
a<-table.element(a, mysum$r.squared)
a<-table.row.end(a)
a<-table.row.start(a)
a<-table.element(a, 'Adjusted R-squared',1,TRUE)
a<-table.element(a, mysum$adj.r.squared)
a<-table.row.end(a)
a<-table.row.start(a)
a<-table.element(a, 'F-TEST (value)',1,TRUE)
a<-table.element(a, mysum$fstatistic[1])
a<-table.row.end(a)
a<-table.row.start(a)
a<-table.element(a, 'F-TEST (DF numerator)',1,TRUE)
a<-table.element(a, mysum$fstatistic[2])
a<-table.row.end(a)
a<-table.row.start(a)
a<-table.element(a, 'F-TEST (DF denominator)',1,TRUE)
a<-table.element(a, mysum$fstatistic[3])
a<-table.row.end(a)
a<-table.row.start(a)
a<-table.element(a, 'p-value',1,TRUE)
a<-table.element(a, 1-pf(mysum$fstatistic[1],mysum$fstatistic[2],mysum$fstatistic[3]))
a<-table.row.end(a)
a<-table.row.start(a)
a<-table.element(a, 'Multiple Linear Regression - Residual Statistics', 2, TRUE)
a<-table.row.end(a)
a<-table.row.start(a)
a<-table.element(a, 'Residual Standard Deviation',1,TRUE)
a<-table.element(a, mysum$sigma)
a<-table.row.end(a)
a<-table.row.start(a)
a<-table.element(a, 'Sum Squared Residuals',1,TRUE)
a<-table.element(a, sum(myerror*myerror))
a<-table.row.end(a)
a<-table.end(a)
table.save(a,file='mytable3.tab')
a<-table.start()
a<-table.row.start(a)
a<-table.element(a, 'Multiple Linear Regression - Actuals, Interpolation, and Residuals', 4, TRUE)
a<-table.row.end(a)
a<-table.row.start(a)
a<-table.element(a, 'Time or Index', 1, TRUE)
a<-table.element(a, 'Actuals', 1, TRUE)
a<-table.element(a, 'Interpolation
Forecast', 1, TRUE)
a<-table.element(a, 'Residuals
Prediction Error', 1, TRUE)
a<-table.row.end(a)
for (i in 1:n) {
a<-table.row.start(a)
a<-table.element(a,i, 1, TRUE)
a<-table.element(a,x[i])
a<-table.element(a,x[i]-mysum$resid[i])
a<-table.element(a,mysum$resid[i])
a<-table.row.end(a)
}
a<-table.end(a)
table.save(a,file='mytable4.tab')