Free Statistics

of Irreproducible Research!

Author's title

Author*The author of this computation has been verified*
R Software Modulerwasp_multipleregression.wasp
Title produced by softwareMultiple Regression
Date of computationMon, 24 Nov 2008 12:46:22 -0700
Cite this page as followsStatistical Computations at FreeStatistics.org, Office for Research Development and Education, URL https://freestatistics.org/blog/index.php?v=date/2008/Nov/24/t1227556036k9x7pnpwwdd9yjr.htm/, Retrieved Tue, 14 May 2024 23:17:19 +0000
Statistical Computations at FreeStatistics.org, Office for Research Development and Education, URL https://freestatistics.org/blog/index.php?pk=25501, Retrieved Tue, 14 May 2024 23:17:19 +0000
QR Codes:

Original text written by user:
IsPrivate?No (this computation is public)
User-defined keywords
Estimated Impact150
Family? (F = Feedback message, R = changed R code, M = changed R Module, P = changed Parameters, D = changed Data)
F     [Multiple Regression] [] [2007-11-19 19:55:31] [b731da8b544846036771bbf9bf2f34ce]
F    D    [Multiple Regression] [] [2008-11-24 19:46:22] [357d3e8a0ea9b107f483347f947dfe8f] [Current]
-   P       [Multiple Regression] [] [2008-12-01 10:00:48] [2a0ad3a9bcadca2da0acb91636601c6c]
Feedback Forum
2008-11-28 16:48:05 [Kim Wester] [reply
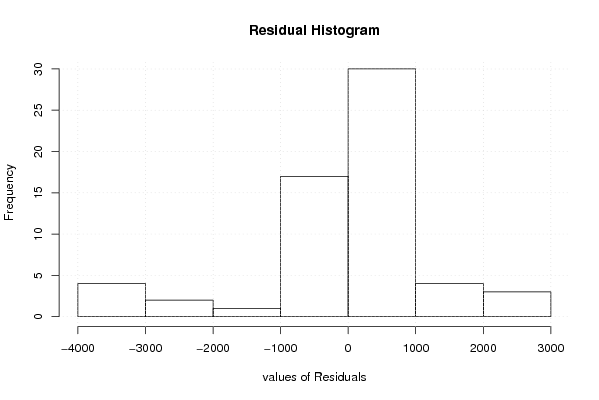
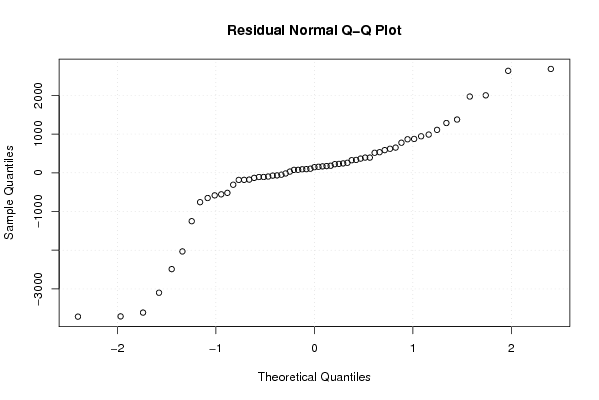
Het is onduidelijk op welke reeksen het model betrekking heeft. Werkloosheid in België, inflatie of goudprijs? De dummy is niet realistisch maar volstaat. De student analyseert de grafieken voldoende. De density plot weergeeft géén normaalverdeling. Er is geen sprake van een vloeiende lijn.
2008-12-01 09:22:14 [Hidde Van Kerckhoven] [reply
Ik ben het niet direct eens met deze uitspraak, de reeksen staan in mijn document bijgevoegd, had de student moeite gedaan was het echt niet zo moeilijk geweest de reeks te achterhalen. ik citeer uit mijn document 'We kunnen 76% van de goudkoersschommeling verklaren, we kunnen dus van een goed model uitgaan. We kunnen dus uitgaan van een vrij goed model, dat de realiteit best goed vertegenwoordigt. De overige 24% valt misschien te verklaren door speculatie op de goudkoers… ' Ik denk dat het best duidelijk is dat ik hier de goudprijs verklaard heb...
Met vriendelijke groeten

Post a new message
Dataseries X:
10511 0
10812 0
10738 0
10171 0
9721 0
9897 0
9828 0
9924 0
10371 0
10846 0
10413 0
10709 0
10662 0
10570 0
10297 0
10635 0
10872 0
10296 0
10383 0
10431 0
10574 0
10653 0
10805 0
10872 0
10625 0
10407 0
10463 0
10556 0
10646 0
10702 0
11353 1
11346 1
11451 1
11964 1
12574 1
13031 1
13812 1
14544 1
14931 1
14886 1
16005 1
17064 1
15168 1
16050 1
15839 1
15137 1
14954 1
15648 1
15305 1
15579 1
16348 1
15928 1
16171 1
15937 1
15713 1
15594 1
15683 1
16438 1
17032 1
17696 1
17745 1


Summary of computational transaction
Raw Inputview raw input (R code)
Raw Outputview raw output of R engine
Computing time3 seconds
R Server'George Udny Yule' @ 72.249.76.132

\begin{tabular}{lllllllll}
\hline
Summary of computational transaction \tabularnewline
Raw Input & view raw input (R code)  \tabularnewline
Raw Output & view raw output of R engine  \tabularnewline
Computing time & 3 seconds \tabularnewline
R Server & 'George Udny Yule' @ 72.249.76.132 \tabularnewline
\hline
\end{tabular}
%Source: https://freestatistics.org/blog/index.php?pk=25501&T=0

[TABLE]
[ROW][C]Summary of computational transaction[/C][/ROW]
[ROW][C]Raw Input[/C][C]view raw input (R code) [/C][/ROW]
[ROW][C]Raw Output[/C][C]view raw output of R engine [/C][/ROW]
[ROW][C]Computing time[/C][C]3 seconds[/C][/ROW]
[ROW][C]R Server[/C][C]'George Udny Yule' @ 72.249.76.132[/C][/ROW]
[/TABLE]
Source: https://freestatistics.org/blog/index.php?pk=25501&T=0

Globally Unique Identifier (entire table): ba.freestatistics.org/blog/index.php?pk=25501&T=0

As an alternative you can also use a QR Code:  

The GUIDs for individual cells are displayed in the table below:

Summary of computational transaction
Raw Inputview raw input (R code)
Raw Outputview raw output of R engine
Computing time3 seconds
R Server'George Udny Yule' @ 72.249.76.132


Multiple Linear Regression - Estimated Regression Equation
y[t] = + 10479.6666666667 + 4582.4623655914x[t] + e[t]

\begin{tabular}{lllllllll}
\hline
Multiple Linear Regression - Estimated Regression Equation \tabularnewline
y[t] =  +  10479.6666666667 +  4582.4623655914x[t]  + e[t] \tabularnewline
\hline
\end{tabular}
%Source: https://freestatistics.org/blog/index.php?pk=25501&T=1

[TABLE]
[ROW][C]Multiple Linear Regression - Estimated Regression Equation[/C][/ROW]
[ROW][C]y[t] =  +  10479.6666666667 +  4582.4623655914x[t]  + e[t][/C][/ROW]
[/TABLE]
Source: https://freestatistics.org/blog/index.php?pk=25501&T=1

Globally Unique Identifier (entire table): ba.freestatistics.org/blog/index.php?pk=25501&T=1

As an alternative you can also use a QR Code:  

The GUIDs for individual cells are displayed in the table below:

Multiple Linear Regression - Estimated Regression Equation
y[t] = + 10479.6666666667 + 4582.4623655914x[t] + e[t]


Multiple Linear Regression - Ordinary Least Squares
VariableParameterS.D.T-STATH0: parameter = 02-tail p-value1-tail p-value
(Intercept)10479.6666666667235.06909944.581200
x4582.4623655914329.74605913.896900

\begin{tabular}{lllllllll}
\hline
Multiple Linear Regression - Ordinary Least Squares \tabularnewline
Variable & Parameter & S.D. & T-STATH0: parameter = 0 & 2-tail p-value & 1-tail p-value \tabularnewline
(Intercept) & 10479.6666666667 & 235.069099 & 44.5812 & 0 & 0 \tabularnewline
x & 4582.4623655914 & 329.746059 & 13.8969 & 0 & 0 \tabularnewline
\hline
\end{tabular}
%Source: https://freestatistics.org/blog/index.php?pk=25501&T=2

[TABLE]
[ROW][C]Multiple Linear Regression - Ordinary Least Squares[/C][/ROW]
[ROW][C]Variable[/C][C]Parameter[/C][C]S.D.[/C][C]T-STATH0: parameter = 0[/C][C]2-tail p-value[/C][C]1-tail p-value[/C][/ROW]
[ROW][C](Intercept)[/C][C]10479.6666666667[/C][C]235.069099[/C][C]44.5812[/C][C]0[/C][C]0[/C][/ROW]
[ROW][C]x[/C][C]4582.4623655914[/C][C]329.746059[/C][C]13.8969[/C][C]0[/C][C]0[/C][/ROW]
[/TABLE]
Source: https://freestatistics.org/blog/index.php?pk=25501&T=2

Globally Unique Identifier (entire table): ba.freestatistics.org/blog/index.php?pk=25501&T=2

As an alternative you can also use a QR Code:  

The GUIDs for individual cells are displayed in the table below:

Multiple Linear Regression - Ordinary Least Squares
VariableParameterS.D.T-STATH0: parameter = 02-tail p-value1-tail p-value
(Intercept)10479.6666666667235.06909944.581200
x4582.4623655914329.74605913.896900


Multiple Linear Regression - Regression Statistics
Multiple R0.875208049327808
R-squared0.765989129608187
Adjusted R-squared0.762022843669343
F-TEST (value)193.125039752274
F-TEST (DF numerator)1
F-TEST (DF denominator)59
p-value0
Multiple Linear Regression - Residual Statistics
Residual Standard Deviation1287.52648253519
Sum Squared Residuals97805742.1505376

\begin{tabular}{lllllllll}
\hline
Multiple Linear Regression - Regression Statistics \tabularnewline
Multiple R & 0.875208049327808 \tabularnewline
R-squared & 0.765989129608187 \tabularnewline
Adjusted R-squared & 0.762022843669343 \tabularnewline
F-TEST (value) & 193.125039752274 \tabularnewline
F-TEST (DF numerator) & 1 \tabularnewline
F-TEST (DF denominator) & 59 \tabularnewline
p-value & 0 \tabularnewline
Multiple Linear Regression - Residual Statistics \tabularnewline
Residual Standard Deviation & 1287.52648253519 \tabularnewline
Sum Squared Residuals & 97805742.1505376 \tabularnewline
\hline
\end{tabular}
%Source: https://freestatistics.org/blog/index.php?pk=25501&T=3

[TABLE]
[ROW][C]Multiple Linear Regression - Regression Statistics[/C][/ROW]
[ROW][C]Multiple R[/C][C]0.875208049327808[/C][/ROW]
[ROW][C]R-squared[/C][C]0.765989129608187[/C][/ROW]
[ROW][C]Adjusted R-squared[/C][C]0.762022843669343[/C][/ROW]
[ROW][C]F-TEST (value)[/C][C]193.125039752274[/C][/ROW]
[ROW][C]F-TEST (DF numerator)[/C][C]1[/C][/ROW]
[ROW][C]F-TEST (DF denominator)[/C][C]59[/C][/ROW]
[ROW][C]p-value[/C][C]0[/C][/ROW]
[ROW][C]Multiple Linear Regression - Residual Statistics[/C][/ROW]
[ROW][C]Residual Standard Deviation[/C][C]1287.52648253519[/C][/ROW]
[ROW][C]Sum Squared Residuals[/C][C]97805742.1505376[/C][/ROW]
[/TABLE]
Source: https://freestatistics.org/blog/index.php?pk=25501&T=3

Globally Unique Identifier (entire table): ba.freestatistics.org/blog/index.php?pk=25501&T=3

As an alternative you can also use a QR Code:  

The GUIDs for individual cells are displayed in the table below:

Multiple Linear Regression - Regression Statistics
Multiple R0.875208049327808
R-squared0.765989129608187
Adjusted R-squared0.762022843669343
F-TEST (value)193.125039752274
F-TEST (DF numerator)1
F-TEST (DF denominator)59
p-value0
Multiple Linear Regression - Residual Statistics
Residual Standard Deviation1287.52648253519
Sum Squared Residuals97805742.1505376


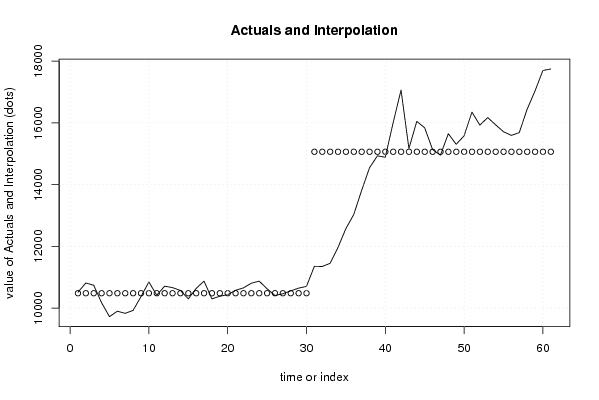
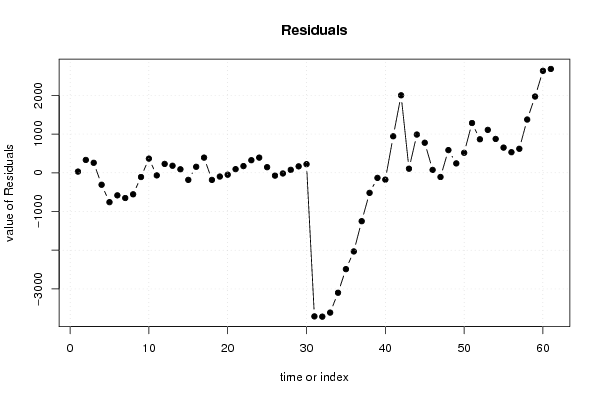
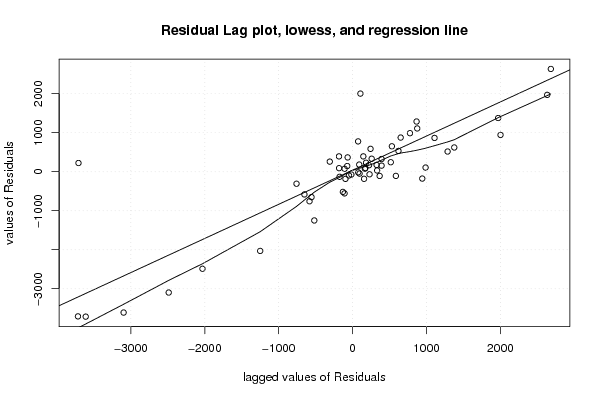
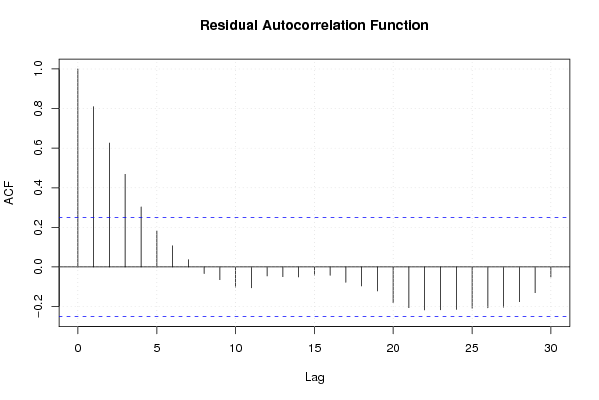
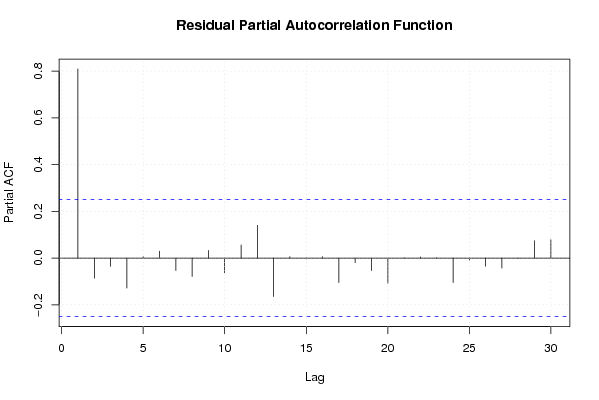
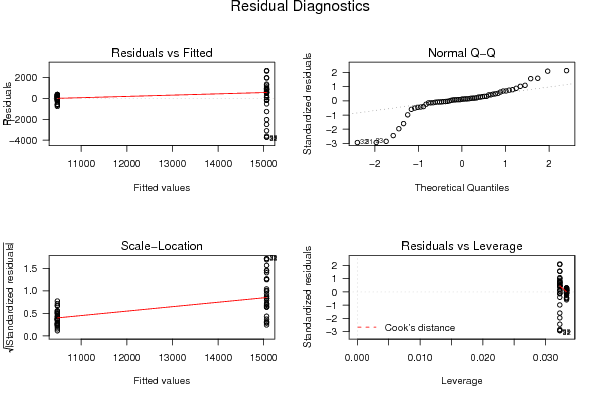
Multiple Linear Regression - Actuals, Interpolation, and Residuals
Time or IndexActualsInterpolationForecastResidualsPrediction Error
11051110479.666666666731.3333333333172
21081210479.6666666667332.333333333343
31073810479.6666666667258.333333333334
41017110479.6666666667-308.666666666666
5972110479.6666666667-758.666666666666
6989710479.6666666667-582.666666666666
7982810479.6666666667-651.666666666666
8992410479.6666666667-555.666666666666
91037110479.6666666667-108.666666666666
101084610479.6666666667366.333333333334
111041310479.6666666667-66.6666666666663
121070910479.6666666667229.333333333334
131066210479.6666666667182.333333333334
141057010479.666666666790.3333333333337
151029710479.6666666667-182.666666666666
161063510479.6666666667155.333333333334
171087210479.6666666667392.333333333334
181029610479.6666666667-183.666666666666
191038310479.6666666667-96.6666666666663
201043110479.6666666667-48.6666666666663
211057410479.666666666794.3333333333337
221065310479.6666666667173.333333333334
231080510479.6666666667325.333333333334
241087210479.6666666667392.333333333334
251062510479.6666666667145.333333333334
261040710479.6666666667-72.6666666666663
271046310479.6666666667-16.6666666666663
281055610479.666666666776.3333333333337
291064610479.6666666667166.333333333334
301070210479.6666666667222.333333333334
311135315062.1290322581-3709.12903225806
321134615062.1290322581-3716.12903225806
331145115062.1290322581-3611.12903225806
341196415062.1290322581-3098.12903225806
351257415062.1290322581-2488.12903225806
361303115062.1290322581-2031.12903225806
371381215062.1290322581-1250.12903225806
381454415062.1290322581-518.129032258065
391493115062.1290322581-131.129032258065
401488615062.1290322581-176.129032258065
411600515062.1290322581942.870967741935
421706415062.12903225812001.87096774194
431516815062.1290322581105.870967741935
441605015062.1290322581987.870967741935
451583915062.1290322581776.870967741935
461513715062.129032258174.8709677419354
471495415062.1290322581-108.129032258065
481564815062.1290322581585.870967741935
491530515062.1290322581242.870967741935
501557915062.1290322581516.870967741935
511634815062.12903225811285.87096774194
521592815062.1290322581865.870967741935
531617115062.12903225811108.87096774194
541593715062.1290322581874.870967741935
551571315062.1290322581650.870967741935
561559415062.1290322581531.870967741935
571568315062.1290322581620.870967741935
581643815062.12903225811375.87096774194
591703215062.12903225811969.87096774194
601769615062.12903225812633.87096774194
611774515062.12903225812682.87096774194

\begin{tabular}{lllllllll}
\hline
Multiple Linear Regression - Actuals, Interpolation, and Residuals \tabularnewline
Time or Index & Actuals & InterpolationForecast & ResidualsPrediction Error \tabularnewline
1 & 10511 & 10479.6666666667 & 31.3333333333172 \tabularnewline
2 & 10812 & 10479.6666666667 & 332.333333333343 \tabularnewline
3 & 10738 & 10479.6666666667 & 258.333333333334 \tabularnewline
4 & 10171 & 10479.6666666667 & -308.666666666666 \tabularnewline
5 & 9721 & 10479.6666666667 & -758.666666666666 \tabularnewline
6 & 9897 & 10479.6666666667 & -582.666666666666 \tabularnewline
7 & 9828 & 10479.6666666667 & -651.666666666666 \tabularnewline
8 & 9924 & 10479.6666666667 & -555.666666666666 \tabularnewline
9 & 10371 & 10479.6666666667 & -108.666666666666 \tabularnewline
10 & 10846 & 10479.6666666667 & 366.333333333334 \tabularnewline
11 & 10413 & 10479.6666666667 & -66.6666666666663 \tabularnewline
12 & 10709 & 10479.6666666667 & 229.333333333334 \tabularnewline
13 & 10662 & 10479.6666666667 & 182.333333333334 \tabularnewline
14 & 10570 & 10479.6666666667 & 90.3333333333337 \tabularnewline
15 & 10297 & 10479.6666666667 & -182.666666666666 \tabularnewline
16 & 10635 & 10479.6666666667 & 155.333333333334 \tabularnewline
17 & 10872 & 10479.6666666667 & 392.333333333334 \tabularnewline
18 & 10296 & 10479.6666666667 & -183.666666666666 \tabularnewline
19 & 10383 & 10479.6666666667 & -96.6666666666663 \tabularnewline
20 & 10431 & 10479.6666666667 & -48.6666666666663 \tabularnewline
21 & 10574 & 10479.6666666667 & 94.3333333333337 \tabularnewline
22 & 10653 & 10479.6666666667 & 173.333333333334 \tabularnewline
23 & 10805 & 10479.6666666667 & 325.333333333334 \tabularnewline
24 & 10872 & 10479.6666666667 & 392.333333333334 \tabularnewline
25 & 10625 & 10479.6666666667 & 145.333333333334 \tabularnewline
26 & 10407 & 10479.6666666667 & -72.6666666666663 \tabularnewline
27 & 10463 & 10479.6666666667 & -16.6666666666663 \tabularnewline
28 & 10556 & 10479.6666666667 & 76.3333333333337 \tabularnewline
29 & 10646 & 10479.6666666667 & 166.333333333334 \tabularnewline
30 & 10702 & 10479.6666666667 & 222.333333333334 \tabularnewline
31 & 11353 & 15062.1290322581 & -3709.12903225806 \tabularnewline
32 & 11346 & 15062.1290322581 & -3716.12903225806 \tabularnewline
33 & 11451 & 15062.1290322581 & -3611.12903225806 \tabularnewline
34 & 11964 & 15062.1290322581 & -3098.12903225806 \tabularnewline
35 & 12574 & 15062.1290322581 & -2488.12903225806 \tabularnewline
36 & 13031 & 15062.1290322581 & -2031.12903225806 \tabularnewline
37 & 13812 & 15062.1290322581 & -1250.12903225806 \tabularnewline
38 & 14544 & 15062.1290322581 & -518.129032258065 \tabularnewline
39 & 14931 & 15062.1290322581 & -131.129032258065 \tabularnewline
40 & 14886 & 15062.1290322581 & -176.129032258065 \tabularnewline
41 & 16005 & 15062.1290322581 & 942.870967741935 \tabularnewline
42 & 17064 & 15062.1290322581 & 2001.87096774194 \tabularnewline
43 & 15168 & 15062.1290322581 & 105.870967741935 \tabularnewline
44 & 16050 & 15062.1290322581 & 987.870967741935 \tabularnewline
45 & 15839 & 15062.1290322581 & 776.870967741935 \tabularnewline
46 & 15137 & 15062.1290322581 & 74.8709677419354 \tabularnewline
47 & 14954 & 15062.1290322581 & -108.129032258065 \tabularnewline
48 & 15648 & 15062.1290322581 & 585.870967741935 \tabularnewline
49 & 15305 & 15062.1290322581 & 242.870967741935 \tabularnewline
50 & 15579 & 15062.1290322581 & 516.870967741935 \tabularnewline
51 & 16348 & 15062.1290322581 & 1285.87096774194 \tabularnewline
52 & 15928 & 15062.1290322581 & 865.870967741935 \tabularnewline
53 & 16171 & 15062.1290322581 & 1108.87096774194 \tabularnewline
54 & 15937 & 15062.1290322581 & 874.870967741935 \tabularnewline
55 & 15713 & 15062.1290322581 & 650.870967741935 \tabularnewline
56 & 15594 & 15062.1290322581 & 531.870967741935 \tabularnewline
57 & 15683 & 15062.1290322581 & 620.870967741935 \tabularnewline
58 & 16438 & 15062.1290322581 & 1375.87096774194 \tabularnewline
59 & 17032 & 15062.1290322581 & 1969.87096774194 \tabularnewline
60 & 17696 & 15062.1290322581 & 2633.87096774194 \tabularnewline
61 & 17745 & 15062.1290322581 & 2682.87096774194 \tabularnewline
\hline
\end{tabular}
%Source: https://freestatistics.org/blog/index.php?pk=25501&T=4

[TABLE]
[ROW][C]Multiple Linear Regression - Actuals, Interpolation, and Residuals[/C][/ROW]
[ROW][C]Time or Index[/C][C]Actuals[/C][C]InterpolationForecast[/C][C]ResidualsPrediction Error[/C][/ROW]
[ROW][C]1[/C][C]10511[/C][C]10479.6666666667[/C][C]31.3333333333172[/C][/ROW]
[ROW][C]2[/C][C]10812[/C][C]10479.6666666667[/C][C]332.333333333343[/C][/ROW]
[ROW][C]3[/C][C]10738[/C][C]10479.6666666667[/C][C]258.333333333334[/C][/ROW]
[ROW][C]4[/C][C]10171[/C][C]10479.6666666667[/C][C]-308.666666666666[/C][/ROW]
[ROW][C]5[/C][C]9721[/C][C]10479.6666666667[/C][C]-758.666666666666[/C][/ROW]
[ROW][C]6[/C][C]9897[/C][C]10479.6666666667[/C][C]-582.666666666666[/C][/ROW]
[ROW][C]7[/C][C]9828[/C][C]10479.6666666667[/C][C]-651.666666666666[/C][/ROW]
[ROW][C]8[/C][C]9924[/C][C]10479.6666666667[/C][C]-555.666666666666[/C][/ROW]
[ROW][C]9[/C][C]10371[/C][C]10479.6666666667[/C][C]-108.666666666666[/C][/ROW]
[ROW][C]10[/C][C]10846[/C][C]10479.6666666667[/C][C]366.333333333334[/C][/ROW]
[ROW][C]11[/C][C]10413[/C][C]10479.6666666667[/C][C]-66.6666666666663[/C][/ROW]
[ROW][C]12[/C][C]10709[/C][C]10479.6666666667[/C][C]229.333333333334[/C][/ROW]
[ROW][C]13[/C][C]10662[/C][C]10479.6666666667[/C][C]182.333333333334[/C][/ROW]
[ROW][C]14[/C][C]10570[/C][C]10479.6666666667[/C][C]90.3333333333337[/C][/ROW]
[ROW][C]15[/C][C]10297[/C][C]10479.6666666667[/C][C]-182.666666666666[/C][/ROW]
[ROW][C]16[/C][C]10635[/C][C]10479.6666666667[/C][C]155.333333333334[/C][/ROW]
[ROW][C]17[/C][C]10872[/C][C]10479.6666666667[/C][C]392.333333333334[/C][/ROW]
[ROW][C]18[/C][C]10296[/C][C]10479.6666666667[/C][C]-183.666666666666[/C][/ROW]
[ROW][C]19[/C][C]10383[/C][C]10479.6666666667[/C][C]-96.6666666666663[/C][/ROW]
[ROW][C]20[/C][C]10431[/C][C]10479.6666666667[/C][C]-48.6666666666663[/C][/ROW]
[ROW][C]21[/C][C]10574[/C][C]10479.6666666667[/C][C]94.3333333333337[/C][/ROW]
[ROW][C]22[/C][C]10653[/C][C]10479.6666666667[/C][C]173.333333333334[/C][/ROW]
[ROW][C]23[/C][C]10805[/C][C]10479.6666666667[/C][C]325.333333333334[/C][/ROW]
[ROW][C]24[/C][C]10872[/C][C]10479.6666666667[/C][C]392.333333333334[/C][/ROW]
[ROW][C]25[/C][C]10625[/C][C]10479.6666666667[/C][C]145.333333333334[/C][/ROW]
[ROW][C]26[/C][C]10407[/C][C]10479.6666666667[/C][C]-72.6666666666663[/C][/ROW]
[ROW][C]27[/C][C]10463[/C][C]10479.6666666667[/C][C]-16.6666666666663[/C][/ROW]
[ROW][C]28[/C][C]10556[/C][C]10479.6666666667[/C][C]76.3333333333337[/C][/ROW]
[ROW][C]29[/C][C]10646[/C][C]10479.6666666667[/C][C]166.333333333334[/C][/ROW]
[ROW][C]30[/C][C]10702[/C][C]10479.6666666667[/C][C]222.333333333334[/C][/ROW]
[ROW][C]31[/C][C]11353[/C][C]15062.1290322581[/C][C]-3709.12903225806[/C][/ROW]
[ROW][C]32[/C][C]11346[/C][C]15062.1290322581[/C][C]-3716.12903225806[/C][/ROW]
[ROW][C]33[/C][C]11451[/C][C]15062.1290322581[/C][C]-3611.12903225806[/C][/ROW]
[ROW][C]34[/C][C]11964[/C][C]15062.1290322581[/C][C]-3098.12903225806[/C][/ROW]
[ROW][C]35[/C][C]12574[/C][C]15062.1290322581[/C][C]-2488.12903225806[/C][/ROW]
[ROW][C]36[/C][C]13031[/C][C]15062.1290322581[/C][C]-2031.12903225806[/C][/ROW]
[ROW][C]37[/C][C]13812[/C][C]15062.1290322581[/C][C]-1250.12903225806[/C][/ROW]
[ROW][C]38[/C][C]14544[/C][C]15062.1290322581[/C][C]-518.129032258065[/C][/ROW]
[ROW][C]39[/C][C]14931[/C][C]15062.1290322581[/C][C]-131.129032258065[/C][/ROW]
[ROW][C]40[/C][C]14886[/C][C]15062.1290322581[/C][C]-176.129032258065[/C][/ROW]
[ROW][C]41[/C][C]16005[/C][C]15062.1290322581[/C][C]942.870967741935[/C][/ROW]
[ROW][C]42[/C][C]17064[/C][C]15062.1290322581[/C][C]2001.87096774194[/C][/ROW]
[ROW][C]43[/C][C]15168[/C][C]15062.1290322581[/C][C]105.870967741935[/C][/ROW]
[ROW][C]44[/C][C]16050[/C][C]15062.1290322581[/C][C]987.870967741935[/C][/ROW]
[ROW][C]45[/C][C]15839[/C][C]15062.1290322581[/C][C]776.870967741935[/C][/ROW]
[ROW][C]46[/C][C]15137[/C][C]15062.1290322581[/C][C]74.8709677419354[/C][/ROW]
[ROW][C]47[/C][C]14954[/C][C]15062.1290322581[/C][C]-108.129032258065[/C][/ROW]
[ROW][C]48[/C][C]15648[/C][C]15062.1290322581[/C][C]585.870967741935[/C][/ROW]
[ROW][C]49[/C][C]15305[/C][C]15062.1290322581[/C][C]242.870967741935[/C][/ROW]
[ROW][C]50[/C][C]15579[/C][C]15062.1290322581[/C][C]516.870967741935[/C][/ROW]
[ROW][C]51[/C][C]16348[/C][C]15062.1290322581[/C][C]1285.87096774194[/C][/ROW]
[ROW][C]52[/C][C]15928[/C][C]15062.1290322581[/C][C]865.870967741935[/C][/ROW]
[ROW][C]53[/C][C]16171[/C][C]15062.1290322581[/C][C]1108.87096774194[/C][/ROW]
[ROW][C]54[/C][C]15937[/C][C]15062.1290322581[/C][C]874.870967741935[/C][/ROW]
[ROW][C]55[/C][C]15713[/C][C]15062.1290322581[/C][C]650.870967741935[/C][/ROW]
[ROW][C]56[/C][C]15594[/C][C]15062.1290322581[/C][C]531.870967741935[/C][/ROW]
[ROW][C]57[/C][C]15683[/C][C]15062.1290322581[/C][C]620.870967741935[/C][/ROW]
[ROW][C]58[/C][C]16438[/C][C]15062.1290322581[/C][C]1375.87096774194[/C][/ROW]
[ROW][C]59[/C][C]17032[/C][C]15062.1290322581[/C][C]1969.87096774194[/C][/ROW]
[ROW][C]60[/C][C]17696[/C][C]15062.1290322581[/C][C]2633.87096774194[/C][/ROW]
[ROW][C]61[/C][C]17745[/C][C]15062.1290322581[/C][C]2682.87096774194[/C][/ROW]
[/TABLE]
Source: https://freestatistics.org/blog/index.php?pk=25501&T=4

Globally Unique Identifier (entire table): ba.freestatistics.org/blog/index.php?pk=25501&T=4

As an alternative you can also use a QR Code:  

The GUIDs for individual cells are displayed in the table below:

Multiple Linear Regression - Actuals, Interpolation, and Residuals
Time or IndexActualsInterpolationForecastResidualsPrediction Error
11051110479.666666666731.3333333333172
21081210479.6666666667332.333333333343
31073810479.6666666667258.333333333334
41017110479.6666666667-308.666666666666
5972110479.6666666667-758.666666666666
6989710479.6666666667-582.666666666666
7982810479.6666666667-651.666666666666
8992410479.6666666667-555.666666666666
91037110479.6666666667-108.666666666666
101084610479.6666666667366.333333333334
111041310479.6666666667-66.6666666666663
121070910479.6666666667229.333333333334
131066210479.6666666667182.333333333334
141057010479.666666666790.3333333333337
151029710479.6666666667-182.666666666666
161063510479.6666666667155.333333333334
171087210479.6666666667392.333333333334
181029610479.6666666667-183.666666666666
191038310479.6666666667-96.6666666666663
201043110479.6666666667-48.6666666666663
211057410479.666666666794.3333333333337
221065310479.6666666667173.333333333334
231080510479.6666666667325.333333333334
241087210479.6666666667392.333333333334
251062510479.6666666667145.333333333334
261040710479.6666666667-72.6666666666663
271046310479.6666666667-16.6666666666663
281055610479.666666666776.3333333333337
291064610479.6666666667166.333333333334
301070210479.6666666667222.333333333334
311135315062.1290322581-3709.12903225806
321134615062.1290322581-3716.12903225806
331145115062.1290322581-3611.12903225806
341196415062.1290322581-3098.12903225806
351257415062.1290322581-2488.12903225806
361303115062.1290322581-2031.12903225806
371381215062.1290322581-1250.12903225806
381454415062.1290322581-518.129032258065
391493115062.1290322581-131.129032258065
401488615062.1290322581-176.129032258065
411600515062.1290322581942.870967741935
421706415062.12903225812001.87096774194
431516815062.1290322581105.870967741935
441605015062.1290322581987.870967741935
451583915062.1290322581776.870967741935
461513715062.129032258174.8709677419354
471495415062.1290322581-108.129032258065
481564815062.1290322581585.870967741935
491530515062.1290322581242.870967741935
501557915062.1290322581516.870967741935
511634815062.12903225811285.87096774194
521592815062.1290322581865.870967741935
531617115062.12903225811108.87096774194
541593715062.1290322581874.870967741935
551571315062.1290322581650.870967741935
561559415062.1290322581531.870967741935
571568315062.1290322581620.870967741935
581643815062.12903225811375.87096774194
591703215062.12903225811969.87096774194
601769615062.12903225812633.87096774194
611774515062.12903225812682.87096774194


Parameters (Session):
par1 = 1 ; par2 = Do not include Seasonal Dummies ; par3 = No Linear Trend ;
Parameters (R input):
par1 = 1 ; par2 = Do not include Seasonal Dummies ; par3 = No Linear Trend ;
R code (references can be found in the software module):
library(lattice)
par1 <- as.numeric(par1)
x <- t(y)
k <- length(x[1,])
n <- length(x[,1])
x1 <- cbind(x[,par1], x[,1:k!=par1])
mycolnames <- c(colnames(x)[par1], colnames(x)[1:k!=par1])
colnames(x1) <- mycolnames #colnames(x)[par1]
x <- x1
if (par3 == 'First Differences'){
x2 <- array(0, dim=c(n-1,k), dimnames=list(1:(n-1), paste('(1-B)',colnames(x),sep='')))
for (i in 1:n-1) {
for (j in 1:k) {
x2[i,j] <- x[i+1,j] - x[i,j]
}
}
x <- x2
}
if (par2 == 'Include Monthly Dummies'){
x2 <- array(0, dim=c(n,11), dimnames=list(1:n, paste('M', seq(1:11), sep ='')))
for (i in 1:11){
x2[seq(i,n,12),i] <- 1
}
x <- cbind(x, x2)
}
if (par2 == 'Include Quarterly Dummies'){
x2 <- array(0, dim=c(n,3), dimnames=list(1:n, paste('Q', seq(1:3), sep ='')))
for (i in 1:3){
x2[seq(i,n,4),i] <- 1
}
x <- cbind(x, x2)
}
k <- length(x[1,])
if (par3 == 'Linear Trend'){
x <- cbind(x, c(1:n))
colnames(x)[k+1] <- 't'
}
x
k <- length(x[1,])
df <- as.data.frame(x)
(mylm <- lm(df))
(mysum <- summary(mylm))
bitmap(file='test0.png')
plot(x[,1], type='l', main='Actuals and Interpolation', ylab='value of Actuals and Interpolation (dots)', xlab='time or index')
points(x[,1]-mysum$resid)
grid()
dev.off()
bitmap(file='test1.png')
plot(mysum$resid, type='b', pch=19, main='Residuals', ylab='value of Residuals', xlab='time or index')
grid()
dev.off()
bitmap(file='test2.png')
hist(mysum$resid, main='Residual Histogram', xlab='values of Residuals')
grid()
dev.off()
bitmap(file='test3.png')
densityplot(~mysum$resid,col='black',main='Residual Density Plot', xlab='values of Residuals')
dev.off()
bitmap(file='test4.png')
qqnorm(mysum$resid, main='Residual Normal Q-Q Plot')
grid()
dev.off()
(myerror <- as.ts(mysum$resid))
bitmap(file='test5.png')
dum <- cbind(lag(myerror,k=1),myerror)
dum
dum1 <- dum[2:length(myerror),]
dum1
z <- as.data.frame(dum1)
z
plot(z,main=paste('Residual Lag plot, lowess, and regression line'), ylab='values of Residuals', xlab='lagged values of Residuals')
lines(lowess(z))
abline(lm(z))
grid()
dev.off()
bitmap(file='test6.png')
acf(mysum$resid, lag.max=length(mysum$resid)/2, main='Residual Autocorrelation Function')
grid()
dev.off()
bitmap(file='test7.png')
pacf(mysum$resid, lag.max=length(mysum$resid)/2, main='Residual Partial Autocorrelation Function')
grid()
dev.off()
bitmap(file='test8.png')
opar <- par(mfrow = c(2,2), oma = c(0, 0, 1.1, 0))
plot(mylm, las = 1, sub='Residual Diagnostics')
par(opar)
dev.off()
load(file='createtable')
a<-table.start()
a<-table.row.start(a)
a<-table.element(a, 'Multiple Linear Regression - Estimated Regression Equation', 1, TRUE)
a<-table.row.end(a)
myeq <- colnames(x)[1]
myeq <- paste(myeq, '[t] = ', sep='')
for (i in 1:k){
if (mysum$coefficients[i,1] > 0) myeq <- paste(myeq, '+', '')
myeq <- paste(myeq, mysum$coefficients[i,1], sep=' ')
if (rownames(mysum$coefficients)[i] != '(Intercept)') {
myeq <- paste(myeq, rownames(mysum$coefficients)[i], sep='')
if (rownames(mysum$coefficients)[i] != 't') myeq <- paste(myeq, '[t]', sep='')
}
}
myeq <- paste(myeq, ' + e[t]')
a<-table.row.start(a)
a<-table.element(a, myeq)
a<-table.row.end(a)
a<-table.end(a)
table.save(a,file='mytable1.tab')
a<-table.start()
a<-table.row.start(a)
a<-table.element(a,hyperlink('ols1.htm','Multiple Linear Regression - Ordinary Least Squares',''), 6, TRUE)
a<-table.row.end(a)
a<-table.row.start(a)
a<-table.element(a,'Variable',header=TRUE)
a<-table.element(a,'Parameter',header=TRUE)
a<-table.element(a,'S.D.',header=TRUE)
a<-table.element(a,'T-STAT
H0: parameter = 0',header=TRUE)
a<-table.element(a,'2-tail p-value',header=TRUE)
a<-table.element(a,'1-tail p-value',header=TRUE)
a<-table.row.end(a)
for (i in 1:k){
a<-table.row.start(a)
a<-table.element(a,rownames(mysum$coefficients)[i],header=TRUE)
a<-table.element(a,mysum$coefficients[i,1])
a<-table.element(a, round(mysum$coefficients[i,2],6))
a<-table.element(a, round(mysum$coefficients[i,3],4))
a<-table.element(a, round(mysum$coefficients[i,4],6))
a<-table.element(a, round(mysum$coefficients[i,4]/2,6))
a<-table.row.end(a)
}
a<-table.end(a)
table.save(a,file='mytable2.tab')
a<-table.start()
a<-table.row.start(a)
a<-table.element(a, 'Multiple Linear Regression - Regression Statistics', 2, TRUE)
a<-table.row.end(a)
a<-table.row.start(a)
a<-table.element(a, 'Multiple R',1,TRUE)
a<-table.element(a, sqrt(mysum$r.squared))
a<-table.row.end(a)
a<-table.row.start(a)
a<-table.element(a, 'R-squared',1,TRUE)
a<-table.element(a, mysum$r.squared)
a<-table.row.end(a)
a<-table.row.start(a)
a<-table.element(a, 'Adjusted R-squared',1,TRUE)
a<-table.element(a, mysum$adj.r.squared)
a<-table.row.end(a)
a<-table.row.start(a)
a<-table.element(a, 'F-TEST (value)',1,TRUE)
a<-table.element(a, mysum$fstatistic[1])
a<-table.row.end(a)
a<-table.row.start(a)
a<-table.element(a, 'F-TEST (DF numerator)',1,TRUE)
a<-table.element(a, mysum$fstatistic[2])
a<-table.row.end(a)
a<-table.row.start(a)
a<-table.element(a, 'F-TEST (DF denominator)',1,TRUE)
a<-table.element(a, mysum$fstatistic[3])
a<-table.row.end(a)
a<-table.row.start(a)
a<-table.element(a, 'p-value',1,TRUE)
a<-table.element(a, 1-pf(mysum$fstatistic[1],mysum$fstatistic[2],mysum$fstatistic[3]))
a<-table.row.end(a)
a<-table.row.start(a)
a<-table.element(a, 'Multiple Linear Regression - Residual Statistics', 2, TRUE)
a<-table.row.end(a)
a<-table.row.start(a)
a<-table.element(a, 'Residual Standard Deviation',1,TRUE)
a<-table.element(a, mysum$sigma)
a<-table.row.end(a)
a<-table.row.start(a)
a<-table.element(a, 'Sum Squared Residuals',1,TRUE)
a<-table.element(a, sum(myerror*myerror))
a<-table.row.end(a)
a<-table.end(a)
table.save(a,file='mytable3.tab')
a<-table.start()
a<-table.row.start(a)
a<-table.element(a, 'Multiple Linear Regression - Actuals, Interpolation, and Residuals', 4, TRUE)
a<-table.row.end(a)
a<-table.row.start(a)
a<-table.element(a, 'Time or Index', 1, TRUE)
a<-table.element(a, 'Actuals', 1, TRUE)
a<-table.element(a, 'Interpolation
Forecast', 1, TRUE)
a<-table.element(a, 'Residuals
Prediction Error', 1, TRUE)
a<-table.row.end(a)
for (i in 1:n) {
a<-table.row.start(a)
a<-table.element(a,i, 1, TRUE)
a<-table.element(a,x[i])
a<-table.element(a,x[i]-mysum$resid[i])
a<-table.element(a,mysum$resid[i])
a<-table.row.end(a)
}
a<-table.end(a)
table.save(a,file='mytable4.tab')