Free Statistics

of Irreproducible Research!

Author's title

Author*Unverified author*
R Software Modulerwasp_multipleregression.wasp
Title produced by softwareMultiple Regression
Date of computationMon, 24 Nov 2008 12:10:25 -0700
Cite this page as followsStatistical Computations at FreeStatistics.org, Office for Research Development and Education, URL https://freestatistics.org/blog/index.php?v=date/2008/Nov/24/t1227553889tmxq3dfwd3co1sp.htm/, Retrieved Tue, 14 May 2024 17:06:41 +0000
Statistical Computations at FreeStatistics.org, Office for Research Development and Education, URL https://freestatistics.org/blog/index.php?pk=25491, Retrieved Tue, 14 May 2024 17:06:41 +0000
QR Codes:

Original text written by user:
IsPrivate?No (this computation is public)
User-defined keywords
Estimated Impact146
Family? (F = Feedback message, R = changed R code, M = changed R Module, P = changed Parameters, D = changed Data)
F       [Multiple Regression] [Q3 goud] [2008-11-24 19:10:25] [4940af498c7c54f3992f17142bd40069] [Current]
Feedback Forum
2008-11-28 15:41:57 [Kim Wester] [reply
De student analyseert de grafieken goed. Er wordt echter geen conclusie verbonden aan deze waarnemingen. De gekozen dummy is niet realistisch maar volstaat.
2008-12-01 11:10:18 [Nathalie Boden] [reply
We kunnen zeggen dat t normaal wordt gebruikt als index. We gaan hier de volgnr. gebruiken als reeks op zich. We gaan ook zien wat effect is op lange termijn. Het is er goed aan gedaan om de module met lineaire trend en monthly dummies te nemen.

Post a new message
Dataseries X:
10511	0
10812	0
10738	0
10171	0
9721	0
9897	0
9828	0
9924	0
10371	0
10846	0
10413	0
10709	0
10662	0
10570	0
10297	0
10635	0
10872	0
10296	0
10383	0
10431	0
10574	0
10653	0
10805	0
10872	0
10625	0
10407	0
10463	0
10556	0
10646	0
10702	0
11353	0
11346	0
11451	0
11964	0
12574	0
13031	0
13812	0
14544	1
14931	1
14886	1
16005	1
17064	1
15168	1
16050	1
15839	1
15137	1
14954	1
15648	1
15305	1
15579	1
16348	1
15928	1
16171	1
15937	1
15713	1
15594	1
15683	1
16438	1
17032	1
17696	1
17745	1


Summary of computational transaction
Raw Inputview raw input (R code)
Raw Outputview raw output of R engine
Computing time3 seconds
R Server'George Udny Yule' @ 72.249.76.132

\begin{tabular}{lllllllll}
\hline
Summary of computational transaction \tabularnewline
Raw Input & view raw input (R code)  \tabularnewline
Raw Output & view raw output of R engine  \tabularnewline
Computing time & 3 seconds \tabularnewline
R Server & 'George Udny Yule' @ 72.249.76.132 \tabularnewline
\hline
\end{tabular}
%Source: https://freestatistics.org/blog/index.php?pk=25491&T=0

[TABLE]
[ROW][C]Summary of computational transaction[/C][/ROW]
[ROW][C]Raw Input[/C][C]view raw input (R code) [/C][/ROW]
[ROW][C]Raw Output[/C][C]view raw output of R engine [/C][/ROW]
[ROW][C]Computing time[/C][C]3 seconds[/C][/ROW]
[ROW][C]R Server[/C][C]'George Udny Yule' @ 72.249.76.132[/C][/ROW]
[/TABLE]
Source: https://freestatistics.org/blog/index.php?pk=25491&T=0

Globally Unique Identifier (entire table): ba.freestatistics.org/blog/index.php?pk=25491&T=0

As an alternative you can also use a QR Code:  

The GUIDs for individual cells are displayed in the table below:

Summary of computational transaction
Raw Inputview raw input (R code)
Raw Outputview raw output of R engine
Computing time3 seconds
R Server'George Udny Yule' @ 72.249.76.132


Multiple Linear Regression - Estimated Regression Equation
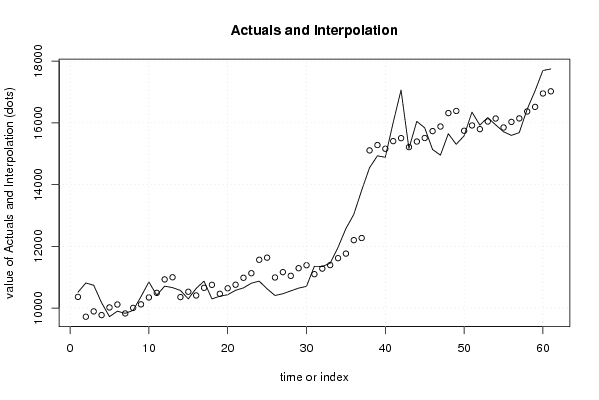
Yt[t] = + 10291.2347107438 + 3480.52376033058D[t] + 15.8009986225896M1[t] -678.867837465564M2[t] -558.861053719007M3[t] -732.05426997245M4[t] -537.247486225894M5[t] -494.040702479338M6[t] -837.233918732781M7[t] -710.227134986226M8[t] -648.620351239668M9[t] -477.613567493112M10[t] -382.606783746556M11[t] + 52.9932162534436t + e[t]

\begin{tabular}{lllllllll}
\hline
Multiple Linear Regression - Estimated Regression Equation \tabularnewline
Yt[t] =  +  10291.2347107438 +  3480.52376033058D[t] +  15.8009986225896M1[t] -678.867837465564M2[t] -558.861053719007M3[t] -732.05426997245M4[t] -537.247486225894M5[t] -494.040702479338M6[t] -837.233918732781M7[t] -710.227134986226M8[t] -648.620351239668M9[t] -477.613567493112M10[t] -382.606783746556M11[t] +  52.9932162534436t  + e[t] \tabularnewline
\hline
\end{tabular}
%Source: https://freestatistics.org/blog/index.php?pk=25491&T=1

[TABLE]
[ROW][C]Multiple Linear Regression - Estimated Regression Equation[/C][/ROW]
[ROW][C]Yt[t] =  +  10291.2347107438 +  3480.52376033058D[t] +  15.8009986225896M1[t] -678.867837465564M2[t] -558.861053719007M3[t] -732.05426997245M4[t] -537.247486225894M5[t] -494.040702479338M6[t] -837.233918732781M7[t] -710.227134986226M8[t] -648.620351239668M9[t] -477.613567493112M10[t] -382.606783746556M11[t] +  52.9932162534436t  + e[t][/C][/ROW]
[/TABLE]
Source: https://freestatistics.org/blog/index.php?pk=25491&T=1

Globally Unique Identifier (entire table): ba.freestatistics.org/blog/index.php?pk=25491&T=1

As an alternative you can also use a QR Code:  

The GUIDs for individual cells are displayed in the table below:

Multiple Linear Regression - Estimated Regression Equation
Yt[t] = + 10291.2347107438 + 3480.52376033058D[t] + 15.8009986225896M1[t] -678.867837465564M2[t] -558.861053719007M3[t] -732.05426997245M4[t] -537.247486225894M5[t] -494.040702479338M6[t] -837.233918732781M7[t] -710.227134986226M8[t] -648.620351239668M9[t] -477.613567493112M10[t] -382.606783746556M11[t] + 52.9932162534436t + e[t]


Multiple Linear Regression - Ordinary Least Squares
VariableParameterS.D.T-STATH0: parameter = 02-tail p-value1-tail p-value
(Intercept)10291.2347107438369.62671527.842200
D3480.52376033058330.78584210.52200
M115.8009986225896391.3921020.04040.9679680.483984
M2-678.867837465564418.099298-1.62370.1111290.055564
M3-558.861053719007416.12662-1.3430.1857190.09286
M4-732.05426997245414.353631-1.76670.0837660.041883
M5-537.247486225894412.782905-1.30150.1994220.099711
M6-494.040702479338411.416758-1.20080.2358350.117918
M7-837.233918732781410.257235-2.04080.0469140.023457
M8-710.227134986226409.306091-1.73520.0892590.04463
M9-648.620351239668408.564781-1.58760.1190920.059546
M10-477.613567493112408.034449-1.17050.2476920.123846
M11-382.606783746556407.715919-0.93840.3528290.176414
t52.99321625344369.3066465.69411e-060

\begin{tabular}{lllllllll}
\hline
Multiple Linear Regression - Ordinary Least Squares \tabularnewline
Variable & Parameter & S.D. & T-STATH0: parameter = 0 & 2-tail p-value & 1-tail p-value \tabularnewline
(Intercept) & 10291.2347107438 & 369.626715 & 27.8422 & 0 & 0 \tabularnewline
D & 3480.52376033058 & 330.785842 & 10.522 & 0 & 0 \tabularnewline
M1 & 15.8009986225896 & 391.392102 & 0.0404 & 0.967968 & 0.483984 \tabularnewline
M2 & -678.867837465564 & 418.099298 & -1.6237 & 0.111129 & 0.055564 \tabularnewline
M3 & -558.861053719007 & 416.12662 & -1.343 & 0.185719 & 0.09286 \tabularnewline
M4 & -732.05426997245 & 414.353631 & -1.7667 & 0.083766 & 0.041883 \tabularnewline
M5 & -537.247486225894 & 412.782905 & -1.3015 & 0.199422 & 0.099711 \tabularnewline
M6 & -494.040702479338 & 411.416758 & -1.2008 & 0.235835 & 0.117918 \tabularnewline
M7 & -837.233918732781 & 410.257235 & -2.0408 & 0.046914 & 0.023457 \tabularnewline
M8 & -710.227134986226 & 409.306091 & -1.7352 & 0.089259 & 0.04463 \tabularnewline
M9 & -648.620351239668 & 408.564781 & -1.5876 & 0.119092 & 0.059546 \tabularnewline
M10 & -477.613567493112 & 408.034449 & -1.1705 & 0.247692 & 0.123846 \tabularnewline
M11 & -382.606783746556 & 407.715919 & -0.9384 & 0.352829 & 0.176414 \tabularnewline
t & 52.9932162534436 & 9.306646 & 5.6941 & 1e-06 & 0 \tabularnewline
\hline
\end{tabular}
%Source: https://freestatistics.org/blog/index.php?pk=25491&T=2

[TABLE]
[ROW][C]Multiple Linear Regression - Ordinary Least Squares[/C][/ROW]
[ROW][C]Variable[/C][C]Parameter[/C][C]S.D.[/C][C]T-STATH0: parameter = 0[/C][C]2-tail p-value[/C][C]1-tail p-value[/C][/ROW]
[ROW][C](Intercept)[/C][C]10291.2347107438[/C][C]369.626715[/C][C]27.8422[/C][C]0[/C][C]0[/C][/ROW]
[ROW][C]D[/C][C]3480.52376033058[/C][C]330.785842[/C][C]10.522[/C][C]0[/C][C]0[/C][/ROW]
[ROW][C]M1[/C][C]15.8009986225896[/C][C]391.392102[/C][C]0.0404[/C][C]0.967968[/C][C]0.483984[/C][/ROW]
[ROW][C]M2[/C][C]-678.867837465564[/C][C]418.099298[/C][C]-1.6237[/C][C]0.111129[/C][C]0.055564[/C][/ROW]
[ROW][C]M3[/C][C]-558.861053719007[/C][C]416.12662[/C][C]-1.343[/C][C]0.185719[/C][C]0.09286[/C][/ROW]
[ROW][C]M4[/C][C]-732.05426997245[/C][C]414.353631[/C][C]-1.7667[/C][C]0.083766[/C][C]0.041883[/C][/ROW]
[ROW][C]M5[/C][C]-537.247486225894[/C][C]412.782905[/C][C]-1.3015[/C][C]0.199422[/C][C]0.099711[/C][/ROW]
[ROW][C]M6[/C][C]-494.040702479338[/C][C]411.416758[/C][C]-1.2008[/C][C]0.235835[/C][C]0.117918[/C][/ROW]
[ROW][C]M7[/C][C]-837.233918732781[/C][C]410.257235[/C][C]-2.0408[/C][C]0.046914[/C][C]0.023457[/C][/ROW]
[ROW][C]M8[/C][C]-710.227134986226[/C][C]409.306091[/C][C]-1.7352[/C][C]0.089259[/C][C]0.04463[/C][/ROW]
[ROW][C]M9[/C][C]-648.620351239668[/C][C]408.564781[/C][C]-1.5876[/C][C]0.119092[/C][C]0.059546[/C][/ROW]
[ROW][C]M10[/C][C]-477.613567493112[/C][C]408.034449[/C][C]-1.1705[/C][C]0.247692[/C][C]0.123846[/C][/ROW]
[ROW][C]M11[/C][C]-382.606783746556[/C][C]407.715919[/C][C]-0.9384[/C][C]0.352829[/C][C]0.176414[/C][/ROW]
[ROW][C]t[/C][C]52.9932162534436[/C][C]9.306646[/C][C]5.6941[/C][C]1e-06[/C][C]0[/C][/ROW]
[/TABLE]
Source: https://freestatistics.org/blog/index.php?pk=25491&T=2

Globally Unique Identifier (entire table): ba.freestatistics.org/blog/index.php?pk=25491&T=2

As an alternative you can also use a QR Code:  

The GUIDs for individual cells are displayed in the table below:

Multiple Linear Regression - Ordinary Least Squares
VariableParameterS.D.T-STATH0: parameter = 02-tail p-value1-tail p-value
(Intercept)10291.2347107438369.62671527.842200
D3480.52376033058330.78584210.52200
M115.8009986225896391.3921020.04040.9679680.483984
M2-678.867837465564418.099298-1.62370.1111290.055564
M3-558.861053719007416.12662-1.3430.1857190.09286
M4-732.05426997245414.353631-1.76670.0837660.041883
M5-537.247486225894412.782905-1.30150.1994220.099711
M6-494.040702479338411.416758-1.20080.2358350.117918
M7-837.233918732781410.257235-2.04080.0469140.023457
M8-710.227134986226409.306091-1.73520.0892590.04463
M9-648.620351239668408.564781-1.58760.1190920.059546
M10-477.613567493112408.034449-1.17050.2476920.123846
M11-382.606783746556407.715919-0.93840.3528290.176414
t52.99321625344369.3066465.69411e-060


Multiple Linear Regression - Regression Statistics
Multiple R0.976366334071566
R-squared0.95329121830835
Adjusted R-squared0.940371768053213
F-TEST (value)73.7872896665464
F-TEST (DF numerator)13
F-TEST (DF denominator)47
p-value0
Multiple Linear Regression - Residual Statistics
Residual Standard Deviation644.487504184479
Sum Squared Residuals19522114.7233471

\begin{tabular}{lllllllll}
\hline
Multiple Linear Regression - Regression Statistics \tabularnewline
Multiple R & 0.976366334071566 \tabularnewline
R-squared & 0.95329121830835 \tabularnewline
Adjusted R-squared & 0.940371768053213 \tabularnewline
F-TEST (value) & 73.7872896665464 \tabularnewline
F-TEST (DF numerator) & 13 \tabularnewline
F-TEST (DF denominator) & 47 \tabularnewline
p-value & 0 \tabularnewline
Multiple Linear Regression - Residual Statistics \tabularnewline
Residual Standard Deviation & 644.487504184479 \tabularnewline
Sum Squared Residuals & 19522114.7233471 \tabularnewline
\hline
\end{tabular}
%Source: https://freestatistics.org/blog/index.php?pk=25491&T=3

[TABLE]
[ROW][C]Multiple Linear Regression - Regression Statistics[/C][/ROW]
[ROW][C]Multiple R[/C][C]0.976366334071566[/C][/ROW]
[ROW][C]R-squared[/C][C]0.95329121830835[/C][/ROW]
[ROW][C]Adjusted R-squared[/C][C]0.940371768053213[/C][/ROW]
[ROW][C]F-TEST (value)[/C][C]73.7872896665464[/C][/ROW]
[ROW][C]F-TEST (DF numerator)[/C][C]13[/C][/ROW]
[ROW][C]F-TEST (DF denominator)[/C][C]47[/C][/ROW]
[ROW][C]p-value[/C][C]0[/C][/ROW]
[ROW][C]Multiple Linear Regression - Residual Statistics[/C][/ROW]
[ROW][C]Residual Standard Deviation[/C][C]644.487504184479[/C][/ROW]
[ROW][C]Sum Squared Residuals[/C][C]19522114.7233471[/C][/ROW]
[/TABLE]
Source: https://freestatistics.org/blog/index.php?pk=25491&T=3

Globally Unique Identifier (entire table): ba.freestatistics.org/blog/index.php?pk=25491&T=3

As an alternative you can also use a QR Code:  

The GUIDs for individual cells are displayed in the table below:

Multiple Linear Regression - Regression Statistics
Multiple R0.976366334071566
R-squared0.95329121830835
Adjusted R-squared0.940371768053213
F-TEST (value)73.7872896665464
F-TEST (DF numerator)13
F-TEST (DF denominator)47
p-value0
Multiple Linear Regression - Residual Statistics
Residual Standard Deviation644.487504184479
Sum Squared Residuals19522114.7233471


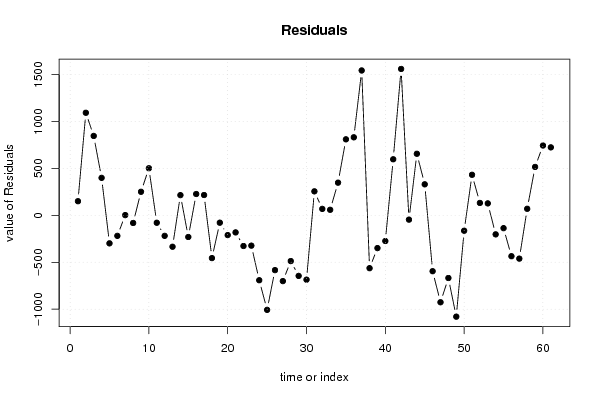
Multiple Linear Regression - Actuals, Interpolation, and Residuals
Time or IndexActualsInterpolationForecastResidualsPrediction Error
11051110360.0289256198150.971074380158
2108129718.353305785131093.64669421487
3107389891.35330578512846.646694214877
4101719771.15330578512399.846694214879
5972110018.9533057851-297.953305785124
6989710115.1533057851-218.153305785124
798289824.953305785123.04669421487689
8992410004.9533057851-80.9533057851238
91037110119.5533057851251.446694214876
101084610343.5533057851502.446694214877
111041310491.5533057851-78.5533057851243
121070910927.1533057851-218.153305785122
131066210995.9475206612-333.947520661156
141057010354.2719008264215.728099173555
151029710527.2719008264-230.271900826445
161063510407.0719008264227.928099173554
171087210654.8719008264217.128099173554
181029610751.0719008264-455.071900826446
191038310460.8719008264-77.8719008264461
201043110640.8719008264-209.871900826446
211057410755.4719008264-181.471900826446
221065310979.4719008264-326.471900826447
231080511127.4719008264-322.471900826446
241087211563.0719008264-691.071900826445
251062511631.8661157025-1006.86611570248
261040710990.1904958678-583.190495867769
271046311163.1904958678-700.190495867768
281055611042.9904958678-486.990495867769
291064611290.7904958678-644.790495867769
301070211386.9904958678-684.990495867769
311135311096.7904958678256.209504132231
321134611276.790495867869.2095041322312
331145111391.390495867859.6095041322312
341196411615.3904958678348.609504132231
351257411763.3904958678810.609504132231
361303112198.9904958678832.009504132232
371381212267.78471074381544.2152892562
381454415106.6328512397-562.63285123967
391493115279.6328512397-348.632851239669
401488615159.4328512397-273.43285123967
411600515407.2328512397597.767148760331
421706415503.43285123971560.56714876033
431516815213.2328512397-45.2328512396695
441605015393.2328512397656.767148760331
451583915507.8328512397331.167148760331
461513715731.8328512397-594.83285123967
471495415879.8328512397-925.83285123967
481564816315.4328512397-667.432851239668
491530516384.2270661157-1079.22706611570
501557915742.551446281-163.551446280992
511634815915.551446281432.448553719008
521592815795.351446281132.648553719008
531617116043.151446281127.848553719008
541593716139.351446281-202.351446280992
551571315849.151446281-136.151446280992
561559416029.151446281-435.151446280992
571568316143.751446281-460.751446280992
581643816367.75144628170.2485537190071
591703216515.751446281516.248553719008
601769616951.351446281744.648553719009
611774517020.145661157724.854338842976

\begin{tabular}{lllllllll}
\hline
Multiple Linear Regression - Actuals, Interpolation, and Residuals \tabularnewline
Time or Index & Actuals & InterpolationForecast & ResidualsPrediction Error \tabularnewline
1 & 10511 & 10360.0289256198 & 150.971074380158 \tabularnewline
2 & 10812 & 9718.35330578513 & 1093.64669421487 \tabularnewline
3 & 10738 & 9891.35330578512 & 846.646694214877 \tabularnewline
4 & 10171 & 9771.15330578512 & 399.846694214879 \tabularnewline
5 & 9721 & 10018.9533057851 & -297.953305785124 \tabularnewline
6 & 9897 & 10115.1533057851 & -218.153305785124 \tabularnewline
7 & 9828 & 9824.95330578512 & 3.04669421487689 \tabularnewline
8 & 9924 & 10004.9533057851 & -80.9533057851238 \tabularnewline
9 & 10371 & 10119.5533057851 & 251.446694214876 \tabularnewline
10 & 10846 & 10343.5533057851 & 502.446694214877 \tabularnewline
11 & 10413 & 10491.5533057851 & -78.5533057851243 \tabularnewline
12 & 10709 & 10927.1533057851 & -218.153305785122 \tabularnewline
13 & 10662 & 10995.9475206612 & -333.947520661156 \tabularnewline
14 & 10570 & 10354.2719008264 & 215.728099173555 \tabularnewline
15 & 10297 & 10527.2719008264 & -230.271900826445 \tabularnewline
16 & 10635 & 10407.0719008264 & 227.928099173554 \tabularnewline
17 & 10872 & 10654.8719008264 & 217.128099173554 \tabularnewline
18 & 10296 & 10751.0719008264 & -455.071900826446 \tabularnewline
19 & 10383 & 10460.8719008264 & -77.8719008264461 \tabularnewline
20 & 10431 & 10640.8719008264 & -209.871900826446 \tabularnewline
21 & 10574 & 10755.4719008264 & -181.471900826446 \tabularnewline
22 & 10653 & 10979.4719008264 & -326.471900826447 \tabularnewline
23 & 10805 & 11127.4719008264 & -322.471900826446 \tabularnewline
24 & 10872 & 11563.0719008264 & -691.071900826445 \tabularnewline
25 & 10625 & 11631.8661157025 & -1006.86611570248 \tabularnewline
26 & 10407 & 10990.1904958678 & -583.190495867769 \tabularnewline
27 & 10463 & 11163.1904958678 & -700.190495867768 \tabularnewline
28 & 10556 & 11042.9904958678 & -486.990495867769 \tabularnewline
29 & 10646 & 11290.7904958678 & -644.790495867769 \tabularnewline
30 & 10702 & 11386.9904958678 & -684.990495867769 \tabularnewline
31 & 11353 & 11096.7904958678 & 256.209504132231 \tabularnewline
32 & 11346 & 11276.7904958678 & 69.2095041322312 \tabularnewline
33 & 11451 & 11391.3904958678 & 59.6095041322312 \tabularnewline
34 & 11964 & 11615.3904958678 & 348.609504132231 \tabularnewline
35 & 12574 & 11763.3904958678 & 810.609504132231 \tabularnewline
36 & 13031 & 12198.9904958678 & 832.009504132232 \tabularnewline
37 & 13812 & 12267.7847107438 & 1544.2152892562 \tabularnewline
38 & 14544 & 15106.6328512397 & -562.63285123967 \tabularnewline
39 & 14931 & 15279.6328512397 & -348.632851239669 \tabularnewline
40 & 14886 & 15159.4328512397 & -273.43285123967 \tabularnewline
41 & 16005 & 15407.2328512397 & 597.767148760331 \tabularnewline
42 & 17064 & 15503.4328512397 & 1560.56714876033 \tabularnewline
43 & 15168 & 15213.2328512397 & -45.2328512396695 \tabularnewline
44 & 16050 & 15393.2328512397 & 656.767148760331 \tabularnewline
45 & 15839 & 15507.8328512397 & 331.167148760331 \tabularnewline
46 & 15137 & 15731.8328512397 & -594.83285123967 \tabularnewline
47 & 14954 & 15879.8328512397 & -925.83285123967 \tabularnewline
48 & 15648 & 16315.4328512397 & -667.432851239668 \tabularnewline
49 & 15305 & 16384.2270661157 & -1079.22706611570 \tabularnewline
50 & 15579 & 15742.551446281 & -163.551446280992 \tabularnewline
51 & 16348 & 15915.551446281 & 432.448553719008 \tabularnewline
52 & 15928 & 15795.351446281 & 132.648553719008 \tabularnewline
53 & 16171 & 16043.151446281 & 127.848553719008 \tabularnewline
54 & 15937 & 16139.351446281 & -202.351446280992 \tabularnewline
55 & 15713 & 15849.151446281 & -136.151446280992 \tabularnewline
56 & 15594 & 16029.151446281 & -435.151446280992 \tabularnewline
57 & 15683 & 16143.751446281 & -460.751446280992 \tabularnewline
58 & 16438 & 16367.751446281 & 70.2485537190071 \tabularnewline
59 & 17032 & 16515.751446281 & 516.248553719008 \tabularnewline
60 & 17696 & 16951.351446281 & 744.648553719009 \tabularnewline
61 & 17745 & 17020.145661157 & 724.854338842976 \tabularnewline
\hline
\end{tabular}
%Source: https://freestatistics.org/blog/index.php?pk=25491&T=4

[TABLE]
[ROW][C]Multiple Linear Regression - Actuals, Interpolation, and Residuals[/C][/ROW]
[ROW][C]Time or Index[/C][C]Actuals[/C][C]InterpolationForecast[/C][C]ResidualsPrediction Error[/C][/ROW]
[ROW][C]1[/C][C]10511[/C][C]10360.0289256198[/C][C]150.971074380158[/C][/ROW]
[ROW][C]2[/C][C]10812[/C][C]9718.35330578513[/C][C]1093.64669421487[/C][/ROW]
[ROW][C]3[/C][C]10738[/C][C]9891.35330578512[/C][C]846.646694214877[/C][/ROW]
[ROW][C]4[/C][C]10171[/C][C]9771.15330578512[/C][C]399.846694214879[/C][/ROW]
[ROW][C]5[/C][C]9721[/C][C]10018.9533057851[/C][C]-297.953305785124[/C][/ROW]
[ROW][C]6[/C][C]9897[/C][C]10115.1533057851[/C][C]-218.153305785124[/C][/ROW]
[ROW][C]7[/C][C]9828[/C][C]9824.95330578512[/C][C]3.04669421487689[/C][/ROW]
[ROW][C]8[/C][C]9924[/C][C]10004.9533057851[/C][C]-80.9533057851238[/C][/ROW]
[ROW][C]9[/C][C]10371[/C][C]10119.5533057851[/C][C]251.446694214876[/C][/ROW]
[ROW][C]10[/C][C]10846[/C][C]10343.5533057851[/C][C]502.446694214877[/C][/ROW]
[ROW][C]11[/C][C]10413[/C][C]10491.5533057851[/C][C]-78.5533057851243[/C][/ROW]
[ROW][C]12[/C][C]10709[/C][C]10927.1533057851[/C][C]-218.153305785122[/C][/ROW]
[ROW][C]13[/C][C]10662[/C][C]10995.9475206612[/C][C]-333.947520661156[/C][/ROW]
[ROW][C]14[/C][C]10570[/C][C]10354.2719008264[/C][C]215.728099173555[/C][/ROW]
[ROW][C]15[/C][C]10297[/C][C]10527.2719008264[/C][C]-230.271900826445[/C][/ROW]
[ROW][C]16[/C][C]10635[/C][C]10407.0719008264[/C][C]227.928099173554[/C][/ROW]
[ROW][C]17[/C][C]10872[/C][C]10654.8719008264[/C][C]217.128099173554[/C][/ROW]
[ROW][C]18[/C][C]10296[/C][C]10751.0719008264[/C][C]-455.071900826446[/C][/ROW]
[ROW][C]19[/C][C]10383[/C][C]10460.8719008264[/C][C]-77.8719008264461[/C][/ROW]
[ROW][C]20[/C][C]10431[/C][C]10640.8719008264[/C][C]-209.871900826446[/C][/ROW]
[ROW][C]21[/C][C]10574[/C][C]10755.4719008264[/C][C]-181.471900826446[/C][/ROW]
[ROW][C]22[/C][C]10653[/C][C]10979.4719008264[/C][C]-326.471900826447[/C][/ROW]
[ROW][C]23[/C][C]10805[/C][C]11127.4719008264[/C][C]-322.471900826446[/C][/ROW]
[ROW][C]24[/C][C]10872[/C][C]11563.0719008264[/C][C]-691.071900826445[/C][/ROW]
[ROW][C]25[/C][C]10625[/C][C]11631.8661157025[/C][C]-1006.86611570248[/C][/ROW]
[ROW][C]26[/C][C]10407[/C][C]10990.1904958678[/C][C]-583.190495867769[/C][/ROW]
[ROW][C]27[/C][C]10463[/C][C]11163.1904958678[/C][C]-700.190495867768[/C][/ROW]
[ROW][C]28[/C][C]10556[/C][C]11042.9904958678[/C][C]-486.990495867769[/C][/ROW]
[ROW][C]29[/C][C]10646[/C][C]11290.7904958678[/C][C]-644.790495867769[/C][/ROW]
[ROW][C]30[/C][C]10702[/C][C]11386.9904958678[/C][C]-684.990495867769[/C][/ROW]
[ROW][C]31[/C][C]11353[/C][C]11096.7904958678[/C][C]256.209504132231[/C][/ROW]
[ROW][C]32[/C][C]11346[/C][C]11276.7904958678[/C][C]69.2095041322312[/C][/ROW]
[ROW][C]33[/C][C]11451[/C][C]11391.3904958678[/C][C]59.6095041322312[/C][/ROW]
[ROW][C]34[/C][C]11964[/C][C]11615.3904958678[/C][C]348.609504132231[/C][/ROW]
[ROW][C]35[/C][C]12574[/C][C]11763.3904958678[/C][C]810.609504132231[/C][/ROW]
[ROW][C]36[/C][C]13031[/C][C]12198.9904958678[/C][C]832.009504132232[/C][/ROW]
[ROW][C]37[/C][C]13812[/C][C]12267.7847107438[/C][C]1544.2152892562[/C][/ROW]
[ROW][C]38[/C][C]14544[/C][C]15106.6328512397[/C][C]-562.63285123967[/C][/ROW]
[ROW][C]39[/C][C]14931[/C][C]15279.6328512397[/C][C]-348.632851239669[/C][/ROW]
[ROW][C]40[/C][C]14886[/C][C]15159.4328512397[/C][C]-273.43285123967[/C][/ROW]
[ROW][C]41[/C][C]16005[/C][C]15407.2328512397[/C][C]597.767148760331[/C][/ROW]
[ROW][C]42[/C][C]17064[/C][C]15503.4328512397[/C][C]1560.56714876033[/C][/ROW]
[ROW][C]43[/C][C]15168[/C][C]15213.2328512397[/C][C]-45.2328512396695[/C][/ROW]
[ROW][C]44[/C][C]16050[/C][C]15393.2328512397[/C][C]656.767148760331[/C][/ROW]
[ROW][C]45[/C][C]15839[/C][C]15507.8328512397[/C][C]331.167148760331[/C][/ROW]
[ROW][C]46[/C][C]15137[/C][C]15731.8328512397[/C][C]-594.83285123967[/C][/ROW]
[ROW][C]47[/C][C]14954[/C][C]15879.8328512397[/C][C]-925.83285123967[/C][/ROW]
[ROW][C]48[/C][C]15648[/C][C]16315.4328512397[/C][C]-667.432851239668[/C][/ROW]
[ROW][C]49[/C][C]15305[/C][C]16384.2270661157[/C][C]-1079.22706611570[/C][/ROW]
[ROW][C]50[/C][C]15579[/C][C]15742.551446281[/C][C]-163.551446280992[/C][/ROW]
[ROW][C]51[/C][C]16348[/C][C]15915.551446281[/C][C]432.448553719008[/C][/ROW]
[ROW][C]52[/C][C]15928[/C][C]15795.351446281[/C][C]132.648553719008[/C][/ROW]
[ROW][C]53[/C][C]16171[/C][C]16043.151446281[/C][C]127.848553719008[/C][/ROW]
[ROW][C]54[/C][C]15937[/C][C]16139.351446281[/C][C]-202.351446280992[/C][/ROW]
[ROW][C]55[/C][C]15713[/C][C]15849.151446281[/C][C]-136.151446280992[/C][/ROW]
[ROW][C]56[/C][C]15594[/C][C]16029.151446281[/C][C]-435.151446280992[/C][/ROW]
[ROW][C]57[/C][C]15683[/C][C]16143.751446281[/C][C]-460.751446280992[/C][/ROW]
[ROW][C]58[/C][C]16438[/C][C]16367.751446281[/C][C]70.2485537190071[/C][/ROW]
[ROW][C]59[/C][C]17032[/C][C]16515.751446281[/C][C]516.248553719008[/C][/ROW]
[ROW][C]60[/C][C]17696[/C][C]16951.351446281[/C][C]744.648553719009[/C][/ROW]
[ROW][C]61[/C][C]17745[/C][C]17020.145661157[/C][C]724.854338842976[/C][/ROW]
[/TABLE]
Source: https://freestatistics.org/blog/index.php?pk=25491&T=4

Globally Unique Identifier (entire table): ba.freestatistics.org/blog/index.php?pk=25491&T=4

As an alternative you can also use a QR Code:  

The GUIDs for individual cells are displayed in the table below:

Multiple Linear Regression - Actuals, Interpolation, and Residuals
Time or IndexActualsInterpolationForecastResidualsPrediction Error
11051110360.0289256198150.971074380158
2108129718.353305785131093.64669421487
3107389891.35330578512846.646694214877
4101719771.15330578512399.846694214879
5972110018.9533057851-297.953305785124
6989710115.1533057851-218.153305785124
798289824.953305785123.04669421487689
8992410004.9533057851-80.9533057851238
91037110119.5533057851251.446694214876
101084610343.5533057851502.446694214877
111041310491.5533057851-78.5533057851243
121070910927.1533057851-218.153305785122
131066210995.9475206612-333.947520661156
141057010354.2719008264215.728099173555
151029710527.2719008264-230.271900826445
161063510407.0719008264227.928099173554
171087210654.8719008264217.128099173554
181029610751.0719008264-455.071900826446
191038310460.8719008264-77.8719008264461
201043110640.8719008264-209.871900826446
211057410755.4719008264-181.471900826446
221065310979.4719008264-326.471900826447
231080511127.4719008264-322.471900826446
241087211563.0719008264-691.071900826445
251062511631.8661157025-1006.86611570248
261040710990.1904958678-583.190495867769
271046311163.1904958678-700.190495867768
281055611042.9904958678-486.990495867769
291064611290.7904958678-644.790495867769
301070211386.9904958678-684.990495867769
311135311096.7904958678256.209504132231
321134611276.790495867869.2095041322312
331145111391.390495867859.6095041322312
341196411615.3904958678348.609504132231
351257411763.3904958678810.609504132231
361303112198.9904958678832.009504132232
371381212267.78471074381544.2152892562
381454415106.6328512397-562.63285123967
391493115279.6328512397-348.632851239669
401488615159.4328512397-273.43285123967
411600515407.2328512397597.767148760331
421706415503.43285123971560.56714876033
431516815213.2328512397-45.2328512396695
441605015393.2328512397656.767148760331
451583915507.8328512397331.167148760331
461513715731.8328512397-594.83285123967
471495415879.8328512397-925.83285123967
481564816315.4328512397-667.432851239668
491530516384.2270661157-1079.22706611570
501557915742.551446281-163.551446280992
511634815915.551446281432.448553719008
521592815795.351446281132.648553719008
531617116043.151446281127.848553719008
541593716139.351446281-202.351446280992
551571315849.151446281-136.151446280992
561559416029.151446281-435.151446280992
571568316143.751446281-460.751446280992
581643816367.75144628170.2485537190071
591703216515.751446281516.248553719008
601769616951.351446281744.648553719009
611774517020.145661157724.854338842976


Goldfeld-Quandt test for Heteroskedasticity
p-valuesAlternative Hypothesis
breakpoint indexgreater2-sidedless
170.3608725977671150.721745195534230.639127402232885
180.2089530448575390.4179060897150780.791046955142461
190.1184668348803430.2369336697606850.881533165119657
200.06024950053102850.1204990010620570.939750499468971
210.02777440620979390.05554881241958780.972225593790206
220.01710089692788000.03420179385576000.98289910307212
230.007264962806719980.01452992561344000.99273503719328
240.003107571746628590.006215143493257190.996892428253371
250.002116062028941060.004232124057882120.997883937971059
260.001840149533916820.003680299067833640.998159850466083
270.001023850083623580.002047700167247170.998976149916376
280.0004281747288827640.0008563494577655270.999571825271117
290.0003083257778147650.0006166515556295310.999691674222185
300.0008206246790452680.001641249358090540.999179375320955
310.002876463161371780.005752926322743550.997123536838628
320.005216288028408940.01043257605681790.994783711971591
330.005379465885186230.01075893177037250.994620534114814
340.00597373385041210.01194746770082420.994026266149588
350.02033611473997090.04067222947994190.97966388526003
360.05779252031293440.1155850406258690.942207479687066
370.1704370681100180.3408741362200370.829562931889982
380.1113718595453910.2227437190907810.88862814045461
390.0767337219468280.1534674438936560.923266278053172
400.04482282780815240.08964565561630470.955177172191848
410.03937407037030520.07874814074061030.960625929629695
420.1763197326023500.3526394652047000.82368026739765
430.1153189480333370.2306378960666750.884681051966663
440.2188470810779630.4376941621559260.781152918922037

\begin{tabular}{lllllllll}
\hline
Goldfeld-Quandt test for Heteroskedasticity \tabularnewline
p-values & Alternative Hypothesis \tabularnewline
breakpoint index & greater & 2-sided & less \tabularnewline
17 & 0.360872597767115 & 0.72174519553423 & 0.639127402232885 \tabularnewline
18 & 0.208953044857539 & 0.417906089715078 & 0.791046955142461 \tabularnewline
19 & 0.118466834880343 & 0.236933669760685 & 0.881533165119657 \tabularnewline
20 & 0.0602495005310285 & 0.120499001062057 & 0.939750499468971 \tabularnewline
21 & 0.0277744062097939 & 0.0555488124195878 & 0.972225593790206 \tabularnewline
22 & 0.0171008969278800 & 0.0342017938557600 & 0.98289910307212 \tabularnewline
23 & 0.00726496280671998 & 0.0145299256134400 & 0.99273503719328 \tabularnewline
24 & 0.00310757174662859 & 0.00621514349325719 & 0.996892428253371 \tabularnewline
25 & 0.00211606202894106 & 0.00423212405788212 & 0.997883937971059 \tabularnewline
26 & 0.00184014953391682 & 0.00368029906783364 & 0.998159850466083 \tabularnewline
27 & 0.00102385008362358 & 0.00204770016724717 & 0.998976149916376 \tabularnewline
28 & 0.000428174728882764 & 0.000856349457765527 & 0.999571825271117 \tabularnewline
29 & 0.000308325777814765 & 0.000616651555629531 & 0.999691674222185 \tabularnewline
30 & 0.000820624679045268 & 0.00164124935809054 & 0.999179375320955 \tabularnewline
31 & 0.00287646316137178 & 0.00575292632274355 & 0.997123536838628 \tabularnewline
32 & 0.00521628802840894 & 0.0104325760568179 & 0.994783711971591 \tabularnewline
33 & 0.00537946588518623 & 0.0107589317703725 & 0.994620534114814 \tabularnewline
34 & 0.0059737338504121 & 0.0119474677008242 & 0.994026266149588 \tabularnewline
35 & 0.0203361147399709 & 0.0406722294799419 & 0.97966388526003 \tabularnewline
36 & 0.0577925203129344 & 0.115585040625869 & 0.942207479687066 \tabularnewline
37 & 0.170437068110018 & 0.340874136220037 & 0.829562931889982 \tabularnewline
38 & 0.111371859545391 & 0.222743719090781 & 0.88862814045461 \tabularnewline
39 & 0.076733721946828 & 0.153467443893656 & 0.923266278053172 \tabularnewline
40 & 0.0448228278081524 & 0.0896456556163047 & 0.955177172191848 \tabularnewline
41 & 0.0393740703703052 & 0.0787481407406103 & 0.960625929629695 \tabularnewline
42 & 0.176319732602350 & 0.352639465204700 & 0.82368026739765 \tabularnewline
43 & 0.115318948033337 & 0.230637896066675 & 0.884681051966663 \tabularnewline
44 & 0.218847081077963 & 0.437694162155926 & 0.781152918922037 \tabularnewline
\hline
\end{tabular}
%Source: https://freestatistics.org/blog/index.php?pk=25491&T=5

[TABLE]
[ROW][C]Goldfeld-Quandt test for Heteroskedasticity[/C][/ROW]
[ROW][C]p-values[/C][C]Alternative Hypothesis[/C][/ROW]
[ROW][C]breakpoint index[/C][C]greater[/C][C]2-sided[/C][C]less[/C][/ROW]
[ROW][C]17[/C][C]0.360872597767115[/C][C]0.72174519553423[/C][C]0.639127402232885[/C][/ROW]
[ROW][C]18[/C][C]0.208953044857539[/C][C]0.417906089715078[/C][C]0.791046955142461[/C][/ROW]
[ROW][C]19[/C][C]0.118466834880343[/C][C]0.236933669760685[/C][C]0.881533165119657[/C][/ROW]
[ROW][C]20[/C][C]0.0602495005310285[/C][C]0.120499001062057[/C][C]0.939750499468971[/C][/ROW]
[ROW][C]21[/C][C]0.0277744062097939[/C][C]0.0555488124195878[/C][C]0.972225593790206[/C][/ROW]
[ROW][C]22[/C][C]0.0171008969278800[/C][C]0.0342017938557600[/C][C]0.98289910307212[/C][/ROW]
[ROW][C]23[/C][C]0.00726496280671998[/C][C]0.0145299256134400[/C][C]0.99273503719328[/C][/ROW]
[ROW][C]24[/C][C]0.00310757174662859[/C][C]0.00621514349325719[/C][C]0.996892428253371[/C][/ROW]
[ROW][C]25[/C][C]0.00211606202894106[/C][C]0.00423212405788212[/C][C]0.997883937971059[/C][/ROW]
[ROW][C]26[/C][C]0.00184014953391682[/C][C]0.00368029906783364[/C][C]0.998159850466083[/C][/ROW]
[ROW][C]27[/C][C]0.00102385008362358[/C][C]0.00204770016724717[/C][C]0.998976149916376[/C][/ROW]
[ROW][C]28[/C][C]0.000428174728882764[/C][C]0.000856349457765527[/C][C]0.999571825271117[/C][/ROW]
[ROW][C]29[/C][C]0.000308325777814765[/C][C]0.000616651555629531[/C][C]0.999691674222185[/C][/ROW]
[ROW][C]30[/C][C]0.000820624679045268[/C][C]0.00164124935809054[/C][C]0.999179375320955[/C][/ROW]
[ROW][C]31[/C][C]0.00287646316137178[/C][C]0.00575292632274355[/C][C]0.997123536838628[/C][/ROW]
[ROW][C]32[/C][C]0.00521628802840894[/C][C]0.0104325760568179[/C][C]0.994783711971591[/C][/ROW]
[ROW][C]33[/C][C]0.00537946588518623[/C][C]0.0107589317703725[/C][C]0.994620534114814[/C][/ROW]
[ROW][C]34[/C][C]0.0059737338504121[/C][C]0.0119474677008242[/C][C]0.994026266149588[/C][/ROW]
[ROW][C]35[/C][C]0.0203361147399709[/C][C]0.0406722294799419[/C][C]0.97966388526003[/C][/ROW]
[ROW][C]36[/C][C]0.0577925203129344[/C][C]0.115585040625869[/C][C]0.942207479687066[/C][/ROW]
[ROW][C]37[/C][C]0.170437068110018[/C][C]0.340874136220037[/C][C]0.829562931889982[/C][/ROW]
[ROW][C]38[/C][C]0.111371859545391[/C][C]0.222743719090781[/C][C]0.88862814045461[/C][/ROW]
[ROW][C]39[/C][C]0.076733721946828[/C][C]0.153467443893656[/C][C]0.923266278053172[/C][/ROW]
[ROW][C]40[/C][C]0.0448228278081524[/C][C]0.0896456556163047[/C][C]0.955177172191848[/C][/ROW]
[ROW][C]41[/C][C]0.0393740703703052[/C][C]0.0787481407406103[/C][C]0.960625929629695[/C][/ROW]
[ROW][C]42[/C][C]0.176319732602350[/C][C]0.352639465204700[/C][C]0.82368026739765[/C][/ROW]
[ROW][C]43[/C][C]0.115318948033337[/C][C]0.230637896066675[/C][C]0.884681051966663[/C][/ROW]
[ROW][C]44[/C][C]0.218847081077963[/C][C]0.437694162155926[/C][C]0.781152918922037[/C][/ROW]
[/TABLE]
Source: https://freestatistics.org/blog/index.php?pk=25491&T=5

Globally Unique Identifier (entire table): ba.freestatistics.org/blog/index.php?pk=25491&T=5

As an alternative you can also use a QR Code:  

The GUIDs for individual cells are displayed in the table below:

Goldfeld-Quandt test for Heteroskedasticity
p-valuesAlternative Hypothesis
breakpoint indexgreater2-sidedless
170.3608725977671150.721745195534230.639127402232885
180.2089530448575390.4179060897150780.791046955142461
190.1184668348803430.2369336697606850.881533165119657
200.06024950053102850.1204990010620570.939750499468971
210.02777440620979390.05554881241958780.972225593790206
220.01710089692788000.03420179385576000.98289910307212
230.007264962806719980.01452992561344000.99273503719328
240.003107571746628590.006215143493257190.996892428253371
250.002116062028941060.004232124057882120.997883937971059
260.001840149533916820.003680299067833640.998159850466083
270.001023850083623580.002047700167247170.998976149916376
280.0004281747288827640.0008563494577655270.999571825271117
290.0003083257778147650.0006166515556295310.999691674222185
300.0008206246790452680.001641249358090540.999179375320955
310.002876463161371780.005752926322743550.997123536838628
320.005216288028408940.01043257605681790.994783711971591
330.005379465885186230.01075893177037250.994620534114814
340.00597373385041210.01194746770082420.994026266149588
350.02033611473997090.04067222947994190.97966388526003
360.05779252031293440.1155850406258690.942207479687066
370.1704370681100180.3408741362200370.829562931889982
380.1113718595453910.2227437190907810.88862814045461
390.0767337219468280.1534674438936560.923266278053172
400.04482282780815240.08964565561630470.955177172191848
410.03937407037030520.07874814074061030.960625929629695
420.1763197326023500.3526394652047000.82368026739765
430.1153189480333370.2306378960666750.884681051966663
440.2188470810779630.4376941621559260.781152918922037


Meta Analysis of Goldfeld-Quandt test for Heteroskedasticity
Description# significant tests% significant testsOK/NOK
1% type I error level80.285714285714286NOK
5% type I error level140.5NOK
10% type I error level170.607142857142857NOK

\begin{tabular}{lllllllll}
\hline
Meta Analysis of Goldfeld-Quandt test for Heteroskedasticity \tabularnewline
Description & # significant tests & % significant tests & OK/NOK \tabularnewline
1% type I error level & 8 & 0.285714285714286 & NOK \tabularnewline
5% type I error level & 14 & 0.5 & NOK \tabularnewline
10% type I error level & 17 & 0.607142857142857 & NOK \tabularnewline
\hline
\end{tabular}
%Source: https://freestatistics.org/blog/index.php?pk=25491&T=6

[TABLE]
[ROW][C]Meta Analysis of Goldfeld-Quandt test for Heteroskedasticity[/C][/ROW]
[ROW][C]Description[/C][C]# significant tests[/C][C]% significant tests[/C][C]OK/NOK[/C][/ROW]
[ROW][C]1% type I error level[/C][C]8[/C][C]0.285714285714286[/C][C]NOK[/C][/ROW]
[ROW][C]5% type I error level[/C][C]14[/C][C]0.5[/C][C]NOK[/C][/ROW]
[ROW][C]10% type I error level[/C][C]17[/C][C]0.607142857142857[/C][C]NOK[/C][/ROW]
[/TABLE]
Source: https://freestatistics.org/blog/index.php?pk=25491&T=6

Globally Unique Identifier (entire table): ba.freestatistics.org/blog/index.php?pk=25491&T=6

As an alternative you can also use a QR Code:  

The GUIDs for individual cells are displayed in the table below:

Meta Analysis of Goldfeld-Quandt test for Heteroskedasticity
Description# significant tests% significant testsOK/NOK
1% type I error level80.285714285714286NOK
5% type I error level140.5NOK
10% type I error level170.607142857142857NOK


Parameters (Session):
par1 = 1 ; par2 = Include Monthly Dummies ; par3 = Linear Trend ;
Parameters (R input):
par1 = 1 ; par2 = Include Monthly Dummies ; par3 = Linear Trend ;
R code (references can be found in the software module):
library(lattice)
library(lmtest)
n25 <- 25 #minimum number of obs. for Goldfeld-Quandt test
par1 <- as.numeric(par1)
x <- t(y)
k <- length(x[1,])
n <- length(x[,1])
x1 <- cbind(x[,par1], x[,1:k!=par1])
mycolnames <- c(colnames(x)[par1], colnames(x)[1:k!=par1])
colnames(x1) <- mycolnames #colnames(x)[par1]
x <- x1
if (par3 == 'First Differences'){
x2 <- array(0, dim=c(n-1,k), dimnames=list(1:(n-1), paste('(1-B)',colnames(x),sep='')))
for (i in 1:n-1) {
for (j in 1:k) {
x2[i,j] <- x[i+1,j] - x[i,j]
}
}
x <- x2
}
if (par2 == 'Include Monthly Dummies'){
x2 <- array(0, dim=c(n,11), dimnames=list(1:n, paste('M', seq(1:11), sep ='')))
for (i in 1:11){
x2[seq(i,n,12),i] <- 1
}
x <- cbind(x, x2)
}
if (par2 == 'Include Quarterly Dummies'){
x2 <- array(0, dim=c(n,3), dimnames=list(1:n, paste('Q', seq(1:3), sep ='')))
for (i in 1:3){
x2[seq(i,n,4),i] <- 1
}
x <- cbind(x, x2)
}
k <- length(x[1,])
if (par3 == 'Linear Trend'){
x <- cbind(x, c(1:n))
colnames(x)[k+1] <- 't'
}
x
k <- length(x[1,])
df <- as.data.frame(x)
(mylm <- lm(df))
(mysum <- summary(mylm))
if (n > n25) {
kp3 <- k + 3
nmkm3 <- n - k - 3
gqarr <- array(NA, dim=c(nmkm3-kp3+1,3))
numgqtests <- 0
numsignificant1 <- 0
numsignificant5 <- 0
numsignificant10 <- 0
for (mypoint in kp3:nmkm3) {
j <- 0
numgqtests <- numgqtests + 1
for (myalt in c('greater', 'two.sided', 'less')) {
j <- j + 1
gqarr[mypoint-kp3+1,j] <- gqtest(mylm, point=mypoint, alternative=myalt)$p.value
}
if (gqarr[mypoint-kp3+1,2] < 0.01) numsignificant1 <- numsignificant1 + 1
if (gqarr[mypoint-kp3+1,2] < 0.05) numsignificant5 <- numsignificant5 + 1
if (gqarr[mypoint-kp3+1,2] < 0.10) numsignificant10 <- numsignificant10 + 1
}
gqarr
}
bitmap(file='test0.png')
plot(x[,1], type='l', main='Actuals and Interpolation', ylab='value of Actuals and Interpolation (dots)', xlab='time or index')
points(x[,1]-mysum$resid)
grid()
dev.off()
bitmap(file='test1.png')
plot(mysum$resid, type='b', pch=19, main='Residuals', ylab='value of Residuals', xlab='time or index')
grid()
dev.off()
bitmap(file='test2.png')
hist(mysum$resid, main='Residual Histogram', xlab='values of Residuals')
grid()
dev.off()
bitmap(file='test3.png')
densityplot(~mysum$resid,col='black',main='Residual Density Plot', xlab='values of Residuals')
dev.off()
bitmap(file='test4.png')
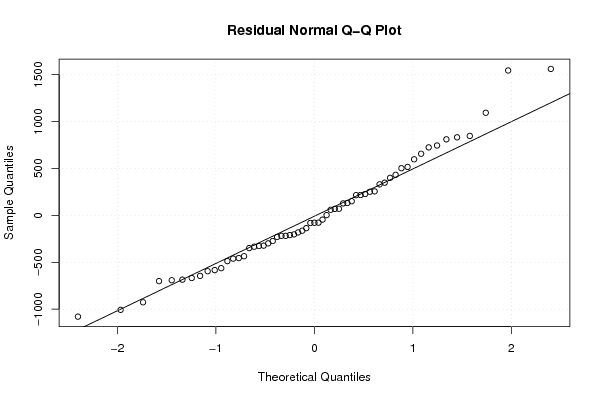
qqnorm(mysum$resid, main='Residual Normal Q-Q Plot')
qqline(mysum$resid)
grid()
dev.off()
(myerror <- as.ts(mysum$resid))
bitmap(file='test5.png')
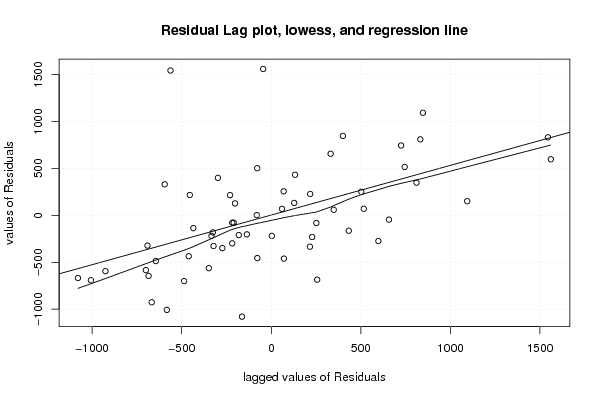
dum <- cbind(lag(myerror,k=1),myerror)
dum
dum1 <- dum[2:length(myerror),]
dum1
z <- as.data.frame(dum1)
z
plot(z,main=paste('Residual Lag plot, lowess, and regression line'), ylab='values of Residuals', xlab='lagged values of Residuals')
lines(lowess(z))
abline(lm(z))
grid()
dev.off()
bitmap(file='test6.png')
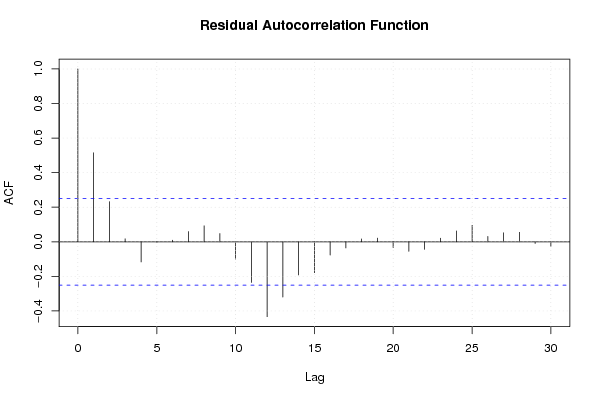
acf(mysum$resid, lag.max=length(mysum$resid)/2, main='Residual Autocorrelation Function')
grid()
dev.off()
bitmap(file='test7.png')
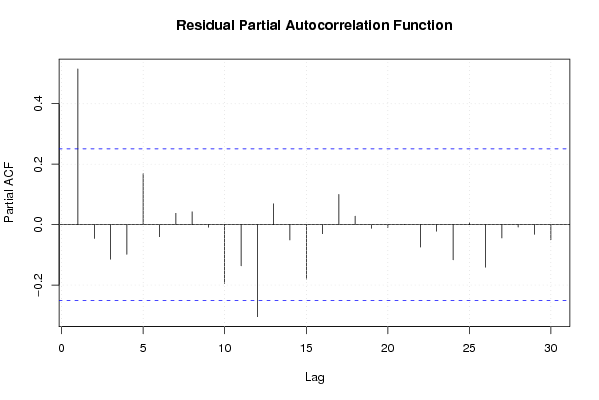
pacf(mysum$resid, lag.max=length(mysum$resid)/2, main='Residual Partial Autocorrelation Function')
grid()
dev.off()
bitmap(file='test8.png')
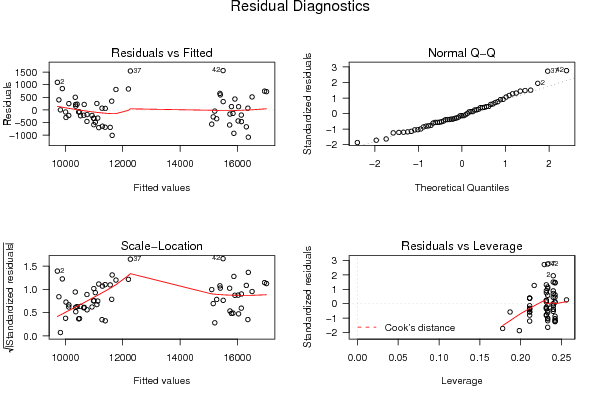
opar <- par(mfrow = c(2,2), oma = c(0, 0, 1.1, 0))
plot(mylm, las = 1, sub='Residual Diagnostics')
par(opar)
dev.off()
if (n > n25) {
bitmap(file='test9.png')
plot(kp3:nmkm3,gqarr[,2], main='Goldfeld-Quandt test',ylab='2-sided p-value',xlab='breakpoint')
grid()
dev.off()
}
load(file='createtable')
a<-table.start()
a<-table.row.start(a)
a<-table.element(a, 'Multiple Linear Regression - Estimated Regression Equation', 1, TRUE)
a<-table.row.end(a)
myeq <- colnames(x)[1]
myeq <- paste(myeq, '[t] = ', sep='')
for (i in 1:k){
if (mysum$coefficients[i,1] > 0) myeq <- paste(myeq, '+', '')
myeq <- paste(myeq, mysum$coefficients[i,1], sep=' ')
if (rownames(mysum$coefficients)[i] != '(Intercept)') {
myeq <- paste(myeq, rownames(mysum$coefficients)[i], sep='')
if (rownames(mysum$coefficients)[i] != 't') myeq <- paste(myeq, '[t]', sep='')
}
}
myeq <- paste(myeq, ' + e[t]')
a<-table.row.start(a)
a<-table.element(a, myeq)
a<-table.row.end(a)
a<-table.end(a)
table.save(a,file='mytable1.tab')
a<-table.start()
a<-table.row.start(a)
a<-table.element(a,hyperlink('ols1.htm','Multiple Linear Regression - Ordinary Least Squares',''), 6, TRUE)
a<-table.row.end(a)
a<-table.row.start(a)
a<-table.element(a,'Variable',header=TRUE)
a<-table.element(a,'Parameter',header=TRUE)
a<-table.element(a,'S.D.',header=TRUE)
a<-table.element(a,'T-STAT
H0: parameter = 0',header=TRUE)
a<-table.element(a,'2-tail p-value',header=TRUE)
a<-table.element(a,'1-tail p-value',header=TRUE)
a<-table.row.end(a)
for (i in 1:k){
a<-table.row.start(a)
a<-table.element(a,rownames(mysum$coefficients)[i],header=TRUE)
a<-table.element(a,mysum$coefficients[i,1])
a<-table.element(a, round(mysum$coefficients[i,2],6))
a<-table.element(a, round(mysum$coefficients[i,3],4))
a<-table.element(a, round(mysum$coefficients[i,4],6))
a<-table.element(a, round(mysum$coefficients[i,4]/2,6))
a<-table.row.end(a)
}
a<-table.end(a)
table.save(a,file='mytable2.tab')
a<-table.start()
a<-table.row.start(a)
a<-table.element(a, 'Multiple Linear Regression - Regression Statistics', 2, TRUE)
a<-table.row.end(a)
a<-table.row.start(a)
a<-table.element(a, 'Multiple R',1,TRUE)
a<-table.element(a, sqrt(mysum$r.squared))
a<-table.row.end(a)
a<-table.row.start(a)
a<-table.element(a, 'R-squared',1,TRUE)
a<-table.element(a, mysum$r.squared)
a<-table.row.end(a)
a<-table.row.start(a)
a<-table.element(a, 'Adjusted R-squared',1,TRUE)
a<-table.element(a, mysum$adj.r.squared)
a<-table.row.end(a)
a<-table.row.start(a)
a<-table.element(a, 'F-TEST (value)',1,TRUE)
a<-table.element(a, mysum$fstatistic[1])
a<-table.row.end(a)
a<-table.row.start(a)
a<-table.element(a, 'F-TEST (DF numerator)',1,TRUE)
a<-table.element(a, mysum$fstatistic[2])
a<-table.row.end(a)
a<-table.row.start(a)
a<-table.element(a, 'F-TEST (DF denominator)',1,TRUE)
a<-table.element(a, mysum$fstatistic[3])
a<-table.row.end(a)
a<-table.row.start(a)
a<-table.element(a, 'p-value',1,TRUE)
a<-table.element(a, 1-pf(mysum$fstatistic[1],mysum$fstatistic[2],mysum$fstatistic[3]))
a<-table.row.end(a)
a<-table.row.start(a)
a<-table.element(a, 'Multiple Linear Regression - Residual Statistics', 2, TRUE)
a<-table.row.end(a)
a<-table.row.start(a)
a<-table.element(a, 'Residual Standard Deviation',1,TRUE)
a<-table.element(a, mysum$sigma)
a<-table.row.end(a)
a<-table.row.start(a)
a<-table.element(a, 'Sum Squared Residuals',1,TRUE)
a<-table.element(a, sum(myerror*myerror))
a<-table.row.end(a)
a<-table.end(a)
table.save(a,file='mytable3.tab')
a<-table.start()
a<-table.row.start(a)
a<-table.element(a, 'Multiple Linear Regression - Actuals, Interpolation, and Residuals', 4, TRUE)
a<-table.row.end(a)
a<-table.row.start(a)
a<-table.element(a, 'Time or Index', 1, TRUE)
a<-table.element(a, 'Actuals', 1, TRUE)
a<-table.element(a, 'Interpolation
Forecast', 1, TRUE)
a<-table.element(a, 'Residuals
Prediction Error', 1, TRUE)
a<-table.row.end(a)
for (i in 1:n) {
a<-table.row.start(a)
a<-table.element(a,i, 1, TRUE)
a<-table.element(a,x[i])
a<-table.element(a,x[i]-mysum$resid[i])
a<-table.element(a,mysum$resid[i])
a<-table.row.end(a)
}
a<-table.end(a)
table.save(a,file='mytable4.tab')
if (n > n25) {
a<-table.start()
a<-table.row.start(a)
a<-table.element(a,'Goldfeld-Quandt test for Heteroskedasticity',4,TRUE)
a<-table.row.end(a)
a<-table.row.start(a)
a<-table.element(a,'p-values',header=TRUE)
a<-table.element(a,'Alternative Hypothesis',3,header=TRUE)
a<-table.row.end(a)
a<-table.row.start(a)
a<-table.element(a,'breakpoint index',header=TRUE)
a<-table.element(a,'greater',header=TRUE)
a<-table.element(a,'2-sided',header=TRUE)
a<-table.element(a,'less',header=TRUE)
a<-table.row.end(a)
for (mypoint in kp3:nmkm3) {
a<-table.row.start(a)
a<-table.element(a,mypoint,header=TRUE)
a<-table.element(a,gqarr[mypoint-kp3+1,1])
a<-table.element(a,gqarr[mypoint-kp3+1,2])
a<-table.element(a,gqarr[mypoint-kp3+1,3])
a<-table.row.end(a)
}
a<-table.end(a)
table.save(a,file='mytable5.tab')
a<-table.start()
a<-table.row.start(a)
a<-table.element(a,'Meta Analysis of Goldfeld-Quandt test for Heteroskedasticity',4,TRUE)
a<-table.row.end(a)
a<-table.row.start(a)
a<-table.element(a,'Description',header=TRUE)
a<-table.element(a,'# significant tests',header=TRUE)
a<-table.element(a,'% significant tests',header=TRUE)
a<-table.element(a,'OK/NOK',header=TRUE)
a<-table.row.end(a)
a<-table.row.start(a)
a<-table.element(a,'1% type I error level',header=TRUE)
a<-table.element(a,numsignificant1)
a<-table.element(a,numsignificant1/numgqtests)
if (numsignificant1/numgqtests < 0.01) dum <- 'OK' else dum <- 'NOK'
a<-table.element(a,dum)
a<-table.row.end(a)
a<-table.row.start(a)
a<-table.element(a,'5% type I error level',header=TRUE)
a<-table.element(a,numsignificant5)
a<-table.element(a,numsignificant5/numgqtests)
if (numsignificant5/numgqtests < 0.05) dum <- 'OK' else dum <- 'NOK'
a<-table.element(a,dum)
a<-table.row.end(a)
a<-table.row.start(a)
a<-table.element(a,'10% type I error level',header=TRUE)
a<-table.element(a,numsignificant10)
a<-table.element(a,numsignificant10/numgqtests)
if (numsignificant10/numgqtests < 0.1) dum <- 'OK' else dum <- 'NOK'
a<-table.element(a,dum)
a<-table.row.end(a)
a<-table.end(a)
table.save(a,file='mytable6.tab')
}