Free Statistics

of Irreproducible Research!

Author's title

Author*The author of this computation has been verified*
R Software Modulerwasp_multipleregression.wasp
Title produced by softwareMultiple Regression
Date of computationMon, 24 Nov 2008 11:37:50 -0700
Cite this page as followsStatistical Computations at FreeStatistics.org, Office for Research Development and Education, URL https://freestatistics.org/blog/index.php?v=date/2008/Nov/24/t12275520008e35gggr8yqwpbs.htm/, Retrieved Tue, 14 May 2024 15:53:07 +0000
Statistical Computations at FreeStatistics.org, Office for Research Development and Education, URL https://freestatistics.org/blog/index.php?pk=25486, Retrieved Tue, 14 May 2024 15:53:07 +0000
QR Codes:

Original text written by user:
IsPrivate?No (this computation is public)
User-defined keywords
Estimated Impact166
Family? (F = Feedback message, R = changed R code, M = changed R Module, P = changed Parameters, D = changed Data)
-     [Multiple Regression] [Q1 The Seatbeltlaw] [2007-11-14 19:27:43] [8cd6641b921d30ebe00b648d1481bba0]
F    D  [Multiple Regression] [Q1] [2008-11-21 12:42:10] [fad8a251ac01c156a8ae23a83577546f]
F    D      [Multiple Regression] [] [2008-11-24 18:37:50] [fa8b44cd657c07c6ee11bb2476ca3f8d] [Current]
Feedback Forum
2008-11-29 14:44:03 [Jeroen Michel] [reply
Ook hier pas je een gelijkaardige techniek toe zoals in Q1. Ik moet je er wel op wijzen dat je spreekt van een verzonnen tijdreeks? Ik neem aan dat je voor je gekozen tijdreeks toch een bron kan opgeven? Indien moet je dit dringend doen. Iets verzinnen kan echter niet daar je zelf een verloop gaat kiezen...

Voor de rest probeer je ook hier de tabellen toe te lichten zoals in Q1, maar blijft het nogal beperkt. Hier verwijs ik weer naar de feedback gegeven bij Q1 (zie onderstaande link):

http://www.freestatistics.org/blog/index.php?v=date/2008/Nov/21/t1227271454qd65tbur6cityjq.htm

Post a new message
Dataseries X:
56983	0
57942	0
34857	0
39421	0
45612	0
65410	0
50125	0
46879	0
53875	0
49652	0
54167	0
61558	0
56874	0
51966	0
45897	0
46832	0
47852	0
58236	0
54216	0
52687	0
47659	0
50089	0
51247	0
48658	0
47233	0
46988	0
51784	0
53620	0
51479	0
50007	0
52634	0
49566	0
48522	0
53864	0
51477	0
56214	0
60032	0
57862	0
55684	0
75894	1
80564	1
84562	1
87546	1
83654	1
89745	1
79565	1
78498	1
79468	1
82479	1
84675	1
85479	1
83547	1
89654	1
84523	1
87469	1
87985	1
88423	1
90475	1
86542	1
87963	1


Summary of computational transaction
Raw Inputview raw input (R code)
Raw Outputview raw output of R engine
Computing time5 seconds
R Server'Sir Ronald Aylmer Fisher' @ 193.190.124.24

\begin{tabular}{lllllllll}
\hline
Summary of computational transaction \tabularnewline
Raw Input & view raw input (R code)  \tabularnewline
Raw Output & view raw output of R engine  \tabularnewline
Computing time & 5 seconds \tabularnewline
R Server & 'Sir Ronald Aylmer Fisher' @ 193.190.124.24 \tabularnewline
\hline
\end{tabular}
%Source: https://freestatistics.org/blog/index.php?pk=25486&T=0

[TABLE]
[ROW][C]Summary of computational transaction[/C][/ROW]
[ROW][C]Raw Input[/C][C]view raw input (R code) [/C][/ROW]
[ROW][C]Raw Output[/C][C]view raw output of R engine [/C][/ROW]
[ROW][C]Computing time[/C][C]5 seconds[/C][/ROW]
[ROW][C]R Server[/C][C]'Sir Ronald Aylmer Fisher' @ 193.190.124.24[/C][/ROW]
[/TABLE]
Source: https://freestatistics.org/blog/index.php?pk=25486&T=0

Globally Unique Identifier (entire table): ba.freestatistics.org/blog/index.php?pk=25486&T=0

As an alternative you can also use a QR Code:  

The GUIDs for individual cells are displayed in the table below:

Summary of computational transaction
Raw Inputview raw input (R code)
Raw Outputview raw output of R engine
Computing time5 seconds
R Server'Sir Ronald Aylmer Fisher' @ 193.190.124.24


Multiple Linear Regression - Estimated Regression Equation
y[t] = + 50587.8084848485 + 29350.0787878788x[t] + 1176.01464646464M1[t] + 218.960202020203M2[t] -5050.89424242424M3[t] -5921.76444444444M4[t] -2875.81888888889M5[t] + 2516.12666666667M6[t] + 243.072222222224M7[t] -2124.18222222222M8[t] -757.036666666666M9[t] -1796.29111111111M10[t] -2262.54555555555M11[t] + 123.454444444445t + e[t]

\begin{tabular}{lllllllll}
\hline
Multiple Linear Regression - Estimated Regression Equation \tabularnewline
y[t] =  +  50587.8084848485 +  29350.0787878788x[t] +  1176.01464646464M1[t] +  218.960202020203M2[t] -5050.89424242424M3[t] -5921.76444444444M4[t] -2875.81888888889M5[t] +  2516.12666666667M6[t] +  243.072222222224M7[t] -2124.18222222222M8[t] -757.036666666666M9[t] -1796.29111111111M10[t] -2262.54555555555M11[t] +  123.454444444445t  + e[t] \tabularnewline
\hline
\end{tabular}
%Source: https://freestatistics.org/blog/index.php?pk=25486&T=1

[TABLE]
[ROW][C]Multiple Linear Regression - Estimated Regression Equation[/C][/ROW]
[ROW][C]y[t] =  +  50587.8084848485 +  29350.0787878788x[t] +  1176.01464646464M1[t] +  218.960202020203M2[t] -5050.89424242424M3[t] -5921.76444444444M4[t] -2875.81888888889M5[t] +  2516.12666666667M6[t] +  243.072222222224M7[t] -2124.18222222222M8[t] -757.036666666666M9[t] -1796.29111111111M10[t] -2262.54555555555M11[t] +  123.454444444445t  + e[t][/C][/ROW]
[/TABLE]
Source: https://freestatistics.org/blog/index.php?pk=25486&T=1

Globally Unique Identifier (entire table): ba.freestatistics.org/blog/index.php?pk=25486&T=1

As an alternative you can also use a QR Code:  

The GUIDs for individual cells are displayed in the table below:

Multiple Linear Regression - Estimated Regression Equation
y[t] = + 50587.8084848485 + 29350.0787878788x[t] + 1176.01464646464M1[t] + 218.960202020203M2[t] -5050.89424242424M3[t] -5921.76444444444M4[t] -2875.81888888889M5[t] + 2516.12666666667M6[t] + 243.072222222224M7[t] -2124.18222222222M8[t] -757.036666666666M9[t] -1796.29111111111M10[t] -2262.54555555555M11[t] + 123.454444444445t + e[t]


Multiple Linear Regression - Ordinary Least Squares
VariableParameterS.D.T-STATH0: parameter = 02-tail p-value1-tail p-value
(Intercept)50587.80848484852826.58523517.897100
x29350.07878787882464.8994611.907200
M11176.014646464643196.3932160.36790.7146210.357311
M2218.9602020202033189.8524970.06860.9455720.472786
M3-5050.894242424243184.755984-1.5860.11960.0598
M4-5921.764444444443212.785253-1.84320.071750.035875
M5-2875.818888888893201.93244-0.89820.3737820.186891
M62516.126666666673192.4968250.78810.4346590.21733
M7243.0722222222243184.4910080.07630.9394880.469744
M8-2124.182222222223177.925792-0.66840.5072070.253604
M9-757.0366666666663172.810121-0.23860.8124750.406237
M10-1796.291111111113169.151014-0.56680.5736020.286801
M11-2262.545555555553166.953521-0.71440.4785750.239288
t123.45444444444568.1262221.81210.0764940.038247

\begin{tabular}{lllllllll}
\hline
Multiple Linear Regression - Ordinary Least Squares \tabularnewline
Variable & Parameter & S.D. & T-STATH0: parameter = 0 & 2-tail p-value & 1-tail p-value \tabularnewline
(Intercept) & 50587.8084848485 & 2826.585235 & 17.8971 & 0 & 0 \tabularnewline
x & 29350.0787878788 & 2464.89946 & 11.9072 & 0 & 0 \tabularnewline
M1 & 1176.01464646464 & 3196.393216 & 0.3679 & 0.714621 & 0.357311 \tabularnewline
M2 & 218.960202020203 & 3189.852497 & 0.0686 & 0.945572 & 0.472786 \tabularnewline
M3 & -5050.89424242424 & 3184.755984 & -1.586 & 0.1196 & 0.0598 \tabularnewline
M4 & -5921.76444444444 & 3212.785253 & -1.8432 & 0.07175 & 0.035875 \tabularnewline
M5 & -2875.81888888889 & 3201.93244 & -0.8982 & 0.373782 & 0.186891 \tabularnewline
M6 & 2516.12666666667 & 3192.496825 & 0.7881 & 0.434659 & 0.21733 \tabularnewline
M7 & 243.072222222224 & 3184.491008 & 0.0763 & 0.939488 & 0.469744 \tabularnewline
M8 & -2124.18222222222 & 3177.925792 & -0.6684 & 0.507207 & 0.253604 \tabularnewline
M9 & -757.036666666666 & 3172.810121 & -0.2386 & 0.812475 & 0.406237 \tabularnewline
M10 & -1796.29111111111 & 3169.151014 & -0.5668 & 0.573602 & 0.286801 \tabularnewline
M11 & -2262.54555555555 & 3166.953521 & -0.7144 & 0.478575 & 0.239288 \tabularnewline
t & 123.454444444445 & 68.126222 & 1.8121 & 0.076494 & 0.038247 \tabularnewline
\hline
\end{tabular}
%Source: https://freestatistics.org/blog/index.php?pk=25486&T=2

[TABLE]
[ROW][C]Multiple Linear Regression - Ordinary Least Squares[/C][/ROW]
[ROW][C]Variable[/C][C]Parameter[/C][C]S.D.[/C][C]T-STATH0: parameter = 0[/C][C]2-tail p-value[/C][C]1-tail p-value[/C][/ROW]
[ROW][C](Intercept)[/C][C]50587.8084848485[/C][C]2826.585235[/C][C]17.8971[/C][C]0[/C][C]0[/C][/ROW]
[ROW][C]x[/C][C]29350.0787878788[/C][C]2464.89946[/C][C]11.9072[/C][C]0[/C][C]0[/C][/ROW]
[ROW][C]M1[/C][C]1176.01464646464[/C][C]3196.393216[/C][C]0.3679[/C][C]0.714621[/C][C]0.357311[/C][/ROW]
[ROW][C]M2[/C][C]218.960202020203[/C][C]3189.852497[/C][C]0.0686[/C][C]0.945572[/C][C]0.472786[/C][/ROW]
[ROW][C]M3[/C][C]-5050.89424242424[/C][C]3184.755984[/C][C]-1.586[/C][C]0.1196[/C][C]0.0598[/C][/ROW]
[ROW][C]M4[/C][C]-5921.76444444444[/C][C]3212.785253[/C][C]-1.8432[/C][C]0.07175[/C][C]0.035875[/C][/ROW]
[ROW][C]M5[/C][C]-2875.81888888889[/C][C]3201.93244[/C][C]-0.8982[/C][C]0.373782[/C][C]0.186891[/C][/ROW]
[ROW][C]M6[/C][C]2516.12666666667[/C][C]3192.496825[/C][C]0.7881[/C][C]0.434659[/C][C]0.21733[/C][/ROW]
[ROW][C]M7[/C][C]243.072222222224[/C][C]3184.491008[/C][C]0.0763[/C][C]0.939488[/C][C]0.469744[/C][/ROW]
[ROW][C]M8[/C][C]-2124.18222222222[/C][C]3177.925792[/C][C]-0.6684[/C][C]0.507207[/C][C]0.253604[/C][/ROW]
[ROW][C]M9[/C][C]-757.036666666666[/C][C]3172.810121[/C][C]-0.2386[/C][C]0.812475[/C][C]0.406237[/C][/ROW]
[ROW][C]M10[/C][C]-1796.29111111111[/C][C]3169.151014[/C][C]-0.5668[/C][C]0.573602[/C][C]0.286801[/C][/ROW]
[ROW][C]M11[/C][C]-2262.54555555555[/C][C]3166.953521[/C][C]-0.7144[/C][C]0.478575[/C][C]0.239288[/C][/ROW]
[ROW][C]t[/C][C]123.454444444445[/C][C]68.126222[/C][C]1.8121[/C][C]0.076494[/C][C]0.038247[/C][/ROW]
[/TABLE]
Source: https://freestatistics.org/blog/index.php?pk=25486&T=2

Globally Unique Identifier (entire table): ba.freestatistics.org/blog/index.php?pk=25486&T=2

As an alternative you can also use a QR Code:  

The GUIDs for individual cells are displayed in the table below:

Multiple Linear Regression - Ordinary Least Squares
VariableParameterS.D.T-STATH0: parameter = 02-tail p-value1-tail p-value
(Intercept)50587.80848484852826.58523517.897100
x29350.07878787882464.8994611.907200
M11176.014646464643196.3932160.36790.7146210.357311
M2218.9602020202033189.8524970.06860.9455720.472786
M3-5050.894242424243184.755984-1.5860.11960.0598
M4-5921.764444444443212.785253-1.84320.071750.035875
M5-2875.818888888893201.93244-0.89820.3737820.186891
M62516.126666666673192.4968250.78810.4346590.21733
M7243.0722222222243184.4910080.07630.9394880.469744
M8-2124.182222222223177.925792-0.66840.5072070.253604
M9-757.0366666666663172.810121-0.23860.8124750.406237
M10-1796.291111111113169.151014-0.56680.5736020.286801
M11-2262.545555555553166.953521-0.71440.4785750.239288
t123.45444444444568.1262221.81210.0764940.038247


Multiple Linear Regression - Regression Statistics
Multiple R0.96435964366221
R-squared0.929989522324306
Adjusted R-squared0.910203952546393
F-TEST (value)47.0034238469317
F-TEST (DF numerator)13
F-TEST (DF denominator)46
p-value0
Multiple Linear Regression - Residual Statistics
Residual Standard Deviation5006.23446900787
Sum Squared Residuals1152869643.69939

\begin{tabular}{lllllllll}
\hline
Multiple Linear Regression - Regression Statistics \tabularnewline
Multiple R & 0.96435964366221 \tabularnewline
R-squared & 0.929989522324306 \tabularnewline
Adjusted R-squared & 0.910203952546393 \tabularnewline
F-TEST (value) & 47.0034238469317 \tabularnewline
F-TEST (DF numerator) & 13 \tabularnewline
F-TEST (DF denominator) & 46 \tabularnewline
p-value & 0 \tabularnewline
Multiple Linear Regression - Residual Statistics \tabularnewline
Residual Standard Deviation & 5006.23446900787 \tabularnewline
Sum Squared Residuals & 1152869643.69939 \tabularnewline
\hline
\end{tabular}
%Source: https://freestatistics.org/blog/index.php?pk=25486&T=3

[TABLE]
[ROW][C]Multiple Linear Regression - Regression Statistics[/C][/ROW]
[ROW][C]Multiple R[/C][C]0.96435964366221[/C][/ROW]
[ROW][C]R-squared[/C][C]0.929989522324306[/C][/ROW]
[ROW][C]Adjusted R-squared[/C][C]0.910203952546393[/C][/ROW]
[ROW][C]F-TEST (value)[/C][C]47.0034238469317[/C][/ROW]
[ROW][C]F-TEST (DF numerator)[/C][C]13[/C][/ROW]
[ROW][C]F-TEST (DF denominator)[/C][C]46[/C][/ROW]
[ROW][C]p-value[/C][C]0[/C][/ROW]
[ROW][C]Multiple Linear Regression - Residual Statistics[/C][/ROW]
[ROW][C]Residual Standard Deviation[/C][C]5006.23446900787[/C][/ROW]
[ROW][C]Sum Squared Residuals[/C][C]1152869643.69939[/C][/ROW]
[/TABLE]
Source: https://freestatistics.org/blog/index.php?pk=25486&T=3

Globally Unique Identifier (entire table): ba.freestatistics.org/blog/index.php?pk=25486&T=3

As an alternative you can also use a QR Code:  

The GUIDs for individual cells are displayed in the table below:

Multiple Linear Regression - Regression Statistics
Multiple R0.96435964366221
R-squared0.929989522324306
Adjusted R-squared0.910203952546393
F-TEST (value)47.0034238469317
F-TEST (DF numerator)13
F-TEST (DF denominator)46
p-value0
Multiple Linear Regression - Residual Statistics
Residual Standard Deviation5006.23446900787
Sum Squared Residuals1152869643.69939


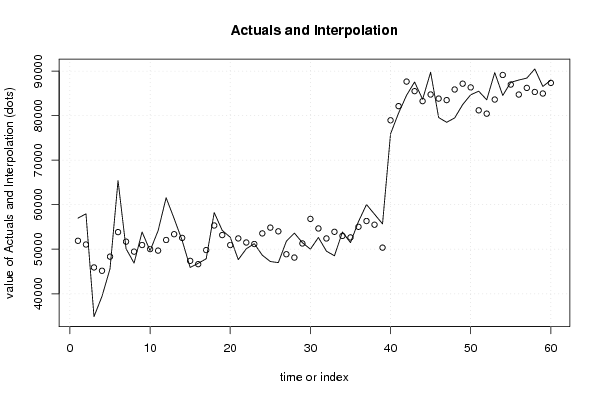
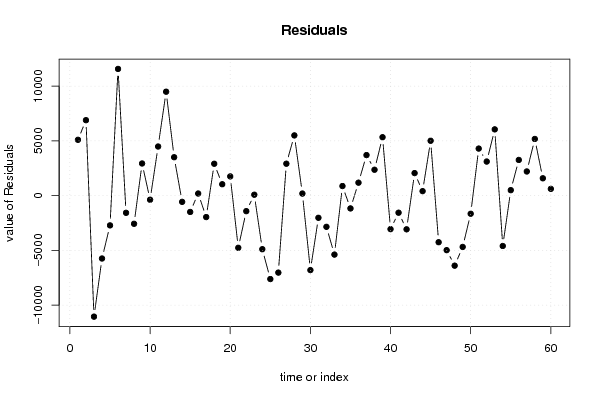
Multiple Linear Regression - Actuals, Interpolation, and Residuals
Time or IndexActualsInterpolationForecastResidualsPrediction Error
15698351887.27757575765095.72242424238
25794251053.67757575766888.32242424243
33485745907.2775757576-11050.2775757576
43942145159.8618181818-5738.86181818182
54561248329.2618181818-2717.26181818182
66541053844.661818181811565.3381818182
75012551695.0618181818-1570.06181818181
84687949451.2618181818-2572.26181818182
95387550941.86181818182933.13818181818
104965250026.0618181818-374.061818181817
115416749683.26181818184483.73818181818
126155852069.26181818189488.73818181819
135687453368.73090909093505.26909090910
145196652535.1309090909-569.130909090908
154589747388.7309090909-1491.73090909091
164683246641.3151515152190.684848484847
174785249810.7151515151-1958.71515151515
185823655326.11515151522909.88484848485
195421653176.51515151521039.48484848485
205268750932.71515151511754.28484848485
214765952423.3151515152-4764.31515151515
225008951507.5151515152-1418.51515151515
235124751164.715151515182.2848484848486
244865853550.7151515151-4892.71515151515
254723354850.1842424242-7617.18424242423
264698854016.5842424242-7028.58424242424
275178448870.18424242422913.81575757576
285362048122.76848484855497.23151515151
295147951292.1684848485186.831515151514
305000756807.5684848485-6800.56848484849
315263454657.9684848485-2023.96848484849
324956652414.1684848485-2848.16848484849
334852253904.7684848485-5382.76848484849
345386452988.9684848485875.031515151515
355147752646.1684848485-1169.16848484849
365621455032.16848484851181.83151515151
376003256331.63757575763700.36242424243
385786255498.03757575762363.96242424242
395568450351.63757575765332.36242424242
407589478954.3006060606-3060.30060606061
418056482123.7006060606-1559.70060606060
428456287639.1006060606-3077.10060606061
438754685489.50060606062056.49939393939
448365483245.7006060606408.299393939395
458974584736.30060606065008.6993939394
467956583820.5006060606-4255.50060606061
477849883477.7006060606-4979.7006060606
487946885863.7006060606-6395.7006060606
498247987163.1696969697-4684.16969696969
508467586329.5696969697-1654.56969696970
518547981183.16969696974295.83030303031
528354780435.7539393943111.24606060606
538965483605.1539393946048.84606060606
548452389120.553939394-4597.55393939394
558746986970.953939394498.046060606059
568798584727.1539393943257.84606060606
578842386217.7539393942205.24606060606
589047585301.9539393945173.04606060606
598654284959.1539393941582.84606060606
608796387345.153939394617.846060606059

\begin{tabular}{lllllllll}
\hline
Multiple Linear Regression - Actuals, Interpolation, and Residuals \tabularnewline
Time or Index & Actuals & InterpolationForecast & ResidualsPrediction Error \tabularnewline
1 & 56983 & 51887.2775757576 & 5095.72242424238 \tabularnewline
2 & 57942 & 51053.6775757576 & 6888.32242424243 \tabularnewline
3 & 34857 & 45907.2775757576 & -11050.2775757576 \tabularnewline
4 & 39421 & 45159.8618181818 & -5738.86181818182 \tabularnewline
5 & 45612 & 48329.2618181818 & -2717.26181818182 \tabularnewline
6 & 65410 & 53844.6618181818 & 11565.3381818182 \tabularnewline
7 & 50125 & 51695.0618181818 & -1570.06181818181 \tabularnewline
8 & 46879 & 49451.2618181818 & -2572.26181818182 \tabularnewline
9 & 53875 & 50941.8618181818 & 2933.13818181818 \tabularnewline
10 & 49652 & 50026.0618181818 & -374.061818181817 \tabularnewline
11 & 54167 & 49683.2618181818 & 4483.73818181818 \tabularnewline
12 & 61558 & 52069.2618181818 & 9488.73818181819 \tabularnewline
13 & 56874 & 53368.7309090909 & 3505.26909090910 \tabularnewline
14 & 51966 & 52535.1309090909 & -569.130909090908 \tabularnewline
15 & 45897 & 47388.7309090909 & -1491.73090909091 \tabularnewline
16 & 46832 & 46641.3151515152 & 190.684848484847 \tabularnewline
17 & 47852 & 49810.7151515151 & -1958.71515151515 \tabularnewline
18 & 58236 & 55326.1151515152 & 2909.88484848485 \tabularnewline
19 & 54216 & 53176.5151515152 & 1039.48484848485 \tabularnewline
20 & 52687 & 50932.7151515151 & 1754.28484848485 \tabularnewline
21 & 47659 & 52423.3151515152 & -4764.31515151515 \tabularnewline
22 & 50089 & 51507.5151515152 & -1418.51515151515 \tabularnewline
23 & 51247 & 51164.7151515151 & 82.2848484848486 \tabularnewline
24 & 48658 & 53550.7151515151 & -4892.71515151515 \tabularnewline
25 & 47233 & 54850.1842424242 & -7617.18424242423 \tabularnewline
26 & 46988 & 54016.5842424242 & -7028.58424242424 \tabularnewline
27 & 51784 & 48870.1842424242 & 2913.81575757576 \tabularnewline
28 & 53620 & 48122.7684848485 & 5497.23151515151 \tabularnewline
29 & 51479 & 51292.1684848485 & 186.831515151514 \tabularnewline
30 & 50007 & 56807.5684848485 & -6800.56848484849 \tabularnewline
31 & 52634 & 54657.9684848485 & -2023.96848484849 \tabularnewline
32 & 49566 & 52414.1684848485 & -2848.16848484849 \tabularnewline
33 & 48522 & 53904.7684848485 & -5382.76848484849 \tabularnewline
34 & 53864 & 52988.9684848485 & 875.031515151515 \tabularnewline
35 & 51477 & 52646.1684848485 & -1169.16848484849 \tabularnewline
36 & 56214 & 55032.1684848485 & 1181.83151515151 \tabularnewline
37 & 60032 & 56331.6375757576 & 3700.36242424243 \tabularnewline
38 & 57862 & 55498.0375757576 & 2363.96242424242 \tabularnewline
39 & 55684 & 50351.6375757576 & 5332.36242424242 \tabularnewline
40 & 75894 & 78954.3006060606 & -3060.30060606061 \tabularnewline
41 & 80564 & 82123.7006060606 & -1559.70060606060 \tabularnewline
42 & 84562 & 87639.1006060606 & -3077.10060606061 \tabularnewline
43 & 87546 & 85489.5006060606 & 2056.49939393939 \tabularnewline
44 & 83654 & 83245.7006060606 & 408.299393939395 \tabularnewline
45 & 89745 & 84736.3006060606 & 5008.6993939394 \tabularnewline
46 & 79565 & 83820.5006060606 & -4255.50060606061 \tabularnewline
47 & 78498 & 83477.7006060606 & -4979.7006060606 \tabularnewline
48 & 79468 & 85863.7006060606 & -6395.7006060606 \tabularnewline
49 & 82479 & 87163.1696969697 & -4684.16969696969 \tabularnewline
50 & 84675 & 86329.5696969697 & -1654.56969696970 \tabularnewline
51 & 85479 & 81183.1696969697 & 4295.83030303031 \tabularnewline
52 & 83547 & 80435.753939394 & 3111.24606060606 \tabularnewline
53 & 89654 & 83605.153939394 & 6048.84606060606 \tabularnewline
54 & 84523 & 89120.553939394 & -4597.55393939394 \tabularnewline
55 & 87469 & 86970.953939394 & 498.046060606059 \tabularnewline
56 & 87985 & 84727.153939394 & 3257.84606060606 \tabularnewline
57 & 88423 & 86217.753939394 & 2205.24606060606 \tabularnewline
58 & 90475 & 85301.953939394 & 5173.04606060606 \tabularnewline
59 & 86542 & 84959.153939394 & 1582.84606060606 \tabularnewline
60 & 87963 & 87345.153939394 & 617.846060606059 \tabularnewline
\hline
\end{tabular}
%Source: https://freestatistics.org/blog/index.php?pk=25486&T=4

[TABLE]
[ROW][C]Multiple Linear Regression - Actuals, Interpolation, and Residuals[/C][/ROW]
[ROW][C]Time or Index[/C][C]Actuals[/C][C]InterpolationForecast[/C][C]ResidualsPrediction Error[/C][/ROW]
[ROW][C]1[/C][C]56983[/C][C]51887.2775757576[/C][C]5095.72242424238[/C][/ROW]
[ROW][C]2[/C][C]57942[/C][C]51053.6775757576[/C][C]6888.32242424243[/C][/ROW]
[ROW][C]3[/C][C]34857[/C][C]45907.2775757576[/C][C]-11050.2775757576[/C][/ROW]
[ROW][C]4[/C][C]39421[/C][C]45159.8618181818[/C][C]-5738.86181818182[/C][/ROW]
[ROW][C]5[/C][C]45612[/C][C]48329.2618181818[/C][C]-2717.26181818182[/C][/ROW]
[ROW][C]6[/C][C]65410[/C][C]53844.6618181818[/C][C]11565.3381818182[/C][/ROW]
[ROW][C]7[/C][C]50125[/C][C]51695.0618181818[/C][C]-1570.06181818181[/C][/ROW]
[ROW][C]8[/C][C]46879[/C][C]49451.2618181818[/C][C]-2572.26181818182[/C][/ROW]
[ROW][C]9[/C][C]53875[/C][C]50941.8618181818[/C][C]2933.13818181818[/C][/ROW]
[ROW][C]10[/C][C]49652[/C][C]50026.0618181818[/C][C]-374.061818181817[/C][/ROW]
[ROW][C]11[/C][C]54167[/C][C]49683.2618181818[/C][C]4483.73818181818[/C][/ROW]
[ROW][C]12[/C][C]61558[/C][C]52069.2618181818[/C][C]9488.73818181819[/C][/ROW]
[ROW][C]13[/C][C]56874[/C][C]53368.7309090909[/C][C]3505.26909090910[/C][/ROW]
[ROW][C]14[/C][C]51966[/C][C]52535.1309090909[/C][C]-569.130909090908[/C][/ROW]
[ROW][C]15[/C][C]45897[/C][C]47388.7309090909[/C][C]-1491.73090909091[/C][/ROW]
[ROW][C]16[/C][C]46832[/C][C]46641.3151515152[/C][C]190.684848484847[/C][/ROW]
[ROW][C]17[/C][C]47852[/C][C]49810.7151515151[/C][C]-1958.71515151515[/C][/ROW]
[ROW][C]18[/C][C]58236[/C][C]55326.1151515152[/C][C]2909.88484848485[/C][/ROW]
[ROW][C]19[/C][C]54216[/C][C]53176.5151515152[/C][C]1039.48484848485[/C][/ROW]
[ROW][C]20[/C][C]52687[/C][C]50932.7151515151[/C][C]1754.28484848485[/C][/ROW]
[ROW][C]21[/C][C]47659[/C][C]52423.3151515152[/C][C]-4764.31515151515[/C][/ROW]
[ROW][C]22[/C][C]50089[/C][C]51507.5151515152[/C][C]-1418.51515151515[/C][/ROW]
[ROW][C]23[/C][C]51247[/C][C]51164.7151515151[/C][C]82.2848484848486[/C][/ROW]
[ROW][C]24[/C][C]48658[/C][C]53550.7151515151[/C][C]-4892.71515151515[/C][/ROW]
[ROW][C]25[/C][C]47233[/C][C]54850.1842424242[/C][C]-7617.18424242423[/C][/ROW]
[ROW][C]26[/C][C]46988[/C][C]54016.5842424242[/C][C]-7028.58424242424[/C][/ROW]
[ROW][C]27[/C][C]51784[/C][C]48870.1842424242[/C][C]2913.81575757576[/C][/ROW]
[ROW][C]28[/C][C]53620[/C][C]48122.7684848485[/C][C]5497.23151515151[/C][/ROW]
[ROW][C]29[/C][C]51479[/C][C]51292.1684848485[/C][C]186.831515151514[/C][/ROW]
[ROW][C]30[/C][C]50007[/C][C]56807.5684848485[/C][C]-6800.56848484849[/C][/ROW]
[ROW][C]31[/C][C]52634[/C][C]54657.9684848485[/C][C]-2023.96848484849[/C][/ROW]
[ROW][C]32[/C][C]49566[/C][C]52414.1684848485[/C][C]-2848.16848484849[/C][/ROW]
[ROW][C]33[/C][C]48522[/C][C]53904.7684848485[/C][C]-5382.76848484849[/C][/ROW]
[ROW][C]34[/C][C]53864[/C][C]52988.9684848485[/C][C]875.031515151515[/C][/ROW]
[ROW][C]35[/C][C]51477[/C][C]52646.1684848485[/C][C]-1169.16848484849[/C][/ROW]
[ROW][C]36[/C][C]56214[/C][C]55032.1684848485[/C][C]1181.83151515151[/C][/ROW]
[ROW][C]37[/C][C]60032[/C][C]56331.6375757576[/C][C]3700.36242424243[/C][/ROW]
[ROW][C]38[/C][C]57862[/C][C]55498.0375757576[/C][C]2363.96242424242[/C][/ROW]
[ROW][C]39[/C][C]55684[/C][C]50351.6375757576[/C][C]5332.36242424242[/C][/ROW]
[ROW][C]40[/C][C]75894[/C][C]78954.3006060606[/C][C]-3060.30060606061[/C][/ROW]
[ROW][C]41[/C][C]80564[/C][C]82123.7006060606[/C][C]-1559.70060606060[/C][/ROW]
[ROW][C]42[/C][C]84562[/C][C]87639.1006060606[/C][C]-3077.10060606061[/C][/ROW]
[ROW][C]43[/C][C]87546[/C][C]85489.5006060606[/C][C]2056.49939393939[/C][/ROW]
[ROW][C]44[/C][C]83654[/C][C]83245.7006060606[/C][C]408.299393939395[/C][/ROW]
[ROW][C]45[/C][C]89745[/C][C]84736.3006060606[/C][C]5008.6993939394[/C][/ROW]
[ROW][C]46[/C][C]79565[/C][C]83820.5006060606[/C][C]-4255.50060606061[/C][/ROW]
[ROW][C]47[/C][C]78498[/C][C]83477.7006060606[/C][C]-4979.7006060606[/C][/ROW]
[ROW][C]48[/C][C]79468[/C][C]85863.7006060606[/C][C]-6395.7006060606[/C][/ROW]
[ROW][C]49[/C][C]82479[/C][C]87163.1696969697[/C][C]-4684.16969696969[/C][/ROW]
[ROW][C]50[/C][C]84675[/C][C]86329.5696969697[/C][C]-1654.56969696970[/C][/ROW]
[ROW][C]51[/C][C]85479[/C][C]81183.1696969697[/C][C]4295.83030303031[/C][/ROW]
[ROW][C]52[/C][C]83547[/C][C]80435.753939394[/C][C]3111.24606060606[/C][/ROW]
[ROW][C]53[/C][C]89654[/C][C]83605.153939394[/C][C]6048.84606060606[/C][/ROW]
[ROW][C]54[/C][C]84523[/C][C]89120.553939394[/C][C]-4597.55393939394[/C][/ROW]
[ROW][C]55[/C][C]87469[/C][C]86970.953939394[/C][C]498.046060606059[/C][/ROW]
[ROW][C]56[/C][C]87985[/C][C]84727.153939394[/C][C]3257.84606060606[/C][/ROW]
[ROW][C]57[/C][C]88423[/C][C]86217.753939394[/C][C]2205.24606060606[/C][/ROW]
[ROW][C]58[/C][C]90475[/C][C]85301.953939394[/C][C]5173.04606060606[/C][/ROW]
[ROW][C]59[/C][C]86542[/C][C]84959.153939394[/C][C]1582.84606060606[/C][/ROW]
[ROW][C]60[/C][C]87963[/C][C]87345.153939394[/C][C]617.846060606059[/C][/ROW]
[/TABLE]
Source: https://freestatistics.org/blog/index.php?pk=25486&T=4

Globally Unique Identifier (entire table): ba.freestatistics.org/blog/index.php?pk=25486&T=4

As an alternative you can also use a QR Code:  

The GUIDs for individual cells are displayed in the table below:

Multiple Linear Regression - Actuals, Interpolation, and Residuals
Time or IndexActualsInterpolationForecastResidualsPrediction Error
15698351887.27757575765095.72242424238
25794251053.67757575766888.32242424243
33485745907.2775757576-11050.2775757576
43942145159.8618181818-5738.86181818182
54561248329.2618181818-2717.26181818182
66541053844.661818181811565.3381818182
75012551695.0618181818-1570.06181818181
84687949451.2618181818-2572.26181818182
95387550941.86181818182933.13818181818
104965250026.0618181818-374.061818181817
115416749683.26181818184483.73818181818
126155852069.26181818189488.73818181819
135687453368.73090909093505.26909090910
145196652535.1309090909-569.130909090908
154589747388.7309090909-1491.73090909091
164683246641.3151515152190.684848484847
174785249810.7151515151-1958.71515151515
185823655326.11515151522909.88484848485
195421653176.51515151521039.48484848485
205268750932.71515151511754.28484848485
214765952423.3151515152-4764.31515151515
225008951507.5151515152-1418.51515151515
235124751164.715151515182.2848484848486
244865853550.7151515151-4892.71515151515
254723354850.1842424242-7617.18424242423
264698854016.5842424242-7028.58424242424
275178448870.18424242422913.81575757576
285362048122.76848484855497.23151515151
295147951292.1684848485186.831515151514
305000756807.5684848485-6800.56848484849
315263454657.9684848485-2023.96848484849
324956652414.1684848485-2848.16848484849
334852253904.7684848485-5382.76848484849
345386452988.9684848485875.031515151515
355147752646.1684848485-1169.16848484849
365621455032.16848484851181.83151515151
376003256331.63757575763700.36242424243
385786255498.03757575762363.96242424242
395568450351.63757575765332.36242424242
407589478954.3006060606-3060.30060606061
418056482123.7006060606-1559.70060606060
428456287639.1006060606-3077.10060606061
438754685489.50060606062056.49939393939
448365483245.7006060606408.299393939395
458974584736.30060606065008.6993939394
467956583820.5006060606-4255.50060606061
477849883477.7006060606-4979.7006060606
487946885863.7006060606-6395.7006060606
498247987163.1696969697-4684.16969696969
508467586329.5696969697-1654.56969696970
518547981183.16969696974295.83030303031
528354780435.7539393943111.24606060606
538965483605.1539393946048.84606060606
548452389120.553939394-4597.55393939394
558746986970.953939394498.046060606059
568798584727.1539393943257.84606060606
578842386217.7539393942205.24606060606
589047585301.9539393945173.04606060606
598654284959.1539393941582.84606060606
608796387345.153939394617.846060606059


Parameters (Session):
par1 = 1 ; par2 = Include Monthly Dummies ; par3 = Linear Trend ;
Parameters (R input):
par1 = 1 ; par2 = Include Monthly Dummies ; par3 = Linear Trend ;
R code (references can be found in the software module):
library(lattice)
par1 <- as.numeric(par1)
x <- t(y)
k <- length(x[1,])
n <- length(x[,1])
x1 <- cbind(x[,par1], x[,1:k!=par1])
mycolnames <- c(colnames(x)[par1], colnames(x)[1:k!=par1])
colnames(x1) <- mycolnames #colnames(x)[par1]
x <- x1
if (par3 == 'First Differences'){
x2 <- array(0, dim=c(n-1,k), dimnames=list(1:(n-1), paste('(1-B)',colnames(x),sep='')))
for (i in 1:n-1) {
for (j in 1:k) {
x2[i,j] <- x[i+1,j] - x[i,j]
}
}
x <- x2
}
if (par2 == 'Include Monthly Dummies'){
x2 <- array(0, dim=c(n,11), dimnames=list(1:n, paste('M', seq(1:11), sep ='')))
for (i in 1:11){
x2[seq(i,n,12),i] <- 1
}
x <- cbind(x, x2)
}
if (par2 == 'Include Quarterly Dummies'){
x2 <- array(0, dim=c(n,3), dimnames=list(1:n, paste('Q', seq(1:3), sep ='')))
for (i in 1:3){
x2[seq(i,n,4),i] <- 1
}
x <- cbind(x, x2)
}
k <- length(x[1,])
if (par3 == 'Linear Trend'){
x <- cbind(x, c(1:n))
colnames(x)[k+1] <- 't'
}
x
k <- length(x[1,])
df <- as.data.frame(x)
(mylm <- lm(df))
(mysum <- summary(mylm))
bitmap(file='test0.png')
plot(x[,1], type='l', main='Actuals and Interpolation', ylab='value of Actuals and Interpolation (dots)', xlab='time or index')
points(x[,1]-mysum$resid)
grid()
dev.off()
bitmap(file='test1.png')
plot(mysum$resid, type='b', pch=19, main='Residuals', ylab='value of Residuals', xlab='time or index')
grid()
dev.off()
bitmap(file='test2.png')
hist(mysum$resid, main='Residual Histogram', xlab='values of Residuals')
grid()
dev.off()
bitmap(file='test3.png')
densityplot(~mysum$resid,col='black',main='Residual Density Plot', xlab='values of Residuals')
dev.off()
bitmap(file='test4.png')
qqnorm(mysum$resid, main='Residual Normal Q-Q Plot')
grid()
dev.off()
(myerror <- as.ts(mysum$resid))
bitmap(file='test5.png')
dum <- cbind(lag(myerror,k=1),myerror)
dum
dum1 <- dum[2:length(myerror),]
dum1
z <- as.data.frame(dum1)
z
plot(z,main=paste('Residual Lag plot, lowess, and regression line'), ylab='values of Residuals', xlab='lagged values of Residuals')
lines(lowess(z))
abline(lm(z))
grid()
dev.off()
bitmap(file='test6.png')
acf(mysum$resid, lag.max=length(mysum$resid)/2, main='Residual Autocorrelation Function')
grid()
dev.off()
bitmap(file='test7.png')
pacf(mysum$resid, lag.max=length(mysum$resid)/2, main='Residual Partial Autocorrelation Function')
grid()
dev.off()
bitmap(file='test8.png')
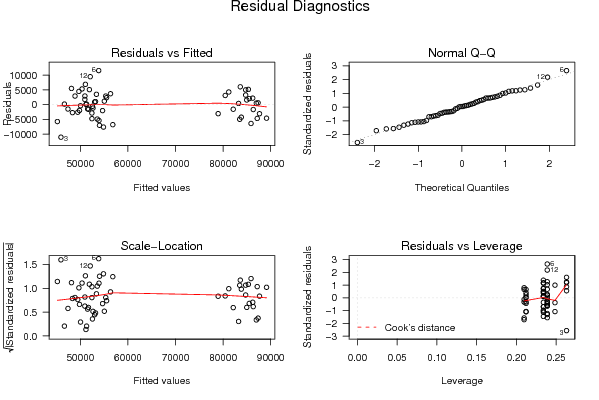
opar <- par(mfrow = c(2,2), oma = c(0, 0, 1.1, 0))
plot(mylm, las = 1, sub='Residual Diagnostics')
par(opar)
dev.off()
load(file='createtable')
a<-table.start()
a<-table.row.start(a)
a<-table.element(a, 'Multiple Linear Regression - Estimated Regression Equation', 1, TRUE)
a<-table.row.end(a)
myeq <- colnames(x)[1]
myeq <- paste(myeq, '[t] = ', sep='')
for (i in 1:k){
if (mysum$coefficients[i,1] > 0) myeq <- paste(myeq, '+', '')
myeq <- paste(myeq, mysum$coefficients[i,1], sep=' ')
if (rownames(mysum$coefficients)[i] != '(Intercept)') {
myeq <- paste(myeq, rownames(mysum$coefficients)[i], sep='')
if (rownames(mysum$coefficients)[i] != 't') myeq <- paste(myeq, '[t]', sep='')
}
}
myeq <- paste(myeq, ' + e[t]')
a<-table.row.start(a)
a<-table.element(a, myeq)
a<-table.row.end(a)
a<-table.end(a)
table.save(a,file='mytable1.tab')
a<-table.start()
a<-table.row.start(a)
a<-table.element(a,hyperlink('ols1.htm','Multiple Linear Regression - Ordinary Least Squares',''), 6, TRUE)
a<-table.row.end(a)
a<-table.row.start(a)
a<-table.element(a,'Variable',header=TRUE)
a<-table.element(a,'Parameter',header=TRUE)
a<-table.element(a,'S.D.',header=TRUE)
a<-table.element(a,'T-STAT
H0: parameter = 0',header=TRUE)
a<-table.element(a,'2-tail p-value',header=TRUE)
a<-table.element(a,'1-tail p-value',header=TRUE)
a<-table.row.end(a)
for (i in 1:k){
a<-table.row.start(a)
a<-table.element(a,rownames(mysum$coefficients)[i],header=TRUE)
a<-table.element(a,mysum$coefficients[i,1])
a<-table.element(a, round(mysum$coefficients[i,2],6))
a<-table.element(a, round(mysum$coefficients[i,3],4))
a<-table.element(a, round(mysum$coefficients[i,4],6))
a<-table.element(a, round(mysum$coefficients[i,4]/2,6))
a<-table.row.end(a)
}
a<-table.end(a)
table.save(a,file='mytable2.tab')
a<-table.start()
a<-table.row.start(a)
a<-table.element(a, 'Multiple Linear Regression - Regression Statistics', 2, TRUE)
a<-table.row.end(a)
a<-table.row.start(a)
a<-table.element(a, 'Multiple R',1,TRUE)
a<-table.element(a, sqrt(mysum$r.squared))
a<-table.row.end(a)
a<-table.row.start(a)
a<-table.element(a, 'R-squared',1,TRUE)
a<-table.element(a, mysum$r.squared)
a<-table.row.end(a)
a<-table.row.start(a)
a<-table.element(a, 'Adjusted R-squared',1,TRUE)
a<-table.element(a, mysum$adj.r.squared)
a<-table.row.end(a)
a<-table.row.start(a)
a<-table.element(a, 'F-TEST (value)',1,TRUE)
a<-table.element(a, mysum$fstatistic[1])
a<-table.row.end(a)
a<-table.row.start(a)
a<-table.element(a, 'F-TEST (DF numerator)',1,TRUE)
a<-table.element(a, mysum$fstatistic[2])
a<-table.row.end(a)
a<-table.row.start(a)
a<-table.element(a, 'F-TEST (DF denominator)',1,TRUE)
a<-table.element(a, mysum$fstatistic[3])
a<-table.row.end(a)
a<-table.row.start(a)
a<-table.element(a, 'p-value',1,TRUE)
a<-table.element(a, 1-pf(mysum$fstatistic[1],mysum$fstatistic[2],mysum$fstatistic[3]))
a<-table.row.end(a)
a<-table.row.start(a)
a<-table.element(a, 'Multiple Linear Regression - Residual Statistics', 2, TRUE)
a<-table.row.end(a)
a<-table.row.start(a)
a<-table.element(a, 'Residual Standard Deviation',1,TRUE)
a<-table.element(a, mysum$sigma)
a<-table.row.end(a)
a<-table.row.start(a)
a<-table.element(a, 'Sum Squared Residuals',1,TRUE)
a<-table.element(a, sum(myerror*myerror))
a<-table.row.end(a)
a<-table.end(a)
table.save(a,file='mytable3.tab')
a<-table.start()
a<-table.row.start(a)
a<-table.element(a, 'Multiple Linear Regression - Actuals, Interpolation, and Residuals', 4, TRUE)
a<-table.row.end(a)
a<-table.row.start(a)
a<-table.element(a, 'Time or Index', 1, TRUE)
a<-table.element(a, 'Actuals', 1, TRUE)
a<-table.element(a, 'Interpolation
Forecast', 1, TRUE)
a<-table.element(a, 'Residuals
Prediction Error', 1, TRUE)
a<-table.row.end(a)
for (i in 1:n) {
a<-table.row.start(a)
a<-table.element(a,i, 1, TRUE)
a<-table.element(a,x[i])
a<-table.element(a,x[i]-mysum$resid[i])
a<-table.element(a,mysum$resid[i])
a<-table.row.end(a)
}
a<-table.end(a)
table.save(a,file='mytable4.tab')