Free Statistics

of Irreproducible Research!

Author's title

Author*The author of this computation has been verified*
R Software Modulerwasp_multipleregression.wasp
Title produced by softwareMultiple Regression
Date of computationMon, 24 Nov 2008 11:30:03 -0700
Cite this page as followsStatistical Computations at FreeStatistics.org, Office for Research Development and Education, URL https://freestatistics.org/blog/index.php?v=date/2008/Nov/24/t1227551461u0vqex6t58qe3v8.htm/, Retrieved Tue, 14 May 2024 16:17:56 +0000
Statistical Computations at FreeStatistics.org, Office for Research Development and Education, URL https://freestatistics.org/blog/index.php?pk=25484, Retrieved Tue, 14 May 2024 16:17:56 +0000
QR Codes:

Original text written by user:
IsPrivate?No (this computation is public)
User-defined keywords
Estimated Impact210
Family? (F = Feedback message, R = changed R code, M = changed R Module, P = changed Parameters, D = changed Data)
-     [Multiple Regression] [The seatbelt law] [2007-11-19 10:09:20] [179580f635b5f83b2ee77249aac47f19]
F R  D  [Multiple Regression] [] [2008-11-23 13:19:57] [4c8dfb519edec2da3492d7e6be9a5685]
F   PD    [Multiple Regression] [] [2008-11-23 14:06:19] [4c8dfb519edec2da3492d7e6be9a5685]
-    D      [Multiple Regression] [seatbelt law Q3] [2008-11-24 18:20:45] [077ffec662d24c06be4c491541a44245]
-   P         [Multiple Regression] [seatbelt law Q3 t...] [2008-11-24 18:27:38] [077ffec662d24c06be4c491541a44245]
F   P             [Multiple Regression] [seatbelt law Q3 d...] [2008-11-24 18:30:03] [3817f5e632a8bfeb1be7b5e8c86bd450] [Current]
Feedback Forum
2008-11-25 19:46:17 [Glenn De Maeyer] [reply
We werken hier met een dummy-variabele. Deze dummy variabele toont het effect van de overschrijding van de spilindex.De spilindex werd overschreden in september 2006. Vanaf deze maand werd er een 1 achter de gegevens geplaatst.
Y (16,94)toont ons hier het effect (voorspelling) van de overschrijding van de spilindex op de totale waarde (Milj. Euro’s) van de uitvoer van het Vlaams gewest. 13325.2037950664 is de constante. Het constante deel van de waarde van de uitvoer.
M1, M2,… tonen ons het effect van elke maand t.o.v de referentiemaand.
En t is de lange-termijntrend. Hier hebben we te maken met een licht positieve trend. (t= 81.03)
Sinds de overschrijding van de spilindex is de waarde van de uitvoer dus gestegen met 16,94 milj. Euro.
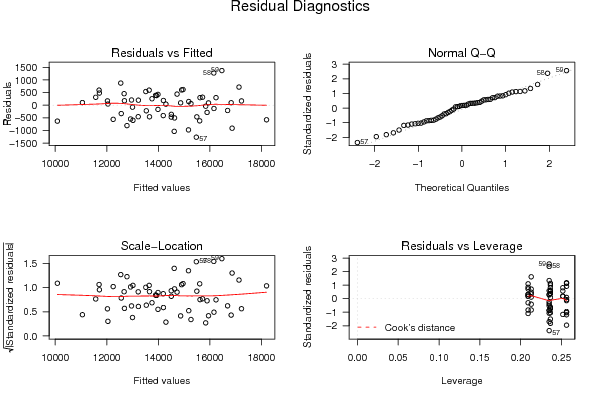
Als we nu ook kijken naar R-squared dan zien we dat deze 91% is. Dit model geeft ons dus een juist beeld van de overschrijding van de spilindex. De vlaamse uitvoer wordt hier door het model verklaard.

Post a new message
Dataseries X:
12300.00	0.00
12092.80	0.00
12380.80	0.00
12196.90	0.00
9455.00	0.00
13168.00	0.00
13427.90	0.00
11980.50	0.00
11884.80	0.00
11691.70	0.00
12233.80	0.00
14341.40	0.00
13130.70	0.00
12421.10	0.00
14285.80	0.00
12864.60	0.00
11160.20	0.00
14316.20	0.00
14388.70	0.00
14013.90	0.00
13419.00	0.00
12769.60	0.00
13315.50	0.00
15332.90	0.00
14243.00	0.00
13824.40	0.00
14962.90	0.00
13202.90	0.00
12199.00	0.00
15508.90	0.00
14199.80	0.00
15169.60	0.00
14058.00	0.00
13786.20	0.00
14147.90	0.00
16541.70	0.00
13587.50	0.00
15582.40	0.00
15802.80	0.00
14130.50	0.00
12923.20	0.00
15612.20	1.00
16033.70	1.00
16036.60	1.00
14037.80	1.00
15330.60	1.00
15038.30	1.00
17401.80	1.00
14992.50	1.00
16043.70	1.00
16929.60	1.00
15921.30	1.00
14417.20	1.00
15961.00	1.00
17851.90	1.00
16483.90	1.00
14215.50	1.00
17429.70	1.00
17839.50	1.00
17629.20	1.00


Summary of computational transaction
Raw Inputview raw input (R code)
Raw Outputview raw output of R engine
Computing time5 seconds
R Server'George Udny Yule' @ 72.249.76.132

\begin{tabular}{lllllllll}
\hline
Summary of computational transaction \tabularnewline
Raw Input & view raw input (R code)  \tabularnewline
Raw Output & view raw output of R engine  \tabularnewline
Computing time & 5 seconds \tabularnewline
R Server & 'George Udny Yule' @ 72.249.76.132 \tabularnewline
\hline
\end{tabular}
%Source: https://freestatistics.org/blog/index.php?pk=25484&T=0

[TABLE]
[ROW][C]Summary of computational transaction[/C][/ROW]
[ROW][C]Raw Input[/C][C]view raw input (R code) [/C][/ROW]
[ROW][C]Raw Output[/C][C]view raw output of R engine [/C][/ROW]
[ROW][C]Computing time[/C][C]5 seconds[/C][/ROW]
[ROW][C]R Server[/C][C]'George Udny Yule' @ 72.249.76.132[/C][/ROW]
[/TABLE]
Source: https://freestatistics.org/blog/index.php?pk=25484&T=0

Globally Unique Identifier (entire table): ba.freestatistics.org/blog/index.php?pk=25484&T=0

As an alternative you can also use a QR Code:  

The GUIDs for individual cells are displayed in the table below:

Summary of computational transaction
Raw Inputview raw input (R code)
Raw Outputview raw output of R engine
Computing time5 seconds
R Server'George Udny Yule' @ 72.249.76.132


Multiple Linear Regression - Estimated Regression Equation
x[t] = + 13325.2037950664 + 16.9434535104332y[t] -1703.83777988615M1[t] -1442.73719165085M2[t] -644.276603415561M3[t] -1934.45601518026M4[t] -3647.81542694497M5[t] -849.903529411764M6[t] -663.802941176471M7[t] -1188.34235294117M8[t] -2483.26176470588M9[t] -1885.76117647059M10[t] -1653.36058823529M11[t] + 81.039411764706t + e[t]

\begin{tabular}{lllllllll}
\hline
Multiple Linear Regression - Estimated Regression Equation \tabularnewline
x[t] =  +  13325.2037950664 +  16.9434535104332y[t] -1703.83777988615M1[t] -1442.73719165085M2[t] -644.276603415561M3[t] -1934.45601518026M4[t] -3647.81542694497M5[t] -849.903529411764M6[t] -663.802941176471M7[t] -1188.34235294117M8[t] -2483.26176470588M9[t] -1885.76117647059M10[t] -1653.36058823529M11[t] +  81.039411764706t  + e[t] \tabularnewline
\hline
\end{tabular}
%Source: https://freestatistics.org/blog/index.php?pk=25484&T=1

[TABLE]
[ROW][C]Multiple Linear Regression - Estimated Regression Equation[/C][/ROW]
[ROW][C]x[t] =  +  13325.2037950664 +  16.9434535104332y[t] -1703.83777988615M1[t] -1442.73719165085M2[t] -644.276603415561M3[t] -1934.45601518026M4[t] -3647.81542694497M5[t] -849.903529411764M6[t] -663.802941176471M7[t] -1188.34235294117M8[t] -2483.26176470588M9[t] -1885.76117647059M10[t] -1653.36058823529M11[t] +  81.039411764706t  + e[t][/C][/ROW]
[/TABLE]
Source: https://freestatistics.org/blog/index.php?pk=25484&T=1

Globally Unique Identifier (entire table): ba.freestatistics.org/blog/index.php?pk=25484&T=1

As an alternative you can also use a QR Code:  

The GUIDs for individual cells are displayed in the table below:

Multiple Linear Regression - Estimated Regression Equation
x[t] = + 13325.2037950664 + 16.9434535104332y[t] -1703.83777988615M1[t] -1442.73719165085M2[t] -644.276603415561M3[t] -1934.45601518026M4[t] -3647.81542694497M5[t] -849.903529411764M6[t] -663.802941176471M7[t] -1188.34235294117M8[t] -2483.26176470588M9[t] -1885.76117647059M10[t] -1653.36058823529M11[t] + 81.039411764706t + e[t]


Multiple Linear Regression - Ordinary Least Squares
VariableParameterS.D.T-STATH0: parameter = 02-tail p-value1-tail p-value
(Intercept)13325.2037950664339.12763339.292600
y16.9434535104332292.0549310.0580.9539880.476994
M1-1703.83777988615390.608938-4.3627.2e-053.6e-05
M2-1442.73719165085389.903157-3.70020.0005740.000287
M3-644.276603415561389.353331-1.65470.1047870.052393
M4-1934.45601518026388.960123-4.97341e-055e-06
M5-3647.81542694497388.724008-9.384100
M6-849.903529411764389.923412-2.17970.0344380.017219
M7-663.802941176471389.059097-1.70620.0947190.04736
M8-1188.34235294117388.350499-3.060.0036870.001843
M9-2483.26176470588387.798473-6.403500
M10-1885.76117647059387.403687-4.86771.4e-057e-06
M11-1653.36058823529387.166622-4.27049.7e-054.8e-05
t81.0394117647067.82354410.358400

\begin{tabular}{lllllllll}
\hline
Multiple Linear Regression - Ordinary Least Squares \tabularnewline
Variable & Parameter & S.D. & T-STATH0: parameter = 0 & 2-tail p-value & 1-tail p-value \tabularnewline
(Intercept) & 13325.2037950664 & 339.127633 & 39.2926 & 0 & 0 \tabularnewline
y & 16.9434535104332 & 292.054931 & 0.058 & 0.953988 & 0.476994 \tabularnewline
M1 & -1703.83777988615 & 390.608938 & -4.362 & 7.2e-05 & 3.6e-05 \tabularnewline
M2 & -1442.73719165085 & 389.903157 & -3.7002 & 0.000574 & 0.000287 \tabularnewline
M3 & -644.276603415561 & 389.353331 & -1.6547 & 0.104787 & 0.052393 \tabularnewline
M4 & -1934.45601518026 & 388.960123 & -4.9734 & 1e-05 & 5e-06 \tabularnewline
M5 & -3647.81542694497 & 388.724008 & -9.3841 & 0 & 0 \tabularnewline
M6 & -849.903529411764 & 389.923412 & -2.1797 & 0.034438 & 0.017219 \tabularnewline
M7 & -663.802941176471 & 389.059097 & -1.7062 & 0.094719 & 0.04736 \tabularnewline
M8 & -1188.34235294117 & 388.350499 & -3.06 & 0.003687 & 0.001843 \tabularnewline
M9 & -2483.26176470588 & 387.798473 & -6.4035 & 0 & 0 \tabularnewline
M10 & -1885.76117647059 & 387.403687 & -4.8677 & 1.4e-05 & 7e-06 \tabularnewline
M11 & -1653.36058823529 & 387.166622 & -4.2704 & 9.7e-05 & 4.8e-05 \tabularnewline
t & 81.039411764706 & 7.823544 & 10.3584 & 0 & 0 \tabularnewline
\hline
\end{tabular}
%Source: https://freestatistics.org/blog/index.php?pk=25484&T=2

[TABLE]
[ROW][C]Multiple Linear Regression - Ordinary Least Squares[/C][/ROW]
[ROW][C]Variable[/C][C]Parameter[/C][C]S.D.[/C][C]T-STATH0: parameter = 0[/C][C]2-tail p-value[/C][C]1-tail p-value[/C][/ROW]
[ROW][C](Intercept)[/C][C]13325.2037950664[/C][C]339.127633[/C][C]39.2926[/C][C]0[/C][C]0[/C][/ROW]
[ROW][C]y[/C][C]16.9434535104332[/C][C]292.054931[/C][C]0.058[/C][C]0.953988[/C][C]0.476994[/C][/ROW]
[ROW][C]M1[/C][C]-1703.83777988615[/C][C]390.608938[/C][C]-4.362[/C][C]7.2e-05[/C][C]3.6e-05[/C][/ROW]
[ROW][C]M2[/C][C]-1442.73719165085[/C][C]389.903157[/C][C]-3.7002[/C][C]0.000574[/C][C]0.000287[/C][/ROW]
[ROW][C]M3[/C][C]-644.276603415561[/C][C]389.353331[/C][C]-1.6547[/C][C]0.104787[/C][C]0.052393[/C][/ROW]
[ROW][C]M4[/C][C]-1934.45601518026[/C][C]388.960123[/C][C]-4.9734[/C][C]1e-05[/C][C]5e-06[/C][/ROW]
[ROW][C]M5[/C][C]-3647.81542694497[/C][C]388.724008[/C][C]-9.3841[/C][C]0[/C][C]0[/C][/ROW]
[ROW][C]M6[/C][C]-849.903529411764[/C][C]389.923412[/C][C]-2.1797[/C][C]0.034438[/C][C]0.017219[/C][/ROW]
[ROW][C]M7[/C][C]-663.802941176471[/C][C]389.059097[/C][C]-1.7062[/C][C]0.094719[/C][C]0.04736[/C][/ROW]
[ROW][C]M8[/C][C]-1188.34235294117[/C][C]388.350499[/C][C]-3.06[/C][C]0.003687[/C][C]0.001843[/C][/ROW]
[ROW][C]M9[/C][C]-2483.26176470588[/C][C]387.798473[/C][C]-6.4035[/C][C]0[/C][C]0[/C][/ROW]
[ROW][C]M10[/C][C]-1885.76117647059[/C][C]387.403687[/C][C]-4.8677[/C][C]1.4e-05[/C][C]7e-06[/C][/ROW]
[ROW][C]M11[/C][C]-1653.36058823529[/C][C]387.166622[/C][C]-4.2704[/C][C]9.7e-05[/C][C]4.8e-05[/C][/ROW]
[ROW][C]t[/C][C]81.039411764706[/C][C]7.823544[/C][C]10.3584[/C][C]0[/C][C]0[/C][/ROW]
[/TABLE]
Source: https://freestatistics.org/blog/index.php?pk=25484&T=2

Globally Unique Identifier (entire table): ba.freestatistics.org/blog/index.php?pk=25484&T=2

As an alternative you can also use a QR Code:  

The GUIDs for individual cells are displayed in the table below:

Multiple Linear Regression - Ordinary Least Squares
VariableParameterS.D.T-STATH0: parameter = 02-tail p-value1-tail p-value
(Intercept)13325.2037950664339.12763339.292600
y16.9434535104332292.0549310.0580.9539880.476994
M1-1703.83777988615390.608938-4.3627.2e-053.6e-05
M2-1442.73719165085389.903157-3.70020.0005740.000287
M3-644.276603415561389.353331-1.65470.1047870.052393
M4-1934.45601518026388.960123-4.97341e-055e-06
M5-3647.81542694497388.724008-9.384100
M6-849.903529411764389.923412-2.17970.0344380.017219
M7-663.802941176471389.059097-1.70620.0947190.04736
M8-1188.34235294117388.350499-3.060.0036870.001843
M9-2483.26176470588387.798473-6.403500
M10-1885.76117647059387.403687-4.86771.4e-057e-06
M11-1653.36058823529387.166622-4.27049.7e-054.8e-05
t81.0394117647067.82354410.358400


Multiple Linear Regression - Regression Statistics
Multiple R0.9542519941186
R-squared0.910596868279325
Adjusted R-squared0.885330765836525
F-TEST (value)36.0402586960473
F-TEST (DF numerator)13
F-TEST (DF denominator)46
p-value0
Multiple Linear Regression - Residual Statistics
Residual Standard Deviation612.039183841238
Sum Squared Residuals17231230.2776242

\begin{tabular}{lllllllll}
\hline
Multiple Linear Regression - Regression Statistics \tabularnewline
Multiple R & 0.9542519941186 \tabularnewline
R-squared & 0.910596868279325 \tabularnewline
Adjusted R-squared & 0.885330765836525 \tabularnewline
F-TEST (value) & 36.0402586960473 \tabularnewline
F-TEST (DF numerator) & 13 \tabularnewline
F-TEST (DF denominator) & 46 \tabularnewline
p-value & 0 \tabularnewline
Multiple Linear Regression - Residual Statistics \tabularnewline
Residual Standard Deviation & 612.039183841238 \tabularnewline
Sum Squared Residuals & 17231230.2776242 \tabularnewline
\hline
\end{tabular}
%Source: https://freestatistics.org/blog/index.php?pk=25484&T=3

[TABLE]
[ROW][C]Multiple Linear Regression - Regression Statistics[/C][/ROW]
[ROW][C]Multiple R[/C][C]0.9542519941186[/C][/ROW]
[ROW][C]R-squared[/C][C]0.910596868279325[/C][/ROW]
[ROW][C]Adjusted R-squared[/C][C]0.885330765836525[/C][/ROW]
[ROW][C]F-TEST (value)[/C][C]36.0402586960473[/C][/ROW]
[ROW][C]F-TEST (DF numerator)[/C][C]13[/C][/ROW]
[ROW][C]F-TEST (DF denominator)[/C][C]46[/C][/ROW]
[ROW][C]p-value[/C][C]0[/C][/ROW]
[ROW][C]Multiple Linear Regression - Residual Statistics[/C][/ROW]
[ROW][C]Residual Standard Deviation[/C][C]612.039183841238[/C][/ROW]
[ROW][C]Sum Squared Residuals[/C][C]17231230.2776242[/C][/ROW]
[/TABLE]
Source: https://freestatistics.org/blog/index.php?pk=25484&T=3

Globally Unique Identifier (entire table): ba.freestatistics.org/blog/index.php?pk=25484&T=3

As an alternative you can also use a QR Code:  

The GUIDs for individual cells are displayed in the table below:

Multiple Linear Regression - Regression Statistics
Multiple R0.9542519941186
R-squared0.910596868279325
Adjusted R-squared0.885330765836525
F-TEST (value)36.0402586960473
F-TEST (DF numerator)13
F-TEST (DF denominator)46
p-value0
Multiple Linear Regression - Residual Statistics
Residual Standard Deviation612.039183841238
Sum Squared Residuals17231230.2776242


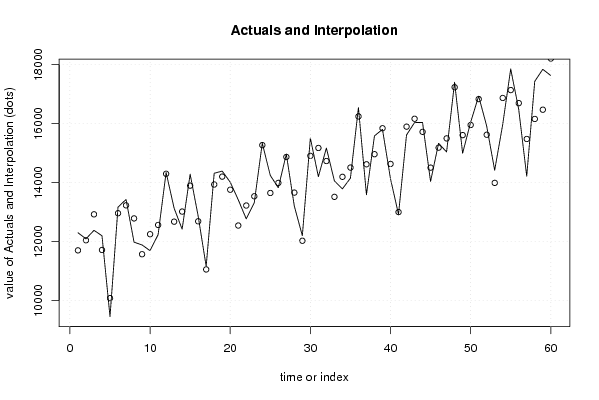
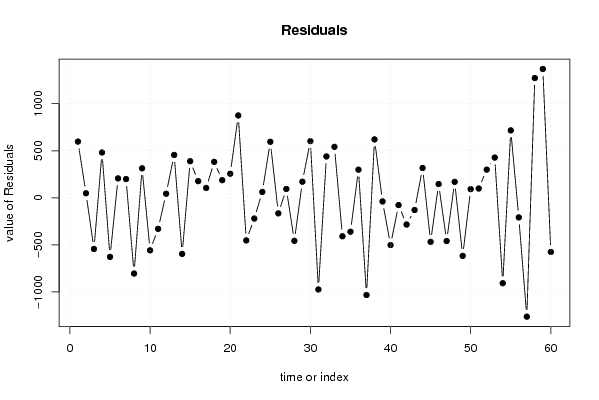
Multiple Linear Regression - Actuals, Interpolation, and Residuals
Time or IndexActualsInterpolationForecastResidualsPrediction Error
11230011702.405426945597.594573054989
212092.812044.545426945048.2545730550292
312380.812924.0454269450-543.245426944971
412196.911714.9054269450481.994573055034
5945510082.5854269450-627.585426944965
61316812961.5367362429206.463263757115
713427.913228.6767362429199.223263757114
811980.512785.1767362429-804.676736242883
911884.811571.2967362429313.503263757121
1011691.712249.8367362429-558.136736242882
1112233.812563.2767362429-329.476736242883
1214341.414297.676736242943.7232637571157
1313130.712674.8783681214455.82163187857
1412421.113017.0183681214-595.918368121441
1514285.813896.5183681214389.28163187856
1612864.612687.3783681214177.221631878559
1711160.211055.0583681214105.141631878559
1814316.213934.0096774194382.190322580647
1914388.714201.1496774194187.550322580647
2014013.913757.6496774194256.250322580645
211341912543.7696774194875.230322580645
2212769.613222.3096774194-452.709677419354
2313315.513535.7496774194-220.249677419354
2415332.915270.149677419462.7503225806468
251424313647.3513092979595.648690702097
2613824.413989.4913092979-165.091309297913
2714962.914868.991309297993.9086907020875
2813202.913659.8513092979-456.951309297914
291219912027.5313092979171.468690702085
3015508.914906.4826185958602.417381404173
3114199.815173.6226185958-973.822618595827
3215169.614730.1226185958439.477381404173
331405813516.2426185958541.757381404172
3413786.214194.7826185958-408.582618595827
3514147.914508.2226185958-360.322618595827
3616541.716242.6226185958299.077381404175
3713587.514619.8242504744-1032.32425047438
3815582.414961.9642504744620.435749525614
3915802.815841.4642504744-38.6642504743856
4014130.514632.3242504744-501.824250474387
4112923.213000.0042504744-76.804250474387
4215612.215895.8990132827-283.69901328273
4316033.716163.0390132827-129.339013282731
4416036.615719.5390132827317.060986717268
4514037.814505.6590132827-467.859013282734
4615330.615184.1990132827146.400986717268
4715038.315497.6390132827-459.339013282732
4817401.817232.0390132827169.760986717268
4914992.515609.2406451613-616.740645161281
5016043.715951.380645161392.3193548387102
5116929.616830.880645161398.7193548387087
5215921.315621.7406451613299.559354838707
5314417.213989.4206451613427.779354838708
541596116868.3719544592-907.371954459204
5517851.917135.5119544592716.388045540797
5616483.916692.0119544592-208.111954459204
5714215.515478.1319544592-1262.63195445921
5817429.716156.67195445921273.02804554080
5917839.516470.11195445921369.38804554080
6017629.218204.5119544592-575.311954459204

\begin{tabular}{lllllllll}
\hline
Multiple Linear Regression - Actuals, Interpolation, and Residuals \tabularnewline
Time or Index & Actuals & InterpolationForecast & ResidualsPrediction Error \tabularnewline
1 & 12300 & 11702.405426945 & 597.594573054989 \tabularnewline
2 & 12092.8 & 12044.5454269450 & 48.2545730550292 \tabularnewline
3 & 12380.8 & 12924.0454269450 & -543.245426944971 \tabularnewline
4 & 12196.9 & 11714.9054269450 & 481.994573055034 \tabularnewline
5 & 9455 & 10082.5854269450 & -627.585426944965 \tabularnewline
6 & 13168 & 12961.5367362429 & 206.463263757115 \tabularnewline
7 & 13427.9 & 13228.6767362429 & 199.223263757114 \tabularnewline
8 & 11980.5 & 12785.1767362429 & -804.676736242883 \tabularnewline
9 & 11884.8 & 11571.2967362429 & 313.503263757121 \tabularnewline
10 & 11691.7 & 12249.8367362429 & -558.136736242882 \tabularnewline
11 & 12233.8 & 12563.2767362429 & -329.476736242883 \tabularnewline
12 & 14341.4 & 14297.6767362429 & 43.7232637571157 \tabularnewline
13 & 13130.7 & 12674.8783681214 & 455.82163187857 \tabularnewline
14 & 12421.1 & 13017.0183681214 & -595.918368121441 \tabularnewline
15 & 14285.8 & 13896.5183681214 & 389.28163187856 \tabularnewline
16 & 12864.6 & 12687.3783681214 & 177.221631878559 \tabularnewline
17 & 11160.2 & 11055.0583681214 & 105.141631878559 \tabularnewline
18 & 14316.2 & 13934.0096774194 & 382.190322580647 \tabularnewline
19 & 14388.7 & 14201.1496774194 & 187.550322580647 \tabularnewline
20 & 14013.9 & 13757.6496774194 & 256.250322580645 \tabularnewline
21 & 13419 & 12543.7696774194 & 875.230322580645 \tabularnewline
22 & 12769.6 & 13222.3096774194 & -452.709677419354 \tabularnewline
23 & 13315.5 & 13535.7496774194 & -220.249677419354 \tabularnewline
24 & 15332.9 & 15270.1496774194 & 62.7503225806468 \tabularnewline
25 & 14243 & 13647.3513092979 & 595.648690702097 \tabularnewline
26 & 13824.4 & 13989.4913092979 & -165.091309297913 \tabularnewline
27 & 14962.9 & 14868.9913092979 & 93.9086907020875 \tabularnewline
28 & 13202.9 & 13659.8513092979 & -456.951309297914 \tabularnewline
29 & 12199 & 12027.5313092979 & 171.468690702085 \tabularnewline
30 & 15508.9 & 14906.4826185958 & 602.417381404173 \tabularnewline
31 & 14199.8 & 15173.6226185958 & -973.822618595827 \tabularnewline
32 & 15169.6 & 14730.1226185958 & 439.477381404173 \tabularnewline
33 & 14058 & 13516.2426185958 & 541.757381404172 \tabularnewline
34 & 13786.2 & 14194.7826185958 & -408.582618595827 \tabularnewline
35 & 14147.9 & 14508.2226185958 & -360.322618595827 \tabularnewline
36 & 16541.7 & 16242.6226185958 & 299.077381404175 \tabularnewline
37 & 13587.5 & 14619.8242504744 & -1032.32425047438 \tabularnewline
38 & 15582.4 & 14961.9642504744 & 620.435749525614 \tabularnewline
39 & 15802.8 & 15841.4642504744 & -38.6642504743856 \tabularnewline
40 & 14130.5 & 14632.3242504744 & -501.824250474387 \tabularnewline
41 & 12923.2 & 13000.0042504744 & -76.804250474387 \tabularnewline
42 & 15612.2 & 15895.8990132827 & -283.69901328273 \tabularnewline
43 & 16033.7 & 16163.0390132827 & -129.339013282731 \tabularnewline
44 & 16036.6 & 15719.5390132827 & 317.060986717268 \tabularnewline
45 & 14037.8 & 14505.6590132827 & -467.859013282734 \tabularnewline
46 & 15330.6 & 15184.1990132827 & 146.400986717268 \tabularnewline
47 & 15038.3 & 15497.6390132827 & -459.339013282732 \tabularnewline
48 & 17401.8 & 17232.0390132827 & 169.760986717268 \tabularnewline
49 & 14992.5 & 15609.2406451613 & -616.740645161281 \tabularnewline
50 & 16043.7 & 15951.3806451613 & 92.3193548387102 \tabularnewline
51 & 16929.6 & 16830.8806451613 & 98.7193548387087 \tabularnewline
52 & 15921.3 & 15621.7406451613 & 299.559354838707 \tabularnewline
53 & 14417.2 & 13989.4206451613 & 427.779354838708 \tabularnewline
54 & 15961 & 16868.3719544592 & -907.371954459204 \tabularnewline
55 & 17851.9 & 17135.5119544592 & 716.388045540797 \tabularnewline
56 & 16483.9 & 16692.0119544592 & -208.111954459204 \tabularnewline
57 & 14215.5 & 15478.1319544592 & -1262.63195445921 \tabularnewline
58 & 17429.7 & 16156.6719544592 & 1273.02804554080 \tabularnewline
59 & 17839.5 & 16470.1119544592 & 1369.38804554080 \tabularnewline
60 & 17629.2 & 18204.5119544592 & -575.311954459204 \tabularnewline
\hline
\end{tabular}
%Source: https://freestatistics.org/blog/index.php?pk=25484&T=4

[TABLE]
[ROW][C]Multiple Linear Regression - Actuals, Interpolation, and Residuals[/C][/ROW]
[ROW][C]Time or Index[/C][C]Actuals[/C][C]InterpolationForecast[/C][C]ResidualsPrediction Error[/C][/ROW]
[ROW][C]1[/C][C]12300[/C][C]11702.405426945[/C][C]597.594573054989[/C][/ROW]
[ROW][C]2[/C][C]12092.8[/C][C]12044.5454269450[/C][C]48.2545730550292[/C][/ROW]
[ROW][C]3[/C][C]12380.8[/C][C]12924.0454269450[/C][C]-543.245426944971[/C][/ROW]
[ROW][C]4[/C][C]12196.9[/C][C]11714.9054269450[/C][C]481.994573055034[/C][/ROW]
[ROW][C]5[/C][C]9455[/C][C]10082.5854269450[/C][C]-627.585426944965[/C][/ROW]
[ROW][C]6[/C][C]13168[/C][C]12961.5367362429[/C][C]206.463263757115[/C][/ROW]
[ROW][C]7[/C][C]13427.9[/C][C]13228.6767362429[/C][C]199.223263757114[/C][/ROW]
[ROW][C]8[/C][C]11980.5[/C][C]12785.1767362429[/C][C]-804.676736242883[/C][/ROW]
[ROW][C]9[/C][C]11884.8[/C][C]11571.2967362429[/C][C]313.503263757121[/C][/ROW]
[ROW][C]10[/C][C]11691.7[/C][C]12249.8367362429[/C][C]-558.136736242882[/C][/ROW]
[ROW][C]11[/C][C]12233.8[/C][C]12563.2767362429[/C][C]-329.476736242883[/C][/ROW]
[ROW][C]12[/C][C]14341.4[/C][C]14297.6767362429[/C][C]43.7232637571157[/C][/ROW]
[ROW][C]13[/C][C]13130.7[/C][C]12674.8783681214[/C][C]455.82163187857[/C][/ROW]
[ROW][C]14[/C][C]12421.1[/C][C]13017.0183681214[/C][C]-595.918368121441[/C][/ROW]
[ROW][C]15[/C][C]14285.8[/C][C]13896.5183681214[/C][C]389.28163187856[/C][/ROW]
[ROW][C]16[/C][C]12864.6[/C][C]12687.3783681214[/C][C]177.221631878559[/C][/ROW]
[ROW][C]17[/C][C]11160.2[/C][C]11055.0583681214[/C][C]105.141631878559[/C][/ROW]
[ROW][C]18[/C][C]14316.2[/C][C]13934.0096774194[/C][C]382.190322580647[/C][/ROW]
[ROW][C]19[/C][C]14388.7[/C][C]14201.1496774194[/C][C]187.550322580647[/C][/ROW]
[ROW][C]20[/C][C]14013.9[/C][C]13757.6496774194[/C][C]256.250322580645[/C][/ROW]
[ROW][C]21[/C][C]13419[/C][C]12543.7696774194[/C][C]875.230322580645[/C][/ROW]
[ROW][C]22[/C][C]12769.6[/C][C]13222.3096774194[/C][C]-452.709677419354[/C][/ROW]
[ROW][C]23[/C][C]13315.5[/C][C]13535.7496774194[/C][C]-220.249677419354[/C][/ROW]
[ROW][C]24[/C][C]15332.9[/C][C]15270.1496774194[/C][C]62.7503225806468[/C][/ROW]
[ROW][C]25[/C][C]14243[/C][C]13647.3513092979[/C][C]595.648690702097[/C][/ROW]
[ROW][C]26[/C][C]13824.4[/C][C]13989.4913092979[/C][C]-165.091309297913[/C][/ROW]
[ROW][C]27[/C][C]14962.9[/C][C]14868.9913092979[/C][C]93.9086907020875[/C][/ROW]
[ROW][C]28[/C][C]13202.9[/C][C]13659.8513092979[/C][C]-456.951309297914[/C][/ROW]
[ROW][C]29[/C][C]12199[/C][C]12027.5313092979[/C][C]171.468690702085[/C][/ROW]
[ROW][C]30[/C][C]15508.9[/C][C]14906.4826185958[/C][C]602.417381404173[/C][/ROW]
[ROW][C]31[/C][C]14199.8[/C][C]15173.6226185958[/C][C]-973.822618595827[/C][/ROW]
[ROW][C]32[/C][C]15169.6[/C][C]14730.1226185958[/C][C]439.477381404173[/C][/ROW]
[ROW][C]33[/C][C]14058[/C][C]13516.2426185958[/C][C]541.757381404172[/C][/ROW]
[ROW][C]34[/C][C]13786.2[/C][C]14194.7826185958[/C][C]-408.582618595827[/C][/ROW]
[ROW][C]35[/C][C]14147.9[/C][C]14508.2226185958[/C][C]-360.322618595827[/C][/ROW]
[ROW][C]36[/C][C]16541.7[/C][C]16242.6226185958[/C][C]299.077381404175[/C][/ROW]
[ROW][C]37[/C][C]13587.5[/C][C]14619.8242504744[/C][C]-1032.32425047438[/C][/ROW]
[ROW][C]38[/C][C]15582.4[/C][C]14961.9642504744[/C][C]620.435749525614[/C][/ROW]
[ROW][C]39[/C][C]15802.8[/C][C]15841.4642504744[/C][C]-38.6642504743856[/C][/ROW]
[ROW][C]40[/C][C]14130.5[/C][C]14632.3242504744[/C][C]-501.824250474387[/C][/ROW]
[ROW][C]41[/C][C]12923.2[/C][C]13000.0042504744[/C][C]-76.804250474387[/C][/ROW]
[ROW][C]42[/C][C]15612.2[/C][C]15895.8990132827[/C][C]-283.69901328273[/C][/ROW]
[ROW][C]43[/C][C]16033.7[/C][C]16163.0390132827[/C][C]-129.339013282731[/C][/ROW]
[ROW][C]44[/C][C]16036.6[/C][C]15719.5390132827[/C][C]317.060986717268[/C][/ROW]
[ROW][C]45[/C][C]14037.8[/C][C]14505.6590132827[/C][C]-467.859013282734[/C][/ROW]
[ROW][C]46[/C][C]15330.6[/C][C]15184.1990132827[/C][C]146.400986717268[/C][/ROW]
[ROW][C]47[/C][C]15038.3[/C][C]15497.6390132827[/C][C]-459.339013282732[/C][/ROW]
[ROW][C]48[/C][C]17401.8[/C][C]17232.0390132827[/C][C]169.760986717268[/C][/ROW]
[ROW][C]49[/C][C]14992.5[/C][C]15609.2406451613[/C][C]-616.740645161281[/C][/ROW]
[ROW][C]50[/C][C]16043.7[/C][C]15951.3806451613[/C][C]92.3193548387102[/C][/ROW]
[ROW][C]51[/C][C]16929.6[/C][C]16830.8806451613[/C][C]98.7193548387087[/C][/ROW]
[ROW][C]52[/C][C]15921.3[/C][C]15621.7406451613[/C][C]299.559354838707[/C][/ROW]
[ROW][C]53[/C][C]14417.2[/C][C]13989.4206451613[/C][C]427.779354838708[/C][/ROW]
[ROW][C]54[/C][C]15961[/C][C]16868.3719544592[/C][C]-907.371954459204[/C][/ROW]
[ROW][C]55[/C][C]17851.9[/C][C]17135.5119544592[/C][C]716.388045540797[/C][/ROW]
[ROW][C]56[/C][C]16483.9[/C][C]16692.0119544592[/C][C]-208.111954459204[/C][/ROW]
[ROW][C]57[/C][C]14215.5[/C][C]15478.1319544592[/C][C]-1262.63195445921[/C][/ROW]
[ROW][C]58[/C][C]17429.7[/C][C]16156.6719544592[/C][C]1273.02804554080[/C][/ROW]
[ROW][C]59[/C][C]17839.5[/C][C]16470.1119544592[/C][C]1369.38804554080[/C][/ROW]
[ROW][C]60[/C][C]17629.2[/C][C]18204.5119544592[/C][C]-575.311954459204[/C][/ROW]
[/TABLE]
Source: https://freestatistics.org/blog/index.php?pk=25484&T=4

Globally Unique Identifier (entire table): ba.freestatistics.org/blog/index.php?pk=25484&T=4

As an alternative you can also use a QR Code:  

The GUIDs for individual cells are displayed in the table below:

Multiple Linear Regression - Actuals, Interpolation, and Residuals
Time or IndexActualsInterpolationForecastResidualsPrediction Error
11230011702.405426945597.594573054989
212092.812044.545426945048.2545730550292
312380.812924.0454269450-543.245426944971
412196.911714.9054269450481.994573055034
5945510082.5854269450-627.585426944965
61316812961.5367362429206.463263757115
713427.913228.6767362429199.223263757114
811980.512785.1767362429-804.676736242883
911884.811571.2967362429313.503263757121
1011691.712249.8367362429-558.136736242882
1112233.812563.2767362429-329.476736242883
1214341.414297.676736242943.7232637571157
1313130.712674.8783681214455.82163187857
1412421.113017.0183681214-595.918368121441
1514285.813896.5183681214389.28163187856
1612864.612687.3783681214177.221631878559
1711160.211055.0583681214105.141631878559
1814316.213934.0096774194382.190322580647
1914388.714201.1496774194187.550322580647
2014013.913757.6496774194256.250322580645
211341912543.7696774194875.230322580645
2212769.613222.3096774194-452.709677419354
2313315.513535.7496774194-220.249677419354
2415332.915270.149677419462.7503225806468
251424313647.3513092979595.648690702097
2613824.413989.4913092979-165.091309297913
2714962.914868.991309297993.9086907020875
2813202.913659.8513092979-456.951309297914
291219912027.5313092979171.468690702085
3015508.914906.4826185958602.417381404173
3114199.815173.6226185958-973.822618595827
3215169.614730.1226185958439.477381404173
331405813516.2426185958541.757381404172
3413786.214194.7826185958-408.582618595827
3514147.914508.2226185958-360.322618595827
3616541.716242.6226185958299.077381404175
3713587.514619.8242504744-1032.32425047438
3815582.414961.9642504744620.435749525614
3915802.815841.4642504744-38.6642504743856
4014130.514632.3242504744-501.824250474387
4112923.213000.0042504744-76.804250474387
4215612.215895.8990132827-283.69901328273
4316033.716163.0390132827-129.339013282731
4416036.615719.5390132827317.060986717268
4514037.814505.6590132827-467.859013282734
4615330.615184.1990132827146.400986717268
4715038.315497.6390132827-459.339013282732
4817401.817232.0390132827169.760986717268
4914992.515609.2406451613-616.740645161281
5016043.715951.380645161392.3193548387102
5116929.616830.880645161398.7193548387087
5215921.315621.7406451613299.559354838707
5314417.213989.4206451613427.779354838708
541596116868.3719544592-907.371954459204
5517851.917135.5119544592716.388045540797
5616483.916692.0119544592-208.111954459204
5714215.515478.1319544592-1262.63195445921
5817429.716156.67195445921273.02804554080
5917839.516470.11195445921369.38804554080
6017629.218204.5119544592-575.311954459204


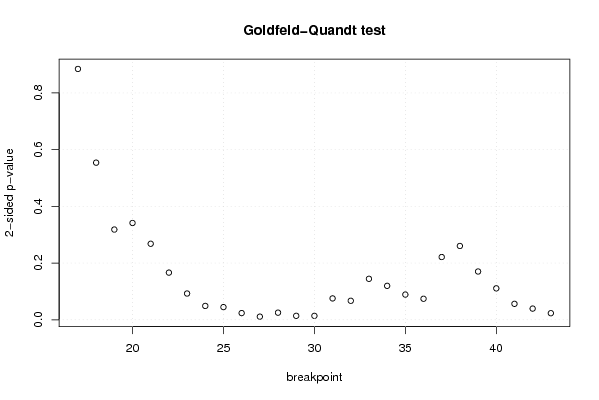
Goldfeld-Quandt test for Heteroskedasticity
p-valuesAlternative Hypothesis
breakpoint indexgreater2-sidedless
170.442251436059720.884502872119440.55774856394028
180.2770063897217420.5540127794434850.722993610278257
190.1590727792152570.3181455584305140.840927220784743
200.170697679447040.341395358894080.82930232055296
210.1340346071846410.2680692143692830.865965392815359
220.08314254970425190.1662850994085040.916857450295748
230.04628009395288350.09256018790576710.953719906047116
240.02443263898568670.04886527797137340.975567361014313
250.02233271011329390.04466542022658780.977667289886706
260.01178001982456730.02356003964913460.988219980175433
270.005502994562418310.01100598912483660.994497005437582
280.01254196938239140.02508393876478280.987458030617609
290.006971655196678670.01394331039335730.993028344803321
300.006929885392336360.01385977078467270.993070114607664
310.03767907662763240.07535815325526490.962320923372368
320.03346625240106530.06693250480213060.966533747598935
330.07219978338451720.1443995667690340.927800216615483
340.05985295988741470.1197059197748290.940147040112585
350.04443608181493520.08887216362987030.955563918185065
360.03704743254666910.07409486509333820.96295256745333
370.1106167334514910.2212334669029830.889383266548509
380.1301141963643630.2602283927287260.869885803635637
390.08511292263770370.1702258452754070.914887077362296
400.05542824824833510.1108564964966700.944571751751665
410.02810645331894190.05621290663788390.971893546681058
420.01971554921280570.03943109842561140.980284450787194
430.01158171815771840.02316343631543670.988418281842282

\begin{tabular}{lllllllll}
\hline
Goldfeld-Quandt test for Heteroskedasticity \tabularnewline
p-values & Alternative Hypothesis \tabularnewline
breakpoint index & greater & 2-sided & less \tabularnewline
17 & 0.44225143605972 & 0.88450287211944 & 0.55774856394028 \tabularnewline
18 & 0.277006389721742 & 0.554012779443485 & 0.722993610278257 \tabularnewline
19 & 0.159072779215257 & 0.318145558430514 & 0.840927220784743 \tabularnewline
20 & 0.17069767944704 & 0.34139535889408 & 0.82930232055296 \tabularnewline
21 & 0.134034607184641 & 0.268069214369283 & 0.865965392815359 \tabularnewline
22 & 0.0831425497042519 & 0.166285099408504 & 0.916857450295748 \tabularnewline
23 & 0.0462800939528835 & 0.0925601879057671 & 0.953719906047116 \tabularnewline
24 & 0.0244326389856867 & 0.0488652779713734 & 0.975567361014313 \tabularnewline
25 & 0.0223327101132939 & 0.0446654202265878 & 0.977667289886706 \tabularnewline
26 & 0.0117800198245673 & 0.0235600396491346 & 0.988219980175433 \tabularnewline
27 & 0.00550299456241831 & 0.0110059891248366 & 0.994497005437582 \tabularnewline
28 & 0.0125419693823914 & 0.0250839387647828 & 0.987458030617609 \tabularnewline
29 & 0.00697165519667867 & 0.0139433103933573 & 0.993028344803321 \tabularnewline
30 & 0.00692988539233636 & 0.0138597707846727 & 0.993070114607664 \tabularnewline
31 & 0.0376790766276324 & 0.0753581532552649 & 0.962320923372368 \tabularnewline
32 & 0.0334662524010653 & 0.0669325048021306 & 0.966533747598935 \tabularnewline
33 & 0.0721997833845172 & 0.144399566769034 & 0.927800216615483 \tabularnewline
34 & 0.0598529598874147 & 0.119705919774829 & 0.940147040112585 \tabularnewline
35 & 0.0444360818149352 & 0.0888721636298703 & 0.955563918185065 \tabularnewline
36 & 0.0370474325466691 & 0.0740948650933382 & 0.96295256745333 \tabularnewline
37 & 0.110616733451491 & 0.221233466902983 & 0.889383266548509 \tabularnewline
38 & 0.130114196364363 & 0.260228392728726 & 0.869885803635637 \tabularnewline
39 & 0.0851129226377037 & 0.170225845275407 & 0.914887077362296 \tabularnewline
40 & 0.0554282482483351 & 0.110856496496670 & 0.944571751751665 \tabularnewline
41 & 0.0281064533189419 & 0.0562129066378839 & 0.971893546681058 \tabularnewline
42 & 0.0197155492128057 & 0.0394310984256114 & 0.980284450787194 \tabularnewline
43 & 0.0115817181577184 & 0.0231634363154367 & 0.988418281842282 \tabularnewline
\hline
\end{tabular}
%Source: https://freestatistics.org/blog/index.php?pk=25484&T=5

[TABLE]
[ROW][C]Goldfeld-Quandt test for Heteroskedasticity[/C][/ROW]
[ROW][C]p-values[/C][C]Alternative Hypothesis[/C][/ROW]
[ROW][C]breakpoint index[/C][C]greater[/C][C]2-sided[/C][C]less[/C][/ROW]
[ROW][C]17[/C][C]0.44225143605972[/C][C]0.88450287211944[/C][C]0.55774856394028[/C][/ROW]
[ROW][C]18[/C][C]0.277006389721742[/C][C]0.554012779443485[/C][C]0.722993610278257[/C][/ROW]
[ROW][C]19[/C][C]0.159072779215257[/C][C]0.318145558430514[/C][C]0.840927220784743[/C][/ROW]
[ROW][C]20[/C][C]0.17069767944704[/C][C]0.34139535889408[/C][C]0.82930232055296[/C][/ROW]
[ROW][C]21[/C][C]0.134034607184641[/C][C]0.268069214369283[/C][C]0.865965392815359[/C][/ROW]
[ROW][C]22[/C][C]0.0831425497042519[/C][C]0.166285099408504[/C][C]0.916857450295748[/C][/ROW]
[ROW][C]23[/C][C]0.0462800939528835[/C][C]0.0925601879057671[/C][C]0.953719906047116[/C][/ROW]
[ROW][C]24[/C][C]0.0244326389856867[/C][C]0.0488652779713734[/C][C]0.975567361014313[/C][/ROW]
[ROW][C]25[/C][C]0.0223327101132939[/C][C]0.0446654202265878[/C][C]0.977667289886706[/C][/ROW]
[ROW][C]26[/C][C]0.0117800198245673[/C][C]0.0235600396491346[/C][C]0.988219980175433[/C][/ROW]
[ROW][C]27[/C][C]0.00550299456241831[/C][C]0.0110059891248366[/C][C]0.994497005437582[/C][/ROW]
[ROW][C]28[/C][C]0.0125419693823914[/C][C]0.0250839387647828[/C][C]0.987458030617609[/C][/ROW]
[ROW][C]29[/C][C]0.00697165519667867[/C][C]0.0139433103933573[/C][C]0.993028344803321[/C][/ROW]
[ROW][C]30[/C][C]0.00692988539233636[/C][C]0.0138597707846727[/C][C]0.993070114607664[/C][/ROW]
[ROW][C]31[/C][C]0.0376790766276324[/C][C]0.0753581532552649[/C][C]0.962320923372368[/C][/ROW]
[ROW][C]32[/C][C]0.0334662524010653[/C][C]0.0669325048021306[/C][C]0.966533747598935[/C][/ROW]
[ROW][C]33[/C][C]0.0721997833845172[/C][C]0.144399566769034[/C][C]0.927800216615483[/C][/ROW]
[ROW][C]34[/C][C]0.0598529598874147[/C][C]0.119705919774829[/C][C]0.940147040112585[/C][/ROW]
[ROW][C]35[/C][C]0.0444360818149352[/C][C]0.0888721636298703[/C][C]0.955563918185065[/C][/ROW]
[ROW][C]36[/C][C]0.0370474325466691[/C][C]0.0740948650933382[/C][C]0.96295256745333[/C][/ROW]
[ROW][C]37[/C][C]0.110616733451491[/C][C]0.221233466902983[/C][C]0.889383266548509[/C][/ROW]
[ROW][C]38[/C][C]0.130114196364363[/C][C]0.260228392728726[/C][C]0.869885803635637[/C][/ROW]
[ROW][C]39[/C][C]0.0851129226377037[/C][C]0.170225845275407[/C][C]0.914887077362296[/C][/ROW]
[ROW][C]40[/C][C]0.0554282482483351[/C][C]0.110856496496670[/C][C]0.944571751751665[/C][/ROW]
[ROW][C]41[/C][C]0.0281064533189419[/C][C]0.0562129066378839[/C][C]0.971893546681058[/C][/ROW]
[ROW][C]42[/C][C]0.0197155492128057[/C][C]0.0394310984256114[/C][C]0.980284450787194[/C][/ROW]
[ROW][C]43[/C][C]0.0115817181577184[/C][C]0.0231634363154367[/C][C]0.988418281842282[/C][/ROW]
[/TABLE]
Source: https://freestatistics.org/blog/index.php?pk=25484&T=5

Globally Unique Identifier (entire table): ba.freestatistics.org/blog/index.php?pk=25484&T=5

As an alternative you can also use a QR Code:  

The GUIDs for individual cells are displayed in the table below:

Goldfeld-Quandt test for Heteroskedasticity
p-valuesAlternative Hypothesis
breakpoint indexgreater2-sidedless
170.442251436059720.884502872119440.55774856394028
180.2770063897217420.5540127794434850.722993610278257
190.1590727792152570.3181455584305140.840927220784743
200.170697679447040.341395358894080.82930232055296
210.1340346071846410.2680692143692830.865965392815359
220.08314254970425190.1662850994085040.916857450295748
230.04628009395288350.09256018790576710.953719906047116
240.02443263898568670.04886527797137340.975567361014313
250.02233271011329390.04466542022658780.977667289886706
260.01178001982456730.02356003964913460.988219980175433
270.005502994562418310.01100598912483660.994497005437582
280.01254196938239140.02508393876478280.987458030617609
290.006971655196678670.01394331039335730.993028344803321
300.006929885392336360.01385977078467270.993070114607664
310.03767907662763240.07535815325526490.962320923372368
320.03346625240106530.06693250480213060.966533747598935
330.07219978338451720.1443995667690340.927800216615483
340.05985295988741470.1197059197748290.940147040112585
350.04443608181493520.08887216362987030.955563918185065
360.03704743254666910.07409486509333820.96295256745333
370.1106167334514910.2212334669029830.889383266548509
380.1301141963643630.2602283927287260.869885803635637
390.08511292263770370.1702258452754070.914887077362296
400.05542824824833510.1108564964966700.944571751751665
410.02810645331894190.05621290663788390.971893546681058
420.01971554921280570.03943109842561140.980284450787194
430.01158171815771840.02316343631543670.988418281842282


Meta Analysis of Goldfeld-Quandt test for Heteroskedasticity
Description# significant tests% significant testsOK/NOK
1% type I error level00OK
5% type I error level90.333333333333333NOK
10% type I error level150.555555555555556NOK

\begin{tabular}{lllllllll}
\hline
Meta Analysis of Goldfeld-Quandt test for Heteroskedasticity \tabularnewline
Description & # significant tests & % significant tests & OK/NOK \tabularnewline
1% type I error level & 0 & 0 & OK \tabularnewline
5% type I error level & 9 & 0.333333333333333 & NOK \tabularnewline
10% type I error level & 15 & 0.555555555555556 & NOK \tabularnewline
\hline
\end{tabular}
%Source: https://freestatistics.org/blog/index.php?pk=25484&T=6

[TABLE]
[ROW][C]Meta Analysis of Goldfeld-Quandt test for Heteroskedasticity[/C][/ROW]
[ROW][C]Description[/C][C]# significant tests[/C][C]% significant tests[/C][C]OK/NOK[/C][/ROW]
[ROW][C]1% type I error level[/C][C]0[/C][C]0[/C][C]OK[/C][/ROW]
[ROW][C]5% type I error level[/C][C]9[/C][C]0.333333333333333[/C][C]NOK[/C][/ROW]
[ROW][C]10% type I error level[/C][C]15[/C][C]0.555555555555556[/C][C]NOK[/C][/ROW]
[/TABLE]
Source: https://freestatistics.org/blog/index.php?pk=25484&T=6

Globally Unique Identifier (entire table): ba.freestatistics.org/blog/index.php?pk=25484&T=6

As an alternative you can also use a QR Code:  

The GUIDs for individual cells are displayed in the table below:

Meta Analysis of Goldfeld-Quandt test for Heteroskedasticity
Description# significant tests% significant testsOK/NOK
1% type I error level00OK
5% type I error level90.333333333333333NOK
10% type I error level150.555555555555556NOK


Parameters (Session):
par1 = 1 ; par2 = Include Monthly Dummies ; par3 = Linear Trend ;
Parameters (R input):
par1 = 1 ; par2 = Include Monthly Dummies ; par3 = Linear Trend ;
R code (references can be found in the software module):
library(lattice)
library(lmtest)
n25 <- 25 #minimum number of obs. for Goldfeld-Quandt test
par1 <- as.numeric(par1)
x <- t(y)
k <- length(x[1,])
n <- length(x[,1])
x1 <- cbind(x[,par1], x[,1:k!=par1])
mycolnames <- c(colnames(x)[par1], colnames(x)[1:k!=par1])
colnames(x1) <- mycolnames #colnames(x)[par1]
x <- x1
if (par3 == 'First Differences'){
x2 <- array(0, dim=c(n-1,k), dimnames=list(1:(n-1), paste('(1-B)',colnames(x),sep='')))
for (i in 1:n-1) {
for (j in 1:k) {
x2[i,j] <- x[i+1,j] - x[i,j]
}
}
x <- x2
}
if (par2 == 'Include Monthly Dummies'){
x2 <- array(0, dim=c(n,11), dimnames=list(1:n, paste('M', seq(1:11), sep ='')))
for (i in 1:11){
x2[seq(i,n,12),i] <- 1
}
x <- cbind(x, x2)
}
if (par2 == 'Include Quarterly Dummies'){
x2 <- array(0, dim=c(n,3), dimnames=list(1:n, paste('Q', seq(1:3), sep ='')))
for (i in 1:3){
x2[seq(i,n,4),i] <- 1
}
x <- cbind(x, x2)
}
k <- length(x[1,])
if (par3 == 'Linear Trend'){
x <- cbind(x, c(1:n))
colnames(x)[k+1] <- 't'
}
x
k <- length(x[1,])
df <- as.data.frame(x)
(mylm <- lm(df))
(mysum <- summary(mylm))
if (n > n25) {
kp3 <- k + 3
nmkm3 <- n - k - 3
gqarr <- array(NA, dim=c(nmkm3-kp3+1,3))
numgqtests <- 0
numsignificant1 <- 0
numsignificant5 <- 0
numsignificant10 <- 0
for (mypoint in kp3:nmkm3) {
j <- 0
numgqtests <- numgqtests + 1
for (myalt in c('greater', 'two.sided', 'less')) {
j <- j + 1
gqarr[mypoint-kp3+1,j] <- gqtest(mylm, point=mypoint, alternative=myalt)$p.value
}
if (gqarr[mypoint-kp3+1,2] < 0.01) numsignificant1 <- numsignificant1 + 1
if (gqarr[mypoint-kp3+1,2] < 0.05) numsignificant5 <- numsignificant5 + 1
if (gqarr[mypoint-kp3+1,2] < 0.10) numsignificant10 <- numsignificant10 + 1
}
gqarr
}
bitmap(file='test0.png')
plot(x[,1], type='l', main='Actuals and Interpolation', ylab='value of Actuals and Interpolation (dots)', xlab='time or index')
points(x[,1]-mysum$resid)
grid()
dev.off()
bitmap(file='test1.png')
plot(mysum$resid, type='b', pch=19, main='Residuals', ylab='value of Residuals', xlab='time or index')
grid()
dev.off()
bitmap(file='test2.png')
hist(mysum$resid, main='Residual Histogram', xlab='values of Residuals')
grid()
dev.off()
bitmap(file='test3.png')
densityplot(~mysum$resid,col='black',main='Residual Density Plot', xlab='values of Residuals')
dev.off()
bitmap(file='test4.png')
qqnorm(mysum$resid, main='Residual Normal Q-Q Plot')
qqline(mysum$resid)
grid()
dev.off()
(myerror <- as.ts(mysum$resid))
bitmap(file='test5.png')
dum <- cbind(lag(myerror,k=1),myerror)
dum
dum1 <- dum[2:length(myerror),]
dum1
z <- as.data.frame(dum1)
z
plot(z,main=paste('Residual Lag plot, lowess, and regression line'), ylab='values of Residuals', xlab='lagged values of Residuals')
lines(lowess(z))
abline(lm(z))
grid()
dev.off()
bitmap(file='test6.png')
acf(mysum$resid, lag.max=length(mysum$resid)/2, main='Residual Autocorrelation Function')
grid()
dev.off()
bitmap(file='test7.png')
pacf(mysum$resid, lag.max=length(mysum$resid)/2, main='Residual Partial Autocorrelation Function')
grid()
dev.off()
bitmap(file='test8.png')
opar <- par(mfrow = c(2,2), oma = c(0, 0, 1.1, 0))
plot(mylm, las = 1, sub='Residual Diagnostics')
par(opar)
dev.off()
if (n > n25) {
bitmap(file='test9.png')
plot(kp3:nmkm3,gqarr[,2], main='Goldfeld-Quandt test',ylab='2-sided p-value',xlab='breakpoint')
grid()
dev.off()
}
load(file='createtable')
a<-table.start()
a<-table.row.start(a)
a<-table.element(a, 'Multiple Linear Regression - Estimated Regression Equation', 1, TRUE)
a<-table.row.end(a)
myeq <- colnames(x)[1]
myeq <- paste(myeq, '[t] = ', sep='')
for (i in 1:k){
if (mysum$coefficients[i,1] > 0) myeq <- paste(myeq, '+', '')
myeq <- paste(myeq, mysum$coefficients[i,1], sep=' ')
if (rownames(mysum$coefficients)[i] != '(Intercept)') {
myeq <- paste(myeq, rownames(mysum$coefficients)[i], sep='')
if (rownames(mysum$coefficients)[i] != 't') myeq <- paste(myeq, '[t]', sep='')
}
}
myeq <- paste(myeq, ' + e[t]')
a<-table.row.start(a)
a<-table.element(a, myeq)
a<-table.row.end(a)
a<-table.end(a)
table.save(a,file='mytable1.tab')
a<-table.start()
a<-table.row.start(a)
a<-table.element(a,hyperlink('ols1.htm','Multiple Linear Regression - Ordinary Least Squares',''), 6, TRUE)
a<-table.row.end(a)
a<-table.row.start(a)
a<-table.element(a,'Variable',header=TRUE)
a<-table.element(a,'Parameter',header=TRUE)
a<-table.element(a,'S.D.',header=TRUE)
a<-table.element(a,'T-STAT
H0: parameter = 0',header=TRUE)
a<-table.element(a,'2-tail p-value',header=TRUE)
a<-table.element(a,'1-tail p-value',header=TRUE)
a<-table.row.end(a)
for (i in 1:k){
a<-table.row.start(a)
a<-table.element(a,rownames(mysum$coefficients)[i],header=TRUE)
a<-table.element(a,mysum$coefficients[i,1])
a<-table.element(a, round(mysum$coefficients[i,2],6))
a<-table.element(a, round(mysum$coefficients[i,3],4))
a<-table.element(a, round(mysum$coefficients[i,4],6))
a<-table.element(a, round(mysum$coefficients[i,4]/2,6))
a<-table.row.end(a)
}
a<-table.end(a)
table.save(a,file='mytable2.tab')
a<-table.start()
a<-table.row.start(a)
a<-table.element(a, 'Multiple Linear Regression - Regression Statistics', 2, TRUE)
a<-table.row.end(a)
a<-table.row.start(a)
a<-table.element(a, 'Multiple R',1,TRUE)
a<-table.element(a, sqrt(mysum$r.squared))
a<-table.row.end(a)
a<-table.row.start(a)
a<-table.element(a, 'R-squared',1,TRUE)
a<-table.element(a, mysum$r.squared)
a<-table.row.end(a)
a<-table.row.start(a)
a<-table.element(a, 'Adjusted R-squared',1,TRUE)
a<-table.element(a, mysum$adj.r.squared)
a<-table.row.end(a)
a<-table.row.start(a)
a<-table.element(a, 'F-TEST (value)',1,TRUE)
a<-table.element(a, mysum$fstatistic[1])
a<-table.row.end(a)
a<-table.row.start(a)
a<-table.element(a, 'F-TEST (DF numerator)',1,TRUE)
a<-table.element(a, mysum$fstatistic[2])
a<-table.row.end(a)
a<-table.row.start(a)
a<-table.element(a, 'F-TEST (DF denominator)',1,TRUE)
a<-table.element(a, mysum$fstatistic[3])
a<-table.row.end(a)
a<-table.row.start(a)
a<-table.element(a, 'p-value',1,TRUE)
a<-table.element(a, 1-pf(mysum$fstatistic[1],mysum$fstatistic[2],mysum$fstatistic[3]))
a<-table.row.end(a)
a<-table.row.start(a)
a<-table.element(a, 'Multiple Linear Regression - Residual Statistics', 2, TRUE)
a<-table.row.end(a)
a<-table.row.start(a)
a<-table.element(a, 'Residual Standard Deviation',1,TRUE)
a<-table.element(a, mysum$sigma)
a<-table.row.end(a)
a<-table.row.start(a)
a<-table.element(a, 'Sum Squared Residuals',1,TRUE)
a<-table.element(a, sum(myerror*myerror))
a<-table.row.end(a)
a<-table.end(a)
table.save(a,file='mytable3.tab')
a<-table.start()
a<-table.row.start(a)
a<-table.element(a, 'Multiple Linear Regression - Actuals, Interpolation, and Residuals', 4, TRUE)
a<-table.row.end(a)
a<-table.row.start(a)
a<-table.element(a, 'Time or Index', 1, TRUE)
a<-table.element(a, 'Actuals', 1, TRUE)
a<-table.element(a, 'Interpolation
Forecast', 1, TRUE)
a<-table.element(a, 'Residuals
Prediction Error', 1, TRUE)
a<-table.row.end(a)
for (i in 1:n) {
a<-table.row.start(a)
a<-table.element(a,i, 1, TRUE)
a<-table.element(a,x[i])
a<-table.element(a,x[i]-mysum$resid[i])
a<-table.element(a,mysum$resid[i])
a<-table.row.end(a)
}
a<-table.end(a)
table.save(a,file='mytable4.tab')
if (n > n25) {
a<-table.start()
a<-table.row.start(a)
a<-table.element(a,'Goldfeld-Quandt test for Heteroskedasticity',4,TRUE)
a<-table.row.end(a)
a<-table.row.start(a)
a<-table.element(a,'p-values',header=TRUE)
a<-table.element(a,'Alternative Hypothesis',3,header=TRUE)
a<-table.row.end(a)
a<-table.row.start(a)
a<-table.element(a,'breakpoint index',header=TRUE)
a<-table.element(a,'greater',header=TRUE)
a<-table.element(a,'2-sided',header=TRUE)
a<-table.element(a,'less',header=TRUE)
a<-table.row.end(a)
for (mypoint in kp3:nmkm3) {
a<-table.row.start(a)
a<-table.element(a,mypoint,header=TRUE)
a<-table.element(a,gqarr[mypoint-kp3+1,1])
a<-table.element(a,gqarr[mypoint-kp3+1,2])
a<-table.element(a,gqarr[mypoint-kp3+1,3])
a<-table.row.end(a)
}
a<-table.end(a)
table.save(a,file='mytable5.tab')
a<-table.start()
a<-table.row.start(a)
a<-table.element(a,'Meta Analysis of Goldfeld-Quandt test for Heteroskedasticity',4,TRUE)
a<-table.row.end(a)
a<-table.row.start(a)
a<-table.element(a,'Description',header=TRUE)
a<-table.element(a,'# significant tests',header=TRUE)
a<-table.element(a,'% significant tests',header=TRUE)
a<-table.element(a,'OK/NOK',header=TRUE)
a<-table.row.end(a)
a<-table.row.start(a)
a<-table.element(a,'1% type I error level',header=TRUE)
a<-table.element(a,numsignificant1)
a<-table.element(a,numsignificant1/numgqtests)
if (numsignificant1/numgqtests < 0.01) dum <- 'OK' else dum <- 'NOK'
a<-table.element(a,dum)
a<-table.row.end(a)
a<-table.row.start(a)
a<-table.element(a,'5% type I error level',header=TRUE)
a<-table.element(a,numsignificant5)
a<-table.element(a,numsignificant5/numgqtests)
if (numsignificant5/numgqtests < 0.05) dum <- 'OK' else dum <- 'NOK'
a<-table.element(a,dum)
a<-table.row.end(a)
a<-table.row.start(a)
a<-table.element(a,'10% type I error level',header=TRUE)
a<-table.element(a,numsignificant10)
a<-table.element(a,numsignificant10/numgqtests)
if (numsignificant10/numgqtests < 0.1) dum <- 'OK' else dum <- 'NOK'
a<-table.element(a,dum)
a<-table.row.end(a)
a<-table.end(a)
table.save(a,file='mytable6.tab')
}