Free Statistics

of Irreproducible Research!

Author's title

Author*The author of this computation has been verified*
R Software Modulerwasp_multipleregression.wasp
Title produced by softwareMultiple Regression
Date of computationMon, 24 Nov 2008 11:17:29 -0700
Cite this page as followsStatistical Computations at FreeStatistics.org, Office for Research Development and Education, URL https://freestatistics.org/blog/index.php?v=date/2008/Nov/24/t1227550704oc6quq0ra8x2qpp.htm/, Retrieved Tue, 14 May 2024 22:03:41 +0000
Statistical Computations at FreeStatistics.org, Office for Research Development and Education, URL https://freestatistics.org/blog/index.php?pk=25477, Retrieved Tue, 14 May 2024 22:03:41 +0000
QR Codes:

Original text written by user:
IsPrivate?No (this computation is public)
User-defined keywords
Estimated Impact137
Family? (F = Feedback message, R = changed R code, M = changed R Module, P = changed Parameters, D = changed Data)
F     [Multiple Regression] [] [2007-11-19 19:55:31] [b731da8b544846036771bbf9bf2f34ce]
-    D  [Multiple Regression] [] [2008-11-24 18:12:25] [063e4b67ad7d3a8a83eccec794cd5aa7]
-   PD      [Multiple Regression] [Case: the Seatbel...] [2008-11-24 18:17:29] [6797a1f4a60918966297e9d9220cabc2] [Current]
Feedback Forum

Post a new message
Dataseries X:
7.4	0
7.2	0
7.1	0
6.9	0
6.8	0
6.8	0
6.8	0
6.9	0
6.7	0
6.6	0
6.5	0
6.4	0
6.3	0
6.3	0
6.3	0
6.5	0
6.6	0
6.5	0
6.4	0
6.5	0
6.7	0
7.1	0
7.1	0
7.2	0
7.2	0
7.3	0
7.3	0
7.3	0
7.3	0
7.4	0
7.6	0
7.6	0
7.6	0
7.7	0
7.8	0
7.9	0
8.1	0
8.1	0
8.1	0
8.2	0
8.2	0
8.2	0
8.2	0
8.2	0
8.2	0
8.3	0
8.3	0
8.4	0
8.4	0
8.4	0
8.3	1
8	1
8	1
8.2	1
8.6	1
8.7	1
8.7	1
8.5	1
8.4	1
8.4	1
8.4	1
8.5	1
8.5	1
8.5	1
8.5	1
8.5	1
8.4	1
8.4	1
8.4	1
8.5	1
8.6	1
8.6	1
8.6	1
8.6	1
8.5	1
8.4	1
8.4	1
8.3	1
8.2	1
8.1	1
8.2	1
8.1	1
8	1
7.9	1
7.8	1
7.7	1
7.7	1
7.9	1
7.8	1
7.6	1
7.4	1
7.3	1
7.1	1
7.1	1
7	1
7	1
7	1
6.9	1
6.8	1
6.7	1
6.6	1
6.6	1


Summary of computational transaction
Raw Inputview raw input (R code)
Raw Outputview raw output of R engine
Computing time2 seconds
R Server'George Udny Yule' @ 72.249.76.132

\begin{tabular}{lllllllll}
\hline
Summary of computational transaction \tabularnewline
Raw Input & view raw input (R code)  \tabularnewline
Raw Output & view raw output of R engine  \tabularnewline
Computing time & 2 seconds \tabularnewline
R Server & 'George Udny Yule' @ 72.249.76.132 \tabularnewline
\hline
\end{tabular}
%Source: https://freestatistics.org/blog/index.php?pk=25477&T=0

[TABLE]
[ROW][C]Summary of computational transaction[/C][/ROW]
[ROW][C]Raw Input[/C][C]view raw input (R code) [/C][/ROW]
[ROW][C]Raw Output[/C][C]view raw output of R engine [/C][/ROW]
[ROW][C]Computing time[/C][C]2 seconds[/C][/ROW]
[ROW][C]R Server[/C][C]'George Udny Yule' @ 72.249.76.132[/C][/ROW]
[/TABLE]
Source: https://freestatistics.org/blog/index.php?pk=25477&T=0

Globally Unique Identifier (entire table): ba.freestatistics.org/blog/index.php?pk=25477&T=0

As an alternative you can also use a QR Code:  

The GUIDs for individual cells are displayed in the table below:

Summary of computational transaction
Raw Inputview raw input (R code)
Raw Outputview raw output of R engine
Computing time2 seconds
R Server'George Udny Yule' @ 72.249.76.132


Multiple Linear Regression - Estimated Regression Equation
y[t] = + 7.39270833333334 + 0.638958333333334x[t] + 0.000572916666670294M1[t] -0.0218865740740734M2[t] -0.137563657407408M3[t] -0.160023148148148M4[t] -0.182482638888889M5[t] -0.193831018518519M6[t] -0.0238136574074078M7[t] -0.0115509259259264M8[t] -0.0242881944444446M9[t] + 0.0129745370370371M10[t] -0.0122627314814816M11[t] + 0.000237268518518472t + e[t]

\begin{tabular}{lllllllll}
\hline
Multiple Linear Regression - Estimated Regression Equation \tabularnewline
y[t] =  +  7.39270833333334 +  0.638958333333334x[t] +  0.000572916666670294M1[t] -0.0218865740740734M2[t] -0.137563657407408M3[t] -0.160023148148148M4[t] -0.182482638888889M5[t] -0.193831018518519M6[t] -0.0238136574074078M7[t] -0.0115509259259264M8[t] -0.0242881944444446M9[t] +  0.0129745370370371M10[t] -0.0122627314814816M11[t] +  0.000237268518518472t  + e[t] \tabularnewline
\hline
\end{tabular}
%Source: https://freestatistics.org/blog/index.php?pk=25477&T=1

[TABLE]
[ROW][C]Multiple Linear Regression - Estimated Regression Equation[/C][/ROW]
[ROW][C]y[t] =  +  7.39270833333334 +  0.638958333333334x[t] +  0.000572916666670294M1[t] -0.0218865740740734M2[t] -0.137563657407408M3[t] -0.160023148148148M4[t] -0.182482638888889M5[t] -0.193831018518519M6[t] -0.0238136574074078M7[t] -0.0115509259259264M8[t] -0.0242881944444446M9[t] +  0.0129745370370371M10[t] -0.0122627314814816M11[t] +  0.000237268518518472t  + e[t][/C][/ROW]
[/TABLE]
Source: https://freestatistics.org/blog/index.php?pk=25477&T=1

Globally Unique Identifier (entire table): ba.freestatistics.org/blog/index.php?pk=25477&T=1

As an alternative you can also use a QR Code:  

The GUIDs for individual cells are displayed in the table below:

Multiple Linear Regression - Estimated Regression Equation
y[t] = + 7.39270833333334 + 0.638958333333334x[t] + 0.000572916666670294M1[t] -0.0218865740740734M2[t] -0.137563657407408M3[t] -0.160023148148148M4[t] -0.182482638888889M5[t] -0.193831018518519M6[t] -0.0238136574074078M7[t] -0.0115509259259264M8[t] -0.0242881944444446M9[t] + 0.0129745370370371M10[t] -0.0122627314814816M11[t] + 0.000237268518518472t + e[t]


Multiple Linear Regression - Ordinary Least Squares
VariableParameterS.D.T-STATH0: parameter = 02-tail p-value1-tail p-value
(Intercept)7.392708333333340.29118125.388700
x0.6389583333333340.2803922.27880.0250990.01255
M10.0005729166666702940.3415250.00170.9986650.499333
M2-0.02188657407407340.341415-0.06410.9490320.474516
M3-0.1375636574074080.342499-0.40160.6889180.344459
M4-0.1600231481481480.342146-0.46770.6411520.320576
M5-0.1824826388888890.341859-0.53380.5948290.297415
M6-0.1938310185185190.341638-0.56740.5719160.285958
M7-0.02381365740740780.351981-0.06770.9462130.473106
M8-0.01155092592592640.351692-0.03280.9738730.486937
M9-0.02428819444444460.351467-0.06910.9450630.472531
M100.01297453703703710.3513060.03690.9706230.485311
M11-0.01226273148148160.351209-0.03490.9722260.486113
t0.0002372685185184720.0047540.04990.9603070.480154

\begin{tabular}{lllllllll}
\hline
Multiple Linear Regression - Ordinary Least Squares \tabularnewline
Variable & Parameter & S.D. & T-STATH0: parameter = 0 & 2-tail p-value & 1-tail p-value \tabularnewline
(Intercept) & 7.39270833333334 & 0.291181 & 25.3887 & 0 & 0 \tabularnewline
x & 0.638958333333334 & 0.280392 & 2.2788 & 0.025099 & 0.01255 \tabularnewline
M1 & 0.000572916666670294 & 0.341525 & 0.0017 & 0.998665 & 0.499333 \tabularnewline
M2 & -0.0218865740740734 & 0.341415 & -0.0641 & 0.949032 & 0.474516 \tabularnewline
M3 & -0.137563657407408 & 0.342499 & -0.4016 & 0.688918 & 0.344459 \tabularnewline
M4 & -0.160023148148148 & 0.342146 & -0.4677 & 0.641152 & 0.320576 \tabularnewline
M5 & -0.182482638888889 & 0.341859 & -0.5338 & 0.594829 & 0.297415 \tabularnewline
M6 & -0.193831018518519 & 0.341638 & -0.5674 & 0.571916 & 0.285958 \tabularnewline
M7 & -0.0238136574074078 & 0.351981 & -0.0677 & 0.946213 & 0.473106 \tabularnewline
M8 & -0.0115509259259264 & 0.351692 & -0.0328 & 0.973873 & 0.486937 \tabularnewline
M9 & -0.0242881944444446 & 0.351467 & -0.0691 & 0.945063 & 0.472531 \tabularnewline
M10 & 0.0129745370370371 & 0.351306 & 0.0369 & 0.970623 & 0.485311 \tabularnewline
M11 & -0.0122627314814816 & 0.351209 & -0.0349 & 0.972226 & 0.486113 \tabularnewline
t & 0.000237268518518472 & 0.004754 & 0.0499 & 0.960307 & 0.480154 \tabularnewline
\hline
\end{tabular}
%Source: https://freestatistics.org/blog/index.php?pk=25477&T=2

[TABLE]
[ROW][C]Multiple Linear Regression - Ordinary Least Squares[/C][/ROW]
[ROW][C]Variable[/C][C]Parameter[/C][C]S.D.[/C][C]T-STATH0: parameter = 0[/C][C]2-tail p-value[/C][C]1-tail p-value[/C][/ROW]
[ROW][C](Intercept)[/C][C]7.39270833333334[/C][C]0.291181[/C][C]25.3887[/C][C]0[/C][C]0[/C][/ROW]
[ROW][C]x[/C][C]0.638958333333334[/C][C]0.280392[/C][C]2.2788[/C][C]0.025099[/C][C]0.01255[/C][/ROW]
[ROW][C]M1[/C][C]0.000572916666670294[/C][C]0.341525[/C][C]0.0017[/C][C]0.998665[/C][C]0.499333[/C][/ROW]
[ROW][C]M2[/C][C]-0.0218865740740734[/C][C]0.341415[/C][C]-0.0641[/C][C]0.949032[/C][C]0.474516[/C][/ROW]
[ROW][C]M3[/C][C]-0.137563657407408[/C][C]0.342499[/C][C]-0.4016[/C][C]0.688918[/C][C]0.344459[/C][/ROW]
[ROW][C]M4[/C][C]-0.160023148148148[/C][C]0.342146[/C][C]-0.4677[/C][C]0.641152[/C][C]0.320576[/C][/ROW]
[ROW][C]M5[/C][C]-0.182482638888889[/C][C]0.341859[/C][C]-0.5338[/C][C]0.594829[/C][C]0.297415[/C][/ROW]
[ROW][C]M6[/C][C]-0.193831018518519[/C][C]0.341638[/C][C]-0.5674[/C][C]0.571916[/C][C]0.285958[/C][/ROW]
[ROW][C]M7[/C][C]-0.0238136574074078[/C][C]0.351981[/C][C]-0.0677[/C][C]0.946213[/C][C]0.473106[/C][/ROW]
[ROW][C]M8[/C][C]-0.0115509259259264[/C][C]0.351692[/C][C]-0.0328[/C][C]0.973873[/C][C]0.486937[/C][/ROW]
[ROW][C]M9[/C][C]-0.0242881944444446[/C][C]0.351467[/C][C]-0.0691[/C][C]0.945063[/C][C]0.472531[/C][/ROW]
[ROW][C]M10[/C][C]0.0129745370370371[/C][C]0.351306[/C][C]0.0369[/C][C]0.970623[/C][C]0.485311[/C][/ROW]
[ROW][C]M11[/C][C]-0.0122627314814816[/C][C]0.351209[/C][C]-0.0349[/C][C]0.972226[/C][C]0.486113[/C][/ROW]
[ROW][C]t[/C][C]0.000237268518518472[/C][C]0.004754[/C][C]0.0499[/C][C]0.960307[/C][C]0.480154[/C][/ROW]
[/TABLE]
Source: https://freestatistics.org/blog/index.php?pk=25477&T=2

Globally Unique Identifier (entire table): ba.freestatistics.org/blog/index.php?pk=25477&T=2

As an alternative you can also use a QR Code:  

The GUIDs for individual cells are displayed in the table below:

Multiple Linear Regression - Ordinary Least Squares
VariableParameterS.D.T-STATH0: parameter = 02-tail p-value1-tail p-value
(Intercept)7.392708333333340.29118125.388700
x0.6389583333333340.2803922.27880.0250990.01255
M10.0005729166666702940.3415250.00170.9986650.499333
M2-0.02188657407407340.341415-0.06410.9490320.474516
M3-0.1375636574074080.342499-0.40160.6889180.344459
M4-0.1600231481481480.342146-0.46770.6411520.320576
M5-0.1824826388888890.341859-0.53380.5948290.297415
M6-0.1938310185185190.341638-0.56740.5719160.285958
M7-0.02381365740740780.351981-0.06770.9462130.473106
M8-0.01155092592592640.351692-0.03280.9738730.486937
M9-0.02428819444444460.351467-0.06910.9450630.472531
M100.01297453703703710.3513060.03690.9706230.485311
M11-0.01226273148148160.351209-0.03490.9722260.486113
t0.0002372685185184720.0047540.04990.9603070.480154


Multiple Linear Regression - Regression Statistics
Multiple R0.45096899656541
R-squared0.203373035863213
Adjusted R-squared0.0856895070702781
F-TEST (value)1.72813509204886
F-TEST (DF numerator)13
F-TEST (DF denominator)88
p-value0.0687166433524351
Multiple Linear Regression - Residual Statistics
Residual Standard Deviation0.702354370996517
Sum Squared Residuals43.4105462962963

\begin{tabular}{lllllllll}
\hline
Multiple Linear Regression - Regression Statistics \tabularnewline
Multiple R & 0.45096899656541 \tabularnewline
R-squared & 0.203373035863213 \tabularnewline
Adjusted R-squared & 0.0856895070702781 \tabularnewline
F-TEST (value) & 1.72813509204886 \tabularnewline
F-TEST (DF numerator) & 13 \tabularnewline
F-TEST (DF denominator) & 88 \tabularnewline
p-value & 0.0687166433524351 \tabularnewline
Multiple Linear Regression - Residual Statistics \tabularnewline
Residual Standard Deviation & 0.702354370996517 \tabularnewline
Sum Squared Residuals & 43.4105462962963 \tabularnewline
\hline
\end{tabular}
%Source: https://freestatistics.org/blog/index.php?pk=25477&T=3

[TABLE]
[ROW][C]Multiple Linear Regression - Regression Statistics[/C][/ROW]
[ROW][C]Multiple R[/C][C]0.45096899656541[/C][/ROW]
[ROW][C]R-squared[/C][C]0.203373035863213[/C][/ROW]
[ROW][C]Adjusted R-squared[/C][C]0.0856895070702781[/C][/ROW]
[ROW][C]F-TEST (value)[/C][C]1.72813509204886[/C][/ROW]
[ROW][C]F-TEST (DF numerator)[/C][C]13[/C][/ROW]
[ROW][C]F-TEST (DF denominator)[/C][C]88[/C][/ROW]
[ROW][C]p-value[/C][C]0.0687166433524351[/C][/ROW]
[ROW][C]Multiple Linear Regression - Residual Statistics[/C][/ROW]
[ROW][C]Residual Standard Deviation[/C][C]0.702354370996517[/C][/ROW]
[ROW][C]Sum Squared Residuals[/C][C]43.4105462962963[/C][/ROW]
[/TABLE]
Source: https://freestatistics.org/blog/index.php?pk=25477&T=3

Globally Unique Identifier (entire table): ba.freestatistics.org/blog/index.php?pk=25477&T=3

As an alternative you can also use a QR Code:  

The GUIDs for individual cells are displayed in the table below:

Multiple Linear Regression - Regression Statistics
Multiple R0.45096899656541
R-squared0.203373035863213
Adjusted R-squared0.0856895070702781
F-TEST (value)1.72813509204886
F-TEST (DF numerator)13
F-TEST (DF denominator)88
p-value0.0687166433524351
Multiple Linear Regression - Residual Statistics
Residual Standard Deviation0.702354370996517
Sum Squared Residuals43.4105462962963


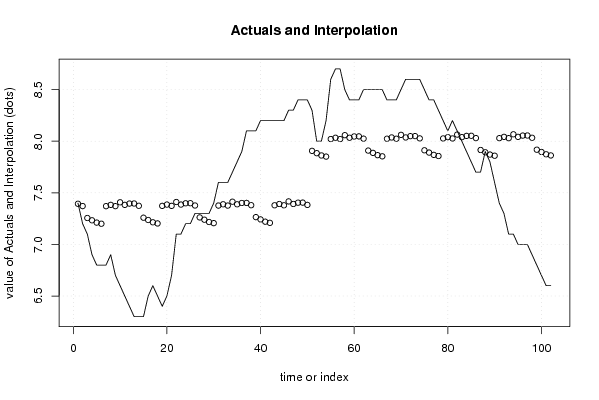
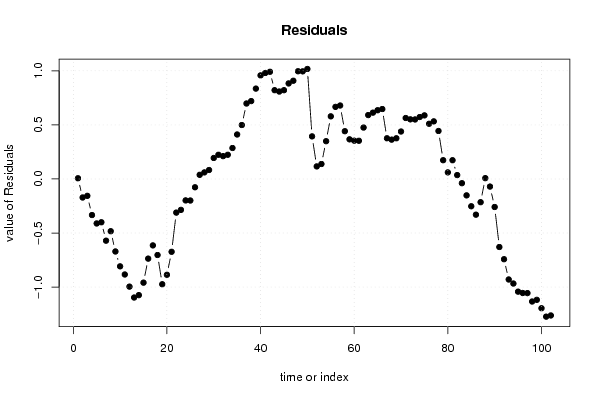
Multiple Linear Regression - Actuals, Interpolation, and Residuals
Time or IndexActualsInterpolationForecastResidualsPrediction Error
17.47.393518518518490.00648148148151031
27.27.3712962962963-0.171296296296294
37.17.25585648148148-0.155856481481483
46.97.23363425925926-0.333634259259261
56.87.21141203703704-0.411412037037037
66.87.20030092592593-0.400300925925928
76.87.37055555555556-0.570555555555557
86.97.38305555555556-0.483055555555556
96.77.37055555555556-0.670555555555556
106.67.40805555555556-0.808055555555557
116.57.38305555555556-0.883055555555558
126.47.39555555555556-0.995555555555557
136.37.39636574074074-1.09636574074075
146.37.37414351851852-1.07414351851852
156.37.2587037037037-0.958703703703705
166.57.23648148148148-0.736481481481482
176.67.21425925925926-0.61425925925926
186.57.20314814814815-0.703148148148149
196.47.37340277777778-0.973402777777778
206.57.38590277777778-0.885902777777778
216.77.37340277777778-0.673402777777778
227.17.41090277777778-0.310902777777779
237.17.38590277777778-0.285902777777778
247.27.39840277777778-0.198402777777778
257.27.39921296296297-0.199212962962967
267.37.37699074074074-0.0769907407407419
277.37.261550925925930.0384490740740738
287.37.23932870370370.0606712962962960
297.37.217106481481480.0828935185185185
307.47.205995370370370.19400462962963
317.67.376250.223750000000000
327.67.388750.21125
337.67.376250.22375
347.77.413750.28625
357.87.388750.41125
367.97.401250.49875
378.17.40206018518520.697939814814811
388.17.379837962962960.720162037037036
398.17.264398148148150.835601851851852
408.27.242175925925930.957824074074074
418.27.21995370370370.980046296296296
428.27.208842592592590.991157407407407
438.27.379097222222220.820902777777778
448.27.391597222222220.808402777777778
458.27.379097222222220.820902777777778
468.37.416597222222220.88340277777778
478.37.391597222222220.90840277777778
488.47.404097222222220.995902777777779
498.47.404907407407410.99509259259259
508.47.382685185185181.01731481481482
518.37.90620370370370.393796296296296
5287.883981481481480.116018518518518
5387.861759259259260.138240740740740
548.27.850648148148150.349351851851850
558.68.020902777777780.579097222222221
568.78.033402777777780.666597222222221
578.78.020902777777780.679097222222221
588.58.058402777777780.441597222222222
598.48.033402777777780.366597222222222
608.48.045902777777780.354097222222222
618.48.046712962962970.353287037037033
628.58.024490740740740.475509259259258
638.57.909050925925930.590949074074074
648.57.88682870370370.613171296296296
658.57.864606481481480.635393518518519
668.57.853495370370370.64650462962963
678.48.023750.376250000000000
688.48.036250.363750000000001
698.48.023750.376250000000001
708.58.061250.43875
718.68.036250.56375
728.68.048750.551249999999999
738.68.04956018518520.550439814814811
748.68.027337962962960.572662037037036
758.57.911898148148150.588101851851852
768.47.889675925925930.510324074074075
778.47.86745370370370.532546296296297
788.37.85634259259260.443657407407409
798.28.026597222222220.173402777777778
808.18.039097222222220.0609027777777783
818.28.026597222222220.173402777777778
828.18.064097222222220.0359027777777779
8388.03909722222222-0.0390972222222215
847.98.05159722222222-0.151597222222221
857.88.0524074074074-0.252407407407410
867.78.03018518518519-0.330185185185185
877.77.91474537037037-0.214745370370369
887.97.892523148148150.00747685185185319
897.87.87030092592592-0.0703009259259249
907.67.85918981481481-0.259189814814814
917.48.02944444444444-0.629444444444443
927.38.04194444444444-0.741944444444443
937.18.02944444444444-0.929444444444443
947.18.06694444444444-0.966944444444444
9578.04194444444444-1.04194444444444
9678.05444444444444-1.05444444444444
9778.05525462962963-1.05525462962963
986.98.0330324074074-1.13303240740741
996.87.9175925925926-1.11759259259259
1006.77.89537037037037-1.19537037037037
1016.67.87314814814815-1.27314814814815
1026.67.86203703703704-1.26203703703704

\begin{tabular}{lllllllll}
\hline
Multiple Linear Regression - Actuals, Interpolation, and Residuals \tabularnewline
Time or Index & Actuals & InterpolationForecast & ResidualsPrediction Error \tabularnewline
1 & 7.4 & 7.39351851851849 & 0.00648148148151031 \tabularnewline
2 & 7.2 & 7.3712962962963 & -0.171296296296294 \tabularnewline
3 & 7.1 & 7.25585648148148 & -0.155856481481483 \tabularnewline
4 & 6.9 & 7.23363425925926 & -0.333634259259261 \tabularnewline
5 & 6.8 & 7.21141203703704 & -0.411412037037037 \tabularnewline
6 & 6.8 & 7.20030092592593 & -0.400300925925928 \tabularnewline
7 & 6.8 & 7.37055555555556 & -0.570555555555557 \tabularnewline
8 & 6.9 & 7.38305555555556 & -0.483055555555556 \tabularnewline
9 & 6.7 & 7.37055555555556 & -0.670555555555556 \tabularnewline
10 & 6.6 & 7.40805555555556 & -0.808055555555557 \tabularnewline
11 & 6.5 & 7.38305555555556 & -0.883055555555558 \tabularnewline
12 & 6.4 & 7.39555555555556 & -0.995555555555557 \tabularnewline
13 & 6.3 & 7.39636574074074 & -1.09636574074075 \tabularnewline
14 & 6.3 & 7.37414351851852 & -1.07414351851852 \tabularnewline
15 & 6.3 & 7.2587037037037 & -0.958703703703705 \tabularnewline
16 & 6.5 & 7.23648148148148 & -0.736481481481482 \tabularnewline
17 & 6.6 & 7.21425925925926 & -0.61425925925926 \tabularnewline
18 & 6.5 & 7.20314814814815 & -0.703148148148149 \tabularnewline
19 & 6.4 & 7.37340277777778 & -0.973402777777778 \tabularnewline
20 & 6.5 & 7.38590277777778 & -0.885902777777778 \tabularnewline
21 & 6.7 & 7.37340277777778 & -0.673402777777778 \tabularnewline
22 & 7.1 & 7.41090277777778 & -0.310902777777779 \tabularnewline
23 & 7.1 & 7.38590277777778 & -0.285902777777778 \tabularnewline
24 & 7.2 & 7.39840277777778 & -0.198402777777778 \tabularnewline
25 & 7.2 & 7.39921296296297 & -0.199212962962967 \tabularnewline
26 & 7.3 & 7.37699074074074 & -0.0769907407407419 \tabularnewline
27 & 7.3 & 7.26155092592593 & 0.0384490740740738 \tabularnewline
28 & 7.3 & 7.2393287037037 & 0.0606712962962960 \tabularnewline
29 & 7.3 & 7.21710648148148 & 0.0828935185185185 \tabularnewline
30 & 7.4 & 7.20599537037037 & 0.19400462962963 \tabularnewline
31 & 7.6 & 7.37625 & 0.223750000000000 \tabularnewline
32 & 7.6 & 7.38875 & 0.21125 \tabularnewline
33 & 7.6 & 7.37625 & 0.22375 \tabularnewline
34 & 7.7 & 7.41375 & 0.28625 \tabularnewline
35 & 7.8 & 7.38875 & 0.41125 \tabularnewline
36 & 7.9 & 7.40125 & 0.49875 \tabularnewline
37 & 8.1 & 7.4020601851852 & 0.697939814814811 \tabularnewline
38 & 8.1 & 7.37983796296296 & 0.720162037037036 \tabularnewline
39 & 8.1 & 7.26439814814815 & 0.835601851851852 \tabularnewline
40 & 8.2 & 7.24217592592593 & 0.957824074074074 \tabularnewline
41 & 8.2 & 7.2199537037037 & 0.980046296296296 \tabularnewline
42 & 8.2 & 7.20884259259259 & 0.991157407407407 \tabularnewline
43 & 8.2 & 7.37909722222222 & 0.820902777777778 \tabularnewline
44 & 8.2 & 7.39159722222222 & 0.808402777777778 \tabularnewline
45 & 8.2 & 7.37909722222222 & 0.820902777777778 \tabularnewline
46 & 8.3 & 7.41659722222222 & 0.88340277777778 \tabularnewline
47 & 8.3 & 7.39159722222222 & 0.90840277777778 \tabularnewline
48 & 8.4 & 7.40409722222222 & 0.995902777777779 \tabularnewline
49 & 8.4 & 7.40490740740741 & 0.99509259259259 \tabularnewline
50 & 8.4 & 7.38268518518518 & 1.01731481481482 \tabularnewline
51 & 8.3 & 7.9062037037037 & 0.393796296296296 \tabularnewline
52 & 8 & 7.88398148148148 & 0.116018518518518 \tabularnewline
53 & 8 & 7.86175925925926 & 0.138240740740740 \tabularnewline
54 & 8.2 & 7.85064814814815 & 0.349351851851850 \tabularnewline
55 & 8.6 & 8.02090277777778 & 0.579097222222221 \tabularnewline
56 & 8.7 & 8.03340277777778 & 0.666597222222221 \tabularnewline
57 & 8.7 & 8.02090277777778 & 0.679097222222221 \tabularnewline
58 & 8.5 & 8.05840277777778 & 0.441597222222222 \tabularnewline
59 & 8.4 & 8.03340277777778 & 0.366597222222222 \tabularnewline
60 & 8.4 & 8.04590277777778 & 0.354097222222222 \tabularnewline
61 & 8.4 & 8.04671296296297 & 0.353287037037033 \tabularnewline
62 & 8.5 & 8.02449074074074 & 0.475509259259258 \tabularnewline
63 & 8.5 & 7.90905092592593 & 0.590949074074074 \tabularnewline
64 & 8.5 & 7.8868287037037 & 0.613171296296296 \tabularnewline
65 & 8.5 & 7.86460648148148 & 0.635393518518519 \tabularnewline
66 & 8.5 & 7.85349537037037 & 0.64650462962963 \tabularnewline
67 & 8.4 & 8.02375 & 0.376250000000000 \tabularnewline
68 & 8.4 & 8.03625 & 0.363750000000001 \tabularnewline
69 & 8.4 & 8.02375 & 0.376250000000001 \tabularnewline
70 & 8.5 & 8.06125 & 0.43875 \tabularnewline
71 & 8.6 & 8.03625 & 0.56375 \tabularnewline
72 & 8.6 & 8.04875 & 0.551249999999999 \tabularnewline
73 & 8.6 & 8.0495601851852 & 0.550439814814811 \tabularnewline
74 & 8.6 & 8.02733796296296 & 0.572662037037036 \tabularnewline
75 & 8.5 & 7.91189814814815 & 0.588101851851852 \tabularnewline
76 & 8.4 & 7.88967592592593 & 0.510324074074075 \tabularnewline
77 & 8.4 & 7.8674537037037 & 0.532546296296297 \tabularnewline
78 & 8.3 & 7.8563425925926 & 0.443657407407409 \tabularnewline
79 & 8.2 & 8.02659722222222 & 0.173402777777778 \tabularnewline
80 & 8.1 & 8.03909722222222 & 0.0609027777777783 \tabularnewline
81 & 8.2 & 8.02659722222222 & 0.173402777777778 \tabularnewline
82 & 8.1 & 8.06409722222222 & 0.0359027777777779 \tabularnewline
83 & 8 & 8.03909722222222 & -0.0390972222222215 \tabularnewline
84 & 7.9 & 8.05159722222222 & -0.151597222222221 \tabularnewline
85 & 7.8 & 8.0524074074074 & -0.252407407407410 \tabularnewline
86 & 7.7 & 8.03018518518519 & -0.330185185185185 \tabularnewline
87 & 7.7 & 7.91474537037037 & -0.214745370370369 \tabularnewline
88 & 7.9 & 7.89252314814815 & 0.00747685185185319 \tabularnewline
89 & 7.8 & 7.87030092592592 & -0.0703009259259249 \tabularnewline
90 & 7.6 & 7.85918981481481 & -0.259189814814814 \tabularnewline
91 & 7.4 & 8.02944444444444 & -0.629444444444443 \tabularnewline
92 & 7.3 & 8.04194444444444 & -0.741944444444443 \tabularnewline
93 & 7.1 & 8.02944444444444 & -0.929444444444443 \tabularnewline
94 & 7.1 & 8.06694444444444 & -0.966944444444444 \tabularnewline
95 & 7 & 8.04194444444444 & -1.04194444444444 \tabularnewline
96 & 7 & 8.05444444444444 & -1.05444444444444 \tabularnewline
97 & 7 & 8.05525462962963 & -1.05525462962963 \tabularnewline
98 & 6.9 & 8.0330324074074 & -1.13303240740741 \tabularnewline
99 & 6.8 & 7.9175925925926 & -1.11759259259259 \tabularnewline
100 & 6.7 & 7.89537037037037 & -1.19537037037037 \tabularnewline
101 & 6.6 & 7.87314814814815 & -1.27314814814815 \tabularnewline
102 & 6.6 & 7.86203703703704 & -1.26203703703704 \tabularnewline
\hline
\end{tabular}
%Source: https://freestatistics.org/blog/index.php?pk=25477&T=4

[TABLE]
[ROW][C]Multiple Linear Regression - Actuals, Interpolation, and Residuals[/C][/ROW]
[ROW][C]Time or Index[/C][C]Actuals[/C][C]InterpolationForecast[/C][C]ResidualsPrediction Error[/C][/ROW]
[ROW][C]1[/C][C]7.4[/C][C]7.39351851851849[/C][C]0.00648148148151031[/C][/ROW]
[ROW][C]2[/C][C]7.2[/C][C]7.3712962962963[/C][C]-0.171296296296294[/C][/ROW]
[ROW][C]3[/C][C]7.1[/C][C]7.25585648148148[/C][C]-0.155856481481483[/C][/ROW]
[ROW][C]4[/C][C]6.9[/C][C]7.23363425925926[/C][C]-0.333634259259261[/C][/ROW]
[ROW][C]5[/C][C]6.8[/C][C]7.21141203703704[/C][C]-0.411412037037037[/C][/ROW]
[ROW][C]6[/C][C]6.8[/C][C]7.20030092592593[/C][C]-0.400300925925928[/C][/ROW]
[ROW][C]7[/C][C]6.8[/C][C]7.37055555555556[/C][C]-0.570555555555557[/C][/ROW]
[ROW][C]8[/C][C]6.9[/C][C]7.38305555555556[/C][C]-0.483055555555556[/C][/ROW]
[ROW][C]9[/C][C]6.7[/C][C]7.37055555555556[/C][C]-0.670555555555556[/C][/ROW]
[ROW][C]10[/C][C]6.6[/C][C]7.40805555555556[/C][C]-0.808055555555557[/C][/ROW]
[ROW][C]11[/C][C]6.5[/C][C]7.38305555555556[/C][C]-0.883055555555558[/C][/ROW]
[ROW][C]12[/C][C]6.4[/C][C]7.39555555555556[/C][C]-0.995555555555557[/C][/ROW]
[ROW][C]13[/C][C]6.3[/C][C]7.39636574074074[/C][C]-1.09636574074075[/C][/ROW]
[ROW][C]14[/C][C]6.3[/C][C]7.37414351851852[/C][C]-1.07414351851852[/C][/ROW]
[ROW][C]15[/C][C]6.3[/C][C]7.2587037037037[/C][C]-0.958703703703705[/C][/ROW]
[ROW][C]16[/C][C]6.5[/C][C]7.23648148148148[/C][C]-0.736481481481482[/C][/ROW]
[ROW][C]17[/C][C]6.6[/C][C]7.21425925925926[/C][C]-0.61425925925926[/C][/ROW]
[ROW][C]18[/C][C]6.5[/C][C]7.20314814814815[/C][C]-0.703148148148149[/C][/ROW]
[ROW][C]19[/C][C]6.4[/C][C]7.37340277777778[/C][C]-0.973402777777778[/C][/ROW]
[ROW][C]20[/C][C]6.5[/C][C]7.38590277777778[/C][C]-0.885902777777778[/C][/ROW]
[ROW][C]21[/C][C]6.7[/C][C]7.37340277777778[/C][C]-0.673402777777778[/C][/ROW]
[ROW][C]22[/C][C]7.1[/C][C]7.41090277777778[/C][C]-0.310902777777779[/C][/ROW]
[ROW][C]23[/C][C]7.1[/C][C]7.38590277777778[/C][C]-0.285902777777778[/C][/ROW]
[ROW][C]24[/C][C]7.2[/C][C]7.39840277777778[/C][C]-0.198402777777778[/C][/ROW]
[ROW][C]25[/C][C]7.2[/C][C]7.39921296296297[/C][C]-0.199212962962967[/C][/ROW]
[ROW][C]26[/C][C]7.3[/C][C]7.37699074074074[/C][C]-0.0769907407407419[/C][/ROW]
[ROW][C]27[/C][C]7.3[/C][C]7.26155092592593[/C][C]0.0384490740740738[/C][/ROW]
[ROW][C]28[/C][C]7.3[/C][C]7.2393287037037[/C][C]0.0606712962962960[/C][/ROW]
[ROW][C]29[/C][C]7.3[/C][C]7.21710648148148[/C][C]0.0828935185185185[/C][/ROW]
[ROW][C]30[/C][C]7.4[/C][C]7.20599537037037[/C][C]0.19400462962963[/C][/ROW]
[ROW][C]31[/C][C]7.6[/C][C]7.37625[/C][C]0.223750000000000[/C][/ROW]
[ROW][C]32[/C][C]7.6[/C][C]7.38875[/C][C]0.21125[/C][/ROW]
[ROW][C]33[/C][C]7.6[/C][C]7.37625[/C][C]0.22375[/C][/ROW]
[ROW][C]34[/C][C]7.7[/C][C]7.41375[/C][C]0.28625[/C][/ROW]
[ROW][C]35[/C][C]7.8[/C][C]7.38875[/C][C]0.41125[/C][/ROW]
[ROW][C]36[/C][C]7.9[/C][C]7.40125[/C][C]0.49875[/C][/ROW]
[ROW][C]37[/C][C]8.1[/C][C]7.4020601851852[/C][C]0.697939814814811[/C][/ROW]
[ROW][C]38[/C][C]8.1[/C][C]7.37983796296296[/C][C]0.720162037037036[/C][/ROW]
[ROW][C]39[/C][C]8.1[/C][C]7.26439814814815[/C][C]0.835601851851852[/C][/ROW]
[ROW][C]40[/C][C]8.2[/C][C]7.24217592592593[/C][C]0.957824074074074[/C][/ROW]
[ROW][C]41[/C][C]8.2[/C][C]7.2199537037037[/C][C]0.980046296296296[/C][/ROW]
[ROW][C]42[/C][C]8.2[/C][C]7.20884259259259[/C][C]0.991157407407407[/C][/ROW]
[ROW][C]43[/C][C]8.2[/C][C]7.37909722222222[/C][C]0.820902777777778[/C][/ROW]
[ROW][C]44[/C][C]8.2[/C][C]7.39159722222222[/C][C]0.808402777777778[/C][/ROW]
[ROW][C]45[/C][C]8.2[/C][C]7.37909722222222[/C][C]0.820902777777778[/C][/ROW]
[ROW][C]46[/C][C]8.3[/C][C]7.41659722222222[/C][C]0.88340277777778[/C][/ROW]
[ROW][C]47[/C][C]8.3[/C][C]7.39159722222222[/C][C]0.90840277777778[/C][/ROW]
[ROW][C]48[/C][C]8.4[/C][C]7.40409722222222[/C][C]0.995902777777779[/C][/ROW]
[ROW][C]49[/C][C]8.4[/C][C]7.40490740740741[/C][C]0.99509259259259[/C][/ROW]
[ROW][C]50[/C][C]8.4[/C][C]7.38268518518518[/C][C]1.01731481481482[/C][/ROW]
[ROW][C]51[/C][C]8.3[/C][C]7.9062037037037[/C][C]0.393796296296296[/C][/ROW]
[ROW][C]52[/C][C]8[/C][C]7.88398148148148[/C][C]0.116018518518518[/C][/ROW]
[ROW][C]53[/C][C]8[/C][C]7.86175925925926[/C][C]0.138240740740740[/C][/ROW]
[ROW][C]54[/C][C]8.2[/C][C]7.85064814814815[/C][C]0.349351851851850[/C][/ROW]
[ROW][C]55[/C][C]8.6[/C][C]8.02090277777778[/C][C]0.579097222222221[/C][/ROW]
[ROW][C]56[/C][C]8.7[/C][C]8.03340277777778[/C][C]0.666597222222221[/C][/ROW]
[ROW][C]57[/C][C]8.7[/C][C]8.02090277777778[/C][C]0.679097222222221[/C][/ROW]
[ROW][C]58[/C][C]8.5[/C][C]8.05840277777778[/C][C]0.441597222222222[/C][/ROW]
[ROW][C]59[/C][C]8.4[/C][C]8.03340277777778[/C][C]0.366597222222222[/C][/ROW]
[ROW][C]60[/C][C]8.4[/C][C]8.04590277777778[/C][C]0.354097222222222[/C][/ROW]
[ROW][C]61[/C][C]8.4[/C][C]8.04671296296297[/C][C]0.353287037037033[/C][/ROW]
[ROW][C]62[/C][C]8.5[/C][C]8.02449074074074[/C][C]0.475509259259258[/C][/ROW]
[ROW][C]63[/C][C]8.5[/C][C]7.90905092592593[/C][C]0.590949074074074[/C][/ROW]
[ROW][C]64[/C][C]8.5[/C][C]7.8868287037037[/C][C]0.613171296296296[/C][/ROW]
[ROW][C]65[/C][C]8.5[/C][C]7.86460648148148[/C][C]0.635393518518519[/C][/ROW]
[ROW][C]66[/C][C]8.5[/C][C]7.85349537037037[/C][C]0.64650462962963[/C][/ROW]
[ROW][C]67[/C][C]8.4[/C][C]8.02375[/C][C]0.376250000000000[/C][/ROW]
[ROW][C]68[/C][C]8.4[/C][C]8.03625[/C][C]0.363750000000001[/C][/ROW]
[ROW][C]69[/C][C]8.4[/C][C]8.02375[/C][C]0.376250000000001[/C][/ROW]
[ROW][C]70[/C][C]8.5[/C][C]8.06125[/C][C]0.43875[/C][/ROW]
[ROW][C]71[/C][C]8.6[/C][C]8.03625[/C][C]0.56375[/C][/ROW]
[ROW][C]72[/C][C]8.6[/C][C]8.04875[/C][C]0.551249999999999[/C][/ROW]
[ROW][C]73[/C][C]8.6[/C][C]8.0495601851852[/C][C]0.550439814814811[/C][/ROW]
[ROW][C]74[/C][C]8.6[/C][C]8.02733796296296[/C][C]0.572662037037036[/C][/ROW]
[ROW][C]75[/C][C]8.5[/C][C]7.91189814814815[/C][C]0.588101851851852[/C][/ROW]
[ROW][C]76[/C][C]8.4[/C][C]7.88967592592593[/C][C]0.510324074074075[/C][/ROW]
[ROW][C]77[/C][C]8.4[/C][C]7.8674537037037[/C][C]0.532546296296297[/C][/ROW]
[ROW][C]78[/C][C]8.3[/C][C]7.8563425925926[/C][C]0.443657407407409[/C][/ROW]
[ROW][C]79[/C][C]8.2[/C][C]8.02659722222222[/C][C]0.173402777777778[/C][/ROW]
[ROW][C]80[/C][C]8.1[/C][C]8.03909722222222[/C][C]0.0609027777777783[/C][/ROW]
[ROW][C]81[/C][C]8.2[/C][C]8.02659722222222[/C][C]0.173402777777778[/C][/ROW]
[ROW][C]82[/C][C]8.1[/C][C]8.06409722222222[/C][C]0.0359027777777779[/C][/ROW]
[ROW][C]83[/C][C]8[/C][C]8.03909722222222[/C][C]-0.0390972222222215[/C][/ROW]
[ROW][C]84[/C][C]7.9[/C][C]8.05159722222222[/C][C]-0.151597222222221[/C][/ROW]
[ROW][C]85[/C][C]7.8[/C][C]8.0524074074074[/C][C]-0.252407407407410[/C][/ROW]
[ROW][C]86[/C][C]7.7[/C][C]8.03018518518519[/C][C]-0.330185185185185[/C][/ROW]
[ROW][C]87[/C][C]7.7[/C][C]7.91474537037037[/C][C]-0.214745370370369[/C][/ROW]
[ROW][C]88[/C][C]7.9[/C][C]7.89252314814815[/C][C]0.00747685185185319[/C][/ROW]
[ROW][C]89[/C][C]7.8[/C][C]7.87030092592592[/C][C]-0.0703009259259249[/C][/ROW]
[ROW][C]90[/C][C]7.6[/C][C]7.85918981481481[/C][C]-0.259189814814814[/C][/ROW]
[ROW][C]91[/C][C]7.4[/C][C]8.02944444444444[/C][C]-0.629444444444443[/C][/ROW]
[ROW][C]92[/C][C]7.3[/C][C]8.04194444444444[/C][C]-0.741944444444443[/C][/ROW]
[ROW][C]93[/C][C]7.1[/C][C]8.02944444444444[/C][C]-0.929444444444443[/C][/ROW]
[ROW][C]94[/C][C]7.1[/C][C]8.06694444444444[/C][C]-0.966944444444444[/C][/ROW]
[ROW][C]95[/C][C]7[/C][C]8.04194444444444[/C][C]-1.04194444444444[/C][/ROW]
[ROW][C]96[/C][C]7[/C][C]8.05444444444444[/C][C]-1.05444444444444[/C][/ROW]
[ROW][C]97[/C][C]7[/C][C]8.05525462962963[/C][C]-1.05525462962963[/C][/ROW]
[ROW][C]98[/C][C]6.9[/C][C]8.0330324074074[/C][C]-1.13303240740741[/C][/ROW]
[ROW][C]99[/C][C]6.8[/C][C]7.9175925925926[/C][C]-1.11759259259259[/C][/ROW]
[ROW][C]100[/C][C]6.7[/C][C]7.89537037037037[/C][C]-1.19537037037037[/C][/ROW]
[ROW][C]101[/C][C]6.6[/C][C]7.87314814814815[/C][C]-1.27314814814815[/C][/ROW]
[ROW][C]102[/C][C]6.6[/C][C]7.86203703703704[/C][C]-1.26203703703704[/C][/ROW]
[/TABLE]
Source: https://freestatistics.org/blog/index.php?pk=25477&T=4

Globally Unique Identifier (entire table): ba.freestatistics.org/blog/index.php?pk=25477&T=4

As an alternative you can also use a QR Code:  

The GUIDs for individual cells are displayed in the table below:

Multiple Linear Regression - Actuals, Interpolation, and Residuals
Time or IndexActualsInterpolationForecastResidualsPrediction Error
17.47.393518518518490.00648148148151031
27.27.3712962962963-0.171296296296294
37.17.25585648148148-0.155856481481483
46.97.23363425925926-0.333634259259261
56.87.21141203703704-0.411412037037037
66.87.20030092592593-0.400300925925928
76.87.37055555555556-0.570555555555557
86.97.38305555555556-0.483055555555556
96.77.37055555555556-0.670555555555556
106.67.40805555555556-0.808055555555557
116.57.38305555555556-0.883055555555558
126.47.39555555555556-0.995555555555557
136.37.39636574074074-1.09636574074075
146.37.37414351851852-1.07414351851852
156.37.2587037037037-0.958703703703705
166.57.23648148148148-0.736481481481482
176.67.21425925925926-0.61425925925926
186.57.20314814814815-0.703148148148149
196.47.37340277777778-0.973402777777778
206.57.38590277777778-0.885902777777778
216.77.37340277777778-0.673402777777778
227.17.41090277777778-0.310902777777779
237.17.38590277777778-0.285902777777778
247.27.39840277777778-0.198402777777778
257.27.39921296296297-0.199212962962967
267.37.37699074074074-0.0769907407407419
277.37.261550925925930.0384490740740738
287.37.23932870370370.0606712962962960
297.37.217106481481480.0828935185185185
307.47.205995370370370.19400462962963
317.67.376250.223750000000000
327.67.388750.21125
337.67.376250.22375
347.77.413750.28625
357.87.388750.41125
367.97.401250.49875
378.17.40206018518520.697939814814811
388.17.379837962962960.720162037037036
398.17.264398148148150.835601851851852
408.27.242175925925930.957824074074074
418.27.21995370370370.980046296296296
428.27.208842592592590.991157407407407
438.27.379097222222220.820902777777778
448.27.391597222222220.808402777777778
458.27.379097222222220.820902777777778
468.37.416597222222220.88340277777778
478.37.391597222222220.90840277777778
488.47.404097222222220.995902777777779
498.47.404907407407410.99509259259259
508.47.382685185185181.01731481481482
518.37.90620370370370.393796296296296
5287.883981481481480.116018518518518
5387.861759259259260.138240740740740
548.27.850648148148150.349351851851850
558.68.020902777777780.579097222222221
568.78.033402777777780.666597222222221
578.78.020902777777780.679097222222221
588.58.058402777777780.441597222222222
598.48.033402777777780.366597222222222
608.48.045902777777780.354097222222222
618.48.046712962962970.353287037037033
628.58.024490740740740.475509259259258
638.57.909050925925930.590949074074074
648.57.88682870370370.613171296296296
658.57.864606481481480.635393518518519
668.57.853495370370370.64650462962963
678.48.023750.376250000000000
688.48.036250.363750000000001
698.48.023750.376250000000001
708.58.061250.43875
718.68.036250.56375
728.68.048750.551249999999999
738.68.04956018518520.550439814814811
748.68.027337962962960.572662037037036
758.57.911898148148150.588101851851852
768.47.889675925925930.510324074074075
778.47.86745370370370.532546296296297
788.37.85634259259260.443657407407409
798.28.026597222222220.173402777777778
808.18.039097222222220.0609027777777783
818.28.026597222222220.173402777777778
828.18.064097222222220.0359027777777779
8388.03909722222222-0.0390972222222215
847.98.05159722222222-0.151597222222221
857.88.0524074074074-0.252407407407410
867.78.03018518518519-0.330185185185185
877.77.91474537037037-0.214745370370369
887.97.892523148148150.00747685185185319
897.87.87030092592592-0.0703009259259249
907.67.85918981481481-0.259189814814814
917.48.02944444444444-0.629444444444443
927.38.04194444444444-0.741944444444443
937.18.02944444444444-0.929444444444443
947.18.06694444444444-0.966944444444444
9578.04194444444444-1.04194444444444
9678.05444444444444-1.05444444444444
9778.05525462962963-1.05525462962963
986.98.0330324074074-1.13303240740741
996.87.9175925925926-1.11759259259259
1006.77.89537037037037-1.19537037037037
1016.67.87314814814815-1.27314814814815
1026.67.86203703703704-1.26203703703704


Parameters (Session):
par1 = 1 ; par2 = Include Monthly Dummies ; par3 = Linear Trend ;
Parameters (R input):
par1 = 1 ; par2 = Include Monthly Dummies ; par3 = Linear Trend ;
R code (references can be found in the software module):
library(lattice)
par1 <- as.numeric(par1)
x <- t(y)
k <- length(x[1,])
n <- length(x[,1])
x1 <- cbind(x[,par1], x[,1:k!=par1])
mycolnames <- c(colnames(x)[par1], colnames(x)[1:k!=par1])
colnames(x1) <- mycolnames #colnames(x)[par1]
x <- x1
if (par3 == 'First Differences'){
x2 <- array(0, dim=c(n-1,k), dimnames=list(1:(n-1), paste('(1-B)',colnames(x),sep='')))
for (i in 1:n-1) {
for (j in 1:k) {
x2[i,j] <- x[i+1,j] - x[i,j]
}
}
x <- x2
}
if (par2 == 'Include Monthly Dummies'){
x2 <- array(0, dim=c(n,11), dimnames=list(1:n, paste('M', seq(1:11), sep ='')))
for (i in 1:11){
x2[seq(i,n,12),i] <- 1
}
x <- cbind(x, x2)
}
if (par2 == 'Include Quarterly Dummies'){
x2 <- array(0, dim=c(n,3), dimnames=list(1:n, paste('Q', seq(1:3), sep ='')))
for (i in 1:3){
x2[seq(i,n,4),i] <- 1
}
x <- cbind(x, x2)
}
k <- length(x[1,])
if (par3 == 'Linear Trend'){
x <- cbind(x, c(1:n))
colnames(x)[k+1] <- 't'
}
x
k <- length(x[1,])
df <- as.data.frame(x)
(mylm <- lm(df))
(mysum <- summary(mylm))
bitmap(file='test0.png')
plot(x[,1], type='l', main='Actuals and Interpolation', ylab='value of Actuals and Interpolation (dots)', xlab='time or index')
points(x[,1]-mysum$resid)
grid()
dev.off()
bitmap(file='test1.png')
plot(mysum$resid, type='b', pch=19, main='Residuals', ylab='value of Residuals', xlab='time or index')
grid()
dev.off()
bitmap(file='test2.png')
hist(mysum$resid, main='Residual Histogram', xlab='values of Residuals')
grid()
dev.off()
bitmap(file='test3.png')
densityplot(~mysum$resid,col='black',main='Residual Density Plot', xlab='values of Residuals')
dev.off()
bitmap(file='test4.png')
qqnorm(mysum$resid, main='Residual Normal Q-Q Plot')
grid()
dev.off()
(myerror <- as.ts(mysum$resid))
bitmap(file='test5.png')
dum <- cbind(lag(myerror,k=1),myerror)
dum
dum1 <- dum[2:length(myerror),]
dum1
z <- as.data.frame(dum1)
z
plot(z,main=paste('Residual Lag plot, lowess, and regression line'), ylab='values of Residuals', xlab='lagged values of Residuals')
lines(lowess(z))
abline(lm(z))
grid()
dev.off()
bitmap(file='test6.png')
acf(mysum$resid, lag.max=length(mysum$resid)/2, main='Residual Autocorrelation Function')
grid()
dev.off()
bitmap(file='test7.png')
pacf(mysum$resid, lag.max=length(mysum$resid)/2, main='Residual Partial Autocorrelation Function')
grid()
dev.off()
bitmap(file='test8.png')
opar <- par(mfrow = c(2,2), oma = c(0, 0, 1.1, 0))
plot(mylm, las = 1, sub='Residual Diagnostics')
par(opar)
dev.off()
load(file='createtable')
a<-table.start()
a<-table.row.start(a)
a<-table.element(a, 'Multiple Linear Regression - Estimated Regression Equation', 1, TRUE)
a<-table.row.end(a)
myeq <- colnames(x)[1]
myeq <- paste(myeq, '[t] = ', sep='')
for (i in 1:k){
if (mysum$coefficients[i,1] > 0) myeq <- paste(myeq, '+', '')
myeq <- paste(myeq, mysum$coefficients[i,1], sep=' ')
if (rownames(mysum$coefficients)[i] != '(Intercept)') {
myeq <- paste(myeq, rownames(mysum$coefficients)[i], sep='')
if (rownames(mysum$coefficients)[i] != 't') myeq <- paste(myeq, '[t]', sep='')
}
}
myeq <- paste(myeq, ' + e[t]')
a<-table.row.start(a)
a<-table.element(a, myeq)
a<-table.row.end(a)
a<-table.end(a)
table.save(a,file='mytable1.tab')
a<-table.start()
a<-table.row.start(a)
a<-table.element(a,hyperlink('ols1.htm','Multiple Linear Regression - Ordinary Least Squares',''), 6, TRUE)
a<-table.row.end(a)
a<-table.row.start(a)
a<-table.element(a,'Variable',header=TRUE)
a<-table.element(a,'Parameter',header=TRUE)
a<-table.element(a,'S.D.',header=TRUE)
a<-table.element(a,'T-STAT
H0: parameter = 0',header=TRUE)
a<-table.element(a,'2-tail p-value',header=TRUE)
a<-table.element(a,'1-tail p-value',header=TRUE)
a<-table.row.end(a)
for (i in 1:k){
a<-table.row.start(a)
a<-table.element(a,rownames(mysum$coefficients)[i],header=TRUE)
a<-table.element(a,mysum$coefficients[i,1])
a<-table.element(a, round(mysum$coefficients[i,2],6))
a<-table.element(a, round(mysum$coefficients[i,3],4))
a<-table.element(a, round(mysum$coefficients[i,4],6))
a<-table.element(a, round(mysum$coefficients[i,4]/2,6))
a<-table.row.end(a)
}
a<-table.end(a)
table.save(a,file='mytable2.tab')
a<-table.start()
a<-table.row.start(a)
a<-table.element(a, 'Multiple Linear Regression - Regression Statistics', 2, TRUE)
a<-table.row.end(a)
a<-table.row.start(a)
a<-table.element(a, 'Multiple R',1,TRUE)
a<-table.element(a, sqrt(mysum$r.squared))
a<-table.row.end(a)
a<-table.row.start(a)
a<-table.element(a, 'R-squared',1,TRUE)
a<-table.element(a, mysum$r.squared)
a<-table.row.end(a)
a<-table.row.start(a)
a<-table.element(a, 'Adjusted R-squared',1,TRUE)
a<-table.element(a, mysum$adj.r.squared)
a<-table.row.end(a)
a<-table.row.start(a)
a<-table.element(a, 'F-TEST (value)',1,TRUE)
a<-table.element(a, mysum$fstatistic[1])
a<-table.row.end(a)
a<-table.row.start(a)
a<-table.element(a, 'F-TEST (DF numerator)',1,TRUE)
a<-table.element(a, mysum$fstatistic[2])
a<-table.row.end(a)
a<-table.row.start(a)
a<-table.element(a, 'F-TEST (DF denominator)',1,TRUE)
a<-table.element(a, mysum$fstatistic[3])
a<-table.row.end(a)
a<-table.row.start(a)
a<-table.element(a, 'p-value',1,TRUE)
a<-table.element(a, 1-pf(mysum$fstatistic[1],mysum$fstatistic[2],mysum$fstatistic[3]))
a<-table.row.end(a)
a<-table.row.start(a)
a<-table.element(a, 'Multiple Linear Regression - Residual Statistics', 2, TRUE)
a<-table.row.end(a)
a<-table.row.start(a)
a<-table.element(a, 'Residual Standard Deviation',1,TRUE)
a<-table.element(a, mysum$sigma)
a<-table.row.end(a)
a<-table.row.start(a)
a<-table.element(a, 'Sum Squared Residuals',1,TRUE)
a<-table.element(a, sum(myerror*myerror))
a<-table.row.end(a)
a<-table.end(a)
table.save(a,file='mytable3.tab')
a<-table.start()
a<-table.row.start(a)
a<-table.element(a, 'Multiple Linear Regression - Actuals, Interpolation, and Residuals', 4, TRUE)
a<-table.row.end(a)
a<-table.row.start(a)
a<-table.element(a, 'Time or Index', 1, TRUE)
a<-table.element(a, 'Actuals', 1, TRUE)
a<-table.element(a, 'Interpolation
Forecast', 1, TRUE)
a<-table.element(a, 'Residuals
Prediction Error', 1, TRUE)
a<-table.row.end(a)
for (i in 1:n) {
a<-table.row.start(a)
a<-table.element(a,i, 1, TRUE)
a<-table.element(a,x[i])
a<-table.element(a,x[i]-mysum$resid[i])
a<-table.element(a,mysum$resid[i])
a<-table.row.end(a)
}
a<-table.end(a)
table.save(a,file='mytable4.tab')