Free Statistics

of Irreproducible Research!

Author's title

Author*The author of this computation has been verified*
R Software Modulerwasp_multipleregression.wasp
Title produced by softwareMultiple Regression
Date of computationMon, 24 Nov 2008 11:12:25 -0700
Cite this page as followsStatistical Computations at FreeStatistics.org, Office for Research Development and Education, URL https://freestatistics.org/blog/index.php?v=date/2008/Nov/24/t1227550549x4bvnc3g0aczfpu.htm/, Retrieved Tue, 14 May 2024 12:11:52 +0000
Statistical Computations at FreeStatistics.org, Office for Research Development and Education, URL https://freestatistics.org/blog/index.php?pk=25476, Retrieved Tue, 14 May 2024 12:11:52 +0000
QR Codes:

Original text written by user:
IsPrivate?No (this computation is public)
User-defined keywords
Estimated Impact138
Family? (F = Feedback message, R = changed R code, M = changed R Module, P = changed Parameters, D = changed Data)
F     [Multiple Regression] [] [2007-11-19 19:55:31] [b731da8b544846036771bbf9bf2f34ce]
-    D    [Multiple Regression] [] [2008-11-24 18:12:25] [6797a1f4a60918966297e9d9220cabc2] [Current]
-   PD      [Multiple Regression] [Case: the Seatbel...] [2008-11-24 18:17:29] [063e4b67ad7d3a8a83eccec794cd5aa7]
Feedback Forum

Post a new message
Dataseries X:
7,4	0
7,2	0
7,1	0
6,9	0
6,8	0
6,8	0
6,8	0
6,9	0
6,7	0
6,6	0
6,5	0
6,4	0
6,3	0
6,3	0
6,3	0
6,5	0
6,6	0
6,5	0
6,4	0
6,5	0
6,7	0
7,1	0
7,1	0
7,2	0
7,2	0
7,3	0
7,3	0
7,3	0
7,3	0
7,4	0
7,6	0
7,6	0
7,6	0
7,7	0
7,8	0
7,9	0
8,1	0
8,1	0
8,1	0
8,2	0
8,2	0
8,2	0
8,2	0
8,2	0
8,2	0
8,3	0
8,3	0
8,4	0
8,4	0
8,4	0
8,3	1
8	1
8	1
8,2	1
8,6	1
8,7	1
8,7	1
8,5	1
8,4	1
8,4	1
8,4	1
8,5	1
8,5	1
8,5	1
8,5	1
8,5	1
8,4	1
8,4	1
8,4	1
8,5	1
8,6	1
8,6	1
8,6	1
8,6	1
8,5	1
8,4	1
8,4	1
8,3	1
8,2	1
8,1	1
8,2	1
8,1	1
8	1
7,9	1
7,8	1
7,7	1
7,7	1
7,9	1
7,8	1
7,6	1
7,4	1
7,3	1
7,1	1
7,1	1
7	1
7	1
7	1
6,9	1
6,8	1
6,7	1
6,6	1
6,6	1


Summary of computational transaction
Raw Inputview raw input (R code)
Raw Outputview raw output of R engine
Computing time12 seconds
R Server'Herman Ole Andreas Wold' @ 193.190.124.10:1001

\begin{tabular}{lllllllll}
\hline
Summary of computational transaction \tabularnewline
Raw Input & view raw input (R code)  \tabularnewline
Raw Output & view raw output of R engine  \tabularnewline
Computing time & 12 seconds \tabularnewline
R Server & 'Herman Ole Andreas Wold' @ 193.190.124.10:1001 \tabularnewline
\hline
\end{tabular}
%Source: https://freestatistics.org/blog/index.php?pk=25476&T=0

[TABLE]
[ROW][C]Summary of computational transaction[/C][/ROW]
[ROW][C]Raw Input[/C][C]view raw input (R code) [/C][/ROW]
[ROW][C]Raw Output[/C][C]view raw output of R engine [/C][/ROW]
[ROW][C]Computing time[/C][C]12 seconds[/C][/ROW]
[ROW][C]R Server[/C][C]'Herman Ole Andreas Wold' @ 193.190.124.10:1001[/C][/ROW]
[/TABLE]
Source: https://freestatistics.org/blog/index.php?pk=25476&T=0

Globally Unique Identifier (entire table): ba.freestatistics.org/blog/index.php?pk=25476&T=0

As an alternative you can also use a QR Code:  

The GUIDs for individual cells are displayed in the table below:

Summary of computational transaction
Raw Inputview raw input (R code)
Raw Outputview raw output of R engine
Computing time12 seconds
R Server'Herman Ole Andreas Wold' @ 193.190.124.10:1001


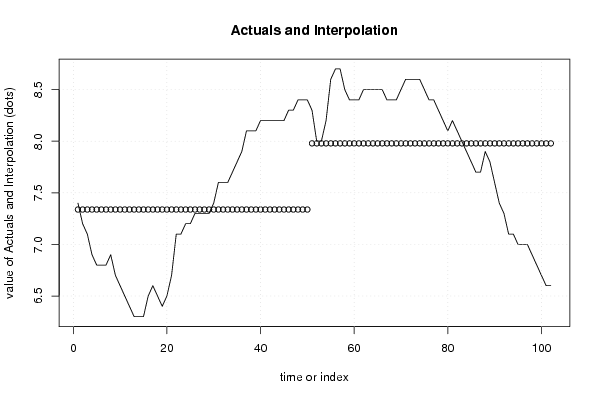
Multiple Linear Regression - Estimated Regression Equation
y[t] = + 7.338 + 0.640846153846153x[t] + e[t]

\begin{tabular}{lllllllll}
\hline
Multiple Linear Regression - Estimated Regression Equation \tabularnewline
y[t] =  +  7.338 +  0.640846153846153x[t]  + e[t] \tabularnewline
\hline
\end{tabular}
%Source: https://freestatistics.org/blog/index.php?pk=25476&T=1

[TABLE]
[ROW][C]Multiple Linear Regression - Estimated Regression Equation[/C][/ROW]
[ROW][C]y[t] =  +  7.338 +  0.640846153846153x[t]  + e[t][/C][/ROW]
[/TABLE]
Source: https://freestatistics.org/blog/index.php?pk=25476&T=1

Globally Unique Identifier (entire table): ba.freestatistics.org/blog/index.php?pk=25476&T=1

As an alternative you can also use a QR Code:  

The GUIDs for individual cells are displayed in the table below:

Multiple Linear Regression - Estimated Regression Equation
y[t] = + 7.338 + 0.640846153846153x[t] + e[t]


Multiple Linear Regression - Ordinary Least Squares
VariableParameterS.D.T-STATH0: parameter = 02-tail p-value1-tail p-value
(Intercept)7.3380.09383478.201500
x0.6408461538461530.131424.87634e-062e-06

\begin{tabular}{lllllllll}
\hline
Multiple Linear Regression - Ordinary Least Squares \tabularnewline
Variable & Parameter & S.D. & T-STATH0: parameter = 0 & 2-tail p-value & 1-tail p-value \tabularnewline
(Intercept) & 7.338 & 0.093834 & 78.2015 & 0 & 0 \tabularnewline
x & 0.640846153846153 & 0.13142 & 4.8763 & 4e-06 & 2e-06 \tabularnewline
\hline
\end{tabular}
%Source: https://freestatistics.org/blog/index.php?pk=25476&T=2

[TABLE]
[ROW][C]Multiple Linear Regression - Ordinary Least Squares[/C][/ROW]
[ROW][C]Variable[/C][C]Parameter[/C][C]S.D.[/C][C]T-STATH0: parameter = 0[/C][C]2-tail p-value[/C][C]1-tail p-value[/C][/ROW]
[ROW][C](Intercept)[/C][C]7.338[/C][C]0.093834[/C][C]78.2015[/C][C]0[/C][C]0[/C][/ROW]
[ROW][C]x[/C][C]0.640846153846153[/C][C]0.13142[/C][C]4.8763[/C][C]4e-06[/C][C]2e-06[/C][/ROW]
[/TABLE]
Source: https://freestatistics.org/blog/index.php?pk=25476&T=2

Globally Unique Identifier (entire table): ba.freestatistics.org/blog/index.php?pk=25476&T=2

As an alternative you can also use a QR Code:  

The GUIDs for individual cells are displayed in the table below:

Multiple Linear Regression - Ordinary Least Squares
VariableParameterS.D.T-STATH0: parameter = 02-tail p-value1-tail p-value
(Intercept)7.3380.09383478.201500
x0.6408461538461530.131424.87634e-062e-06


Multiple Linear Regression - Regression Statistics
Multiple R0.438298763846614
R-squared0.192105806389470
Adjusted R-squared0.184026864453364
F-TEST (value)23.7785848578682
F-TEST (DF numerator)1
F-TEST (DF denominator)100
p-value4.07781139089014e-06
Multiple Linear Regression - Residual Statistics
Residual Standard Deviation0.66350983993631
Sum Squared Residuals44.0245307692308

\begin{tabular}{lllllllll}
\hline
Multiple Linear Regression - Regression Statistics \tabularnewline
Multiple R & 0.438298763846614 \tabularnewline
R-squared & 0.192105806389470 \tabularnewline
Adjusted R-squared & 0.184026864453364 \tabularnewline
F-TEST (value) & 23.7785848578682 \tabularnewline
F-TEST (DF numerator) & 1 \tabularnewline
F-TEST (DF denominator) & 100 \tabularnewline
p-value & 4.07781139089014e-06 \tabularnewline
Multiple Linear Regression - Residual Statistics \tabularnewline
Residual Standard Deviation & 0.66350983993631 \tabularnewline
Sum Squared Residuals & 44.0245307692308 \tabularnewline
\hline
\end{tabular}
%Source: https://freestatistics.org/blog/index.php?pk=25476&T=3

[TABLE]
[ROW][C]Multiple Linear Regression - Regression Statistics[/C][/ROW]
[ROW][C]Multiple R[/C][C]0.438298763846614[/C][/ROW]
[ROW][C]R-squared[/C][C]0.192105806389470[/C][/ROW]
[ROW][C]Adjusted R-squared[/C][C]0.184026864453364[/C][/ROW]
[ROW][C]F-TEST (value)[/C][C]23.7785848578682[/C][/ROW]
[ROW][C]F-TEST (DF numerator)[/C][C]1[/C][/ROW]
[ROW][C]F-TEST (DF denominator)[/C][C]100[/C][/ROW]
[ROW][C]p-value[/C][C]4.07781139089014e-06[/C][/ROW]
[ROW][C]Multiple Linear Regression - Residual Statistics[/C][/ROW]
[ROW][C]Residual Standard Deviation[/C][C]0.66350983993631[/C][/ROW]
[ROW][C]Sum Squared Residuals[/C][C]44.0245307692308[/C][/ROW]
[/TABLE]
Source: https://freestatistics.org/blog/index.php?pk=25476&T=3

Globally Unique Identifier (entire table): ba.freestatistics.org/blog/index.php?pk=25476&T=3

As an alternative you can also use a QR Code:  

The GUIDs for individual cells are displayed in the table below:

Multiple Linear Regression - Regression Statistics
Multiple R0.438298763846614
R-squared0.192105806389470
Adjusted R-squared0.184026864453364
F-TEST (value)23.7785848578682
F-TEST (DF numerator)1
F-TEST (DF denominator)100
p-value4.07781139089014e-06
Multiple Linear Regression - Residual Statistics
Residual Standard Deviation0.66350983993631
Sum Squared Residuals44.0245307692308


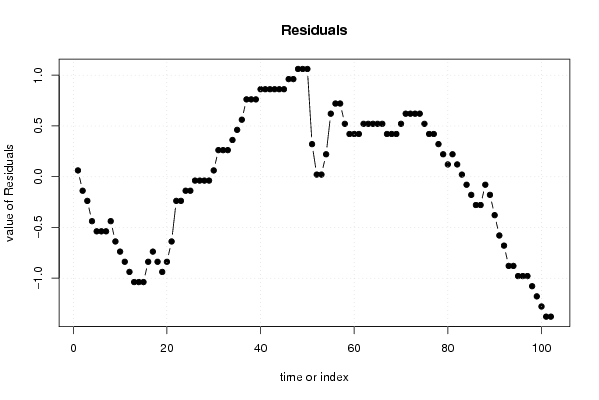
Multiple Linear Regression - Actuals, Interpolation, and Residuals
Time or IndexActualsInterpolationForecastResidualsPrediction Error
17.47.337999999999980.0620000000000203
27.27.338-0.138000000000000
37.17.338-0.238000000000001
46.97.338-0.438
56.87.338-0.538
66.87.338-0.538
76.87.338-0.538
86.97.338-0.438
96.77.338-0.638
106.67.338-0.738
116.57.338-0.838
126.47.338-0.938
136.37.338-1.038
146.37.338-1.038
156.37.338-1.038
166.57.338-0.838
176.67.338-0.738
186.57.338-0.838
196.47.338-0.938
206.57.338-0.838
216.77.338-0.638
227.17.338-0.238000000000001
237.17.338-0.238000000000001
247.27.338-0.138000000000000
257.27.338-0.138000000000000
267.37.338-0.0380000000000005
277.37.338-0.0380000000000005
287.37.338-0.0380000000000005
297.37.338-0.0380000000000005
307.47.3380.062
317.67.3380.261999999999999
327.67.3380.261999999999999
337.67.3380.261999999999999
347.77.3380.362
357.87.3380.461999999999999
367.97.3380.562
378.17.3380.762
388.17.3380.762
398.17.3380.762
408.27.3380.861999999999999
418.27.3380.861999999999999
428.27.3380.861999999999999
438.27.3380.861999999999999
448.27.3380.861999999999999
458.27.3380.861999999999999
468.37.3380.962
478.37.3380.962
488.47.3381.062
498.47.3381.062
508.47.3381.062
518.37.978846153846150.321153846153847
5287.978846153846150.0211538461538462
5387.978846153846150.0211538461538462
548.27.978846153846150.221153846153845
558.67.978846153846150.621153846153846
568.77.978846153846150.721153846153845
578.77.978846153846150.721153846153845
588.57.978846153846150.521153846153846
598.47.978846153846150.421153846153847
608.47.978846153846150.421153846153847
618.47.978846153846150.421153846153847
628.57.978846153846150.521153846153846
638.57.978846153846150.521153846153846
648.57.978846153846150.521153846153846
658.57.978846153846150.521153846153846
668.57.978846153846150.521153846153846
678.47.978846153846150.421153846153847
688.47.978846153846150.421153846153847
698.47.978846153846150.421153846153847
708.57.978846153846150.521153846153846
718.67.978846153846150.621153846153846
728.67.978846153846150.621153846153846
738.67.978846153846150.621153846153846
748.67.978846153846150.621153846153846
758.57.978846153846150.521153846153846
768.47.978846153846150.421153846153847
778.47.978846153846150.421153846153847
788.37.978846153846150.321153846153847
798.27.978846153846150.221153846153845
808.17.978846153846150.121153846153846
818.27.978846153846150.221153846153845
828.17.978846153846150.121153846153846
8387.978846153846150.0211538461538462
847.97.97884615384615-0.0788461538461535
857.87.97884615384615-0.178846153846154
867.77.97884615384615-0.278846153846154
877.77.97884615384615-0.278846153846154
887.97.97884615384615-0.0788461538461535
897.87.97884615384615-0.178846153846154
907.67.97884615384615-0.378846153846154
917.47.97884615384615-0.578846153846153
927.37.97884615384615-0.678846153846154
937.17.97884615384615-0.878846153846154
947.17.97884615384615-0.878846153846154
9577.97884615384615-0.978846153846154
9677.97884615384615-0.978846153846154
9777.97884615384615-0.978846153846154
986.97.97884615384615-1.07884615384615
996.87.97884615384615-1.17884615384615
1006.77.97884615384615-1.27884615384615
1016.67.97884615384615-1.37884615384615
1026.67.97884615384615-1.37884615384615

\begin{tabular}{lllllllll}
\hline
Multiple Linear Regression - Actuals, Interpolation, and Residuals \tabularnewline
Time or Index & Actuals & InterpolationForecast & ResidualsPrediction Error \tabularnewline
1 & 7.4 & 7.33799999999998 & 0.0620000000000203 \tabularnewline
2 & 7.2 & 7.338 & -0.138000000000000 \tabularnewline
3 & 7.1 & 7.338 & -0.238000000000001 \tabularnewline
4 & 6.9 & 7.338 & -0.438 \tabularnewline
5 & 6.8 & 7.338 & -0.538 \tabularnewline
6 & 6.8 & 7.338 & -0.538 \tabularnewline
7 & 6.8 & 7.338 & -0.538 \tabularnewline
8 & 6.9 & 7.338 & -0.438 \tabularnewline
9 & 6.7 & 7.338 & -0.638 \tabularnewline
10 & 6.6 & 7.338 & -0.738 \tabularnewline
11 & 6.5 & 7.338 & -0.838 \tabularnewline
12 & 6.4 & 7.338 & -0.938 \tabularnewline
13 & 6.3 & 7.338 & -1.038 \tabularnewline
14 & 6.3 & 7.338 & -1.038 \tabularnewline
15 & 6.3 & 7.338 & -1.038 \tabularnewline
16 & 6.5 & 7.338 & -0.838 \tabularnewline
17 & 6.6 & 7.338 & -0.738 \tabularnewline
18 & 6.5 & 7.338 & -0.838 \tabularnewline
19 & 6.4 & 7.338 & -0.938 \tabularnewline
20 & 6.5 & 7.338 & -0.838 \tabularnewline
21 & 6.7 & 7.338 & -0.638 \tabularnewline
22 & 7.1 & 7.338 & -0.238000000000001 \tabularnewline
23 & 7.1 & 7.338 & -0.238000000000001 \tabularnewline
24 & 7.2 & 7.338 & -0.138000000000000 \tabularnewline
25 & 7.2 & 7.338 & -0.138000000000000 \tabularnewline
26 & 7.3 & 7.338 & -0.0380000000000005 \tabularnewline
27 & 7.3 & 7.338 & -0.0380000000000005 \tabularnewline
28 & 7.3 & 7.338 & -0.0380000000000005 \tabularnewline
29 & 7.3 & 7.338 & -0.0380000000000005 \tabularnewline
30 & 7.4 & 7.338 & 0.062 \tabularnewline
31 & 7.6 & 7.338 & 0.261999999999999 \tabularnewline
32 & 7.6 & 7.338 & 0.261999999999999 \tabularnewline
33 & 7.6 & 7.338 & 0.261999999999999 \tabularnewline
34 & 7.7 & 7.338 & 0.362 \tabularnewline
35 & 7.8 & 7.338 & 0.461999999999999 \tabularnewline
36 & 7.9 & 7.338 & 0.562 \tabularnewline
37 & 8.1 & 7.338 & 0.762 \tabularnewline
38 & 8.1 & 7.338 & 0.762 \tabularnewline
39 & 8.1 & 7.338 & 0.762 \tabularnewline
40 & 8.2 & 7.338 & 0.861999999999999 \tabularnewline
41 & 8.2 & 7.338 & 0.861999999999999 \tabularnewline
42 & 8.2 & 7.338 & 0.861999999999999 \tabularnewline
43 & 8.2 & 7.338 & 0.861999999999999 \tabularnewline
44 & 8.2 & 7.338 & 0.861999999999999 \tabularnewline
45 & 8.2 & 7.338 & 0.861999999999999 \tabularnewline
46 & 8.3 & 7.338 & 0.962 \tabularnewline
47 & 8.3 & 7.338 & 0.962 \tabularnewline
48 & 8.4 & 7.338 & 1.062 \tabularnewline
49 & 8.4 & 7.338 & 1.062 \tabularnewline
50 & 8.4 & 7.338 & 1.062 \tabularnewline
51 & 8.3 & 7.97884615384615 & 0.321153846153847 \tabularnewline
52 & 8 & 7.97884615384615 & 0.0211538461538462 \tabularnewline
53 & 8 & 7.97884615384615 & 0.0211538461538462 \tabularnewline
54 & 8.2 & 7.97884615384615 & 0.221153846153845 \tabularnewline
55 & 8.6 & 7.97884615384615 & 0.621153846153846 \tabularnewline
56 & 8.7 & 7.97884615384615 & 0.721153846153845 \tabularnewline
57 & 8.7 & 7.97884615384615 & 0.721153846153845 \tabularnewline
58 & 8.5 & 7.97884615384615 & 0.521153846153846 \tabularnewline
59 & 8.4 & 7.97884615384615 & 0.421153846153847 \tabularnewline
60 & 8.4 & 7.97884615384615 & 0.421153846153847 \tabularnewline
61 & 8.4 & 7.97884615384615 & 0.421153846153847 \tabularnewline
62 & 8.5 & 7.97884615384615 & 0.521153846153846 \tabularnewline
63 & 8.5 & 7.97884615384615 & 0.521153846153846 \tabularnewline
64 & 8.5 & 7.97884615384615 & 0.521153846153846 \tabularnewline
65 & 8.5 & 7.97884615384615 & 0.521153846153846 \tabularnewline
66 & 8.5 & 7.97884615384615 & 0.521153846153846 \tabularnewline
67 & 8.4 & 7.97884615384615 & 0.421153846153847 \tabularnewline
68 & 8.4 & 7.97884615384615 & 0.421153846153847 \tabularnewline
69 & 8.4 & 7.97884615384615 & 0.421153846153847 \tabularnewline
70 & 8.5 & 7.97884615384615 & 0.521153846153846 \tabularnewline
71 & 8.6 & 7.97884615384615 & 0.621153846153846 \tabularnewline
72 & 8.6 & 7.97884615384615 & 0.621153846153846 \tabularnewline
73 & 8.6 & 7.97884615384615 & 0.621153846153846 \tabularnewline
74 & 8.6 & 7.97884615384615 & 0.621153846153846 \tabularnewline
75 & 8.5 & 7.97884615384615 & 0.521153846153846 \tabularnewline
76 & 8.4 & 7.97884615384615 & 0.421153846153847 \tabularnewline
77 & 8.4 & 7.97884615384615 & 0.421153846153847 \tabularnewline
78 & 8.3 & 7.97884615384615 & 0.321153846153847 \tabularnewline
79 & 8.2 & 7.97884615384615 & 0.221153846153845 \tabularnewline
80 & 8.1 & 7.97884615384615 & 0.121153846153846 \tabularnewline
81 & 8.2 & 7.97884615384615 & 0.221153846153845 \tabularnewline
82 & 8.1 & 7.97884615384615 & 0.121153846153846 \tabularnewline
83 & 8 & 7.97884615384615 & 0.0211538461538462 \tabularnewline
84 & 7.9 & 7.97884615384615 & -0.0788461538461535 \tabularnewline
85 & 7.8 & 7.97884615384615 & -0.178846153846154 \tabularnewline
86 & 7.7 & 7.97884615384615 & -0.278846153846154 \tabularnewline
87 & 7.7 & 7.97884615384615 & -0.278846153846154 \tabularnewline
88 & 7.9 & 7.97884615384615 & -0.0788461538461535 \tabularnewline
89 & 7.8 & 7.97884615384615 & -0.178846153846154 \tabularnewline
90 & 7.6 & 7.97884615384615 & -0.378846153846154 \tabularnewline
91 & 7.4 & 7.97884615384615 & -0.578846153846153 \tabularnewline
92 & 7.3 & 7.97884615384615 & -0.678846153846154 \tabularnewline
93 & 7.1 & 7.97884615384615 & -0.878846153846154 \tabularnewline
94 & 7.1 & 7.97884615384615 & -0.878846153846154 \tabularnewline
95 & 7 & 7.97884615384615 & -0.978846153846154 \tabularnewline
96 & 7 & 7.97884615384615 & -0.978846153846154 \tabularnewline
97 & 7 & 7.97884615384615 & -0.978846153846154 \tabularnewline
98 & 6.9 & 7.97884615384615 & -1.07884615384615 \tabularnewline
99 & 6.8 & 7.97884615384615 & -1.17884615384615 \tabularnewline
100 & 6.7 & 7.97884615384615 & -1.27884615384615 \tabularnewline
101 & 6.6 & 7.97884615384615 & -1.37884615384615 \tabularnewline
102 & 6.6 & 7.97884615384615 & -1.37884615384615 \tabularnewline
\hline
\end{tabular}
%Source: https://freestatistics.org/blog/index.php?pk=25476&T=4

[TABLE]
[ROW][C]Multiple Linear Regression - Actuals, Interpolation, and Residuals[/C][/ROW]
[ROW][C]Time or Index[/C][C]Actuals[/C][C]InterpolationForecast[/C][C]ResidualsPrediction Error[/C][/ROW]
[ROW][C]1[/C][C]7.4[/C][C]7.33799999999998[/C][C]0.0620000000000203[/C][/ROW]
[ROW][C]2[/C][C]7.2[/C][C]7.338[/C][C]-0.138000000000000[/C][/ROW]
[ROW][C]3[/C][C]7.1[/C][C]7.338[/C][C]-0.238000000000001[/C][/ROW]
[ROW][C]4[/C][C]6.9[/C][C]7.338[/C][C]-0.438[/C][/ROW]
[ROW][C]5[/C][C]6.8[/C][C]7.338[/C][C]-0.538[/C][/ROW]
[ROW][C]6[/C][C]6.8[/C][C]7.338[/C][C]-0.538[/C][/ROW]
[ROW][C]7[/C][C]6.8[/C][C]7.338[/C][C]-0.538[/C][/ROW]
[ROW][C]8[/C][C]6.9[/C][C]7.338[/C][C]-0.438[/C][/ROW]
[ROW][C]9[/C][C]6.7[/C][C]7.338[/C][C]-0.638[/C][/ROW]
[ROW][C]10[/C][C]6.6[/C][C]7.338[/C][C]-0.738[/C][/ROW]
[ROW][C]11[/C][C]6.5[/C][C]7.338[/C][C]-0.838[/C][/ROW]
[ROW][C]12[/C][C]6.4[/C][C]7.338[/C][C]-0.938[/C][/ROW]
[ROW][C]13[/C][C]6.3[/C][C]7.338[/C][C]-1.038[/C][/ROW]
[ROW][C]14[/C][C]6.3[/C][C]7.338[/C][C]-1.038[/C][/ROW]
[ROW][C]15[/C][C]6.3[/C][C]7.338[/C][C]-1.038[/C][/ROW]
[ROW][C]16[/C][C]6.5[/C][C]7.338[/C][C]-0.838[/C][/ROW]
[ROW][C]17[/C][C]6.6[/C][C]7.338[/C][C]-0.738[/C][/ROW]
[ROW][C]18[/C][C]6.5[/C][C]7.338[/C][C]-0.838[/C][/ROW]
[ROW][C]19[/C][C]6.4[/C][C]7.338[/C][C]-0.938[/C][/ROW]
[ROW][C]20[/C][C]6.5[/C][C]7.338[/C][C]-0.838[/C][/ROW]
[ROW][C]21[/C][C]6.7[/C][C]7.338[/C][C]-0.638[/C][/ROW]
[ROW][C]22[/C][C]7.1[/C][C]7.338[/C][C]-0.238000000000001[/C][/ROW]
[ROW][C]23[/C][C]7.1[/C][C]7.338[/C][C]-0.238000000000001[/C][/ROW]
[ROW][C]24[/C][C]7.2[/C][C]7.338[/C][C]-0.138000000000000[/C][/ROW]
[ROW][C]25[/C][C]7.2[/C][C]7.338[/C][C]-0.138000000000000[/C][/ROW]
[ROW][C]26[/C][C]7.3[/C][C]7.338[/C][C]-0.0380000000000005[/C][/ROW]
[ROW][C]27[/C][C]7.3[/C][C]7.338[/C][C]-0.0380000000000005[/C][/ROW]
[ROW][C]28[/C][C]7.3[/C][C]7.338[/C][C]-0.0380000000000005[/C][/ROW]
[ROW][C]29[/C][C]7.3[/C][C]7.338[/C][C]-0.0380000000000005[/C][/ROW]
[ROW][C]30[/C][C]7.4[/C][C]7.338[/C][C]0.062[/C][/ROW]
[ROW][C]31[/C][C]7.6[/C][C]7.338[/C][C]0.261999999999999[/C][/ROW]
[ROW][C]32[/C][C]7.6[/C][C]7.338[/C][C]0.261999999999999[/C][/ROW]
[ROW][C]33[/C][C]7.6[/C][C]7.338[/C][C]0.261999999999999[/C][/ROW]
[ROW][C]34[/C][C]7.7[/C][C]7.338[/C][C]0.362[/C][/ROW]
[ROW][C]35[/C][C]7.8[/C][C]7.338[/C][C]0.461999999999999[/C][/ROW]
[ROW][C]36[/C][C]7.9[/C][C]7.338[/C][C]0.562[/C][/ROW]
[ROW][C]37[/C][C]8.1[/C][C]7.338[/C][C]0.762[/C][/ROW]
[ROW][C]38[/C][C]8.1[/C][C]7.338[/C][C]0.762[/C][/ROW]
[ROW][C]39[/C][C]8.1[/C][C]7.338[/C][C]0.762[/C][/ROW]
[ROW][C]40[/C][C]8.2[/C][C]7.338[/C][C]0.861999999999999[/C][/ROW]
[ROW][C]41[/C][C]8.2[/C][C]7.338[/C][C]0.861999999999999[/C][/ROW]
[ROW][C]42[/C][C]8.2[/C][C]7.338[/C][C]0.861999999999999[/C][/ROW]
[ROW][C]43[/C][C]8.2[/C][C]7.338[/C][C]0.861999999999999[/C][/ROW]
[ROW][C]44[/C][C]8.2[/C][C]7.338[/C][C]0.861999999999999[/C][/ROW]
[ROW][C]45[/C][C]8.2[/C][C]7.338[/C][C]0.861999999999999[/C][/ROW]
[ROW][C]46[/C][C]8.3[/C][C]7.338[/C][C]0.962[/C][/ROW]
[ROW][C]47[/C][C]8.3[/C][C]7.338[/C][C]0.962[/C][/ROW]
[ROW][C]48[/C][C]8.4[/C][C]7.338[/C][C]1.062[/C][/ROW]
[ROW][C]49[/C][C]8.4[/C][C]7.338[/C][C]1.062[/C][/ROW]
[ROW][C]50[/C][C]8.4[/C][C]7.338[/C][C]1.062[/C][/ROW]
[ROW][C]51[/C][C]8.3[/C][C]7.97884615384615[/C][C]0.321153846153847[/C][/ROW]
[ROW][C]52[/C][C]8[/C][C]7.97884615384615[/C][C]0.0211538461538462[/C][/ROW]
[ROW][C]53[/C][C]8[/C][C]7.97884615384615[/C][C]0.0211538461538462[/C][/ROW]
[ROW][C]54[/C][C]8.2[/C][C]7.97884615384615[/C][C]0.221153846153845[/C][/ROW]
[ROW][C]55[/C][C]8.6[/C][C]7.97884615384615[/C][C]0.621153846153846[/C][/ROW]
[ROW][C]56[/C][C]8.7[/C][C]7.97884615384615[/C][C]0.721153846153845[/C][/ROW]
[ROW][C]57[/C][C]8.7[/C][C]7.97884615384615[/C][C]0.721153846153845[/C][/ROW]
[ROW][C]58[/C][C]8.5[/C][C]7.97884615384615[/C][C]0.521153846153846[/C][/ROW]
[ROW][C]59[/C][C]8.4[/C][C]7.97884615384615[/C][C]0.421153846153847[/C][/ROW]
[ROW][C]60[/C][C]8.4[/C][C]7.97884615384615[/C][C]0.421153846153847[/C][/ROW]
[ROW][C]61[/C][C]8.4[/C][C]7.97884615384615[/C][C]0.421153846153847[/C][/ROW]
[ROW][C]62[/C][C]8.5[/C][C]7.97884615384615[/C][C]0.521153846153846[/C][/ROW]
[ROW][C]63[/C][C]8.5[/C][C]7.97884615384615[/C][C]0.521153846153846[/C][/ROW]
[ROW][C]64[/C][C]8.5[/C][C]7.97884615384615[/C][C]0.521153846153846[/C][/ROW]
[ROW][C]65[/C][C]8.5[/C][C]7.97884615384615[/C][C]0.521153846153846[/C][/ROW]
[ROW][C]66[/C][C]8.5[/C][C]7.97884615384615[/C][C]0.521153846153846[/C][/ROW]
[ROW][C]67[/C][C]8.4[/C][C]7.97884615384615[/C][C]0.421153846153847[/C][/ROW]
[ROW][C]68[/C][C]8.4[/C][C]7.97884615384615[/C][C]0.421153846153847[/C][/ROW]
[ROW][C]69[/C][C]8.4[/C][C]7.97884615384615[/C][C]0.421153846153847[/C][/ROW]
[ROW][C]70[/C][C]8.5[/C][C]7.97884615384615[/C][C]0.521153846153846[/C][/ROW]
[ROW][C]71[/C][C]8.6[/C][C]7.97884615384615[/C][C]0.621153846153846[/C][/ROW]
[ROW][C]72[/C][C]8.6[/C][C]7.97884615384615[/C][C]0.621153846153846[/C][/ROW]
[ROW][C]73[/C][C]8.6[/C][C]7.97884615384615[/C][C]0.621153846153846[/C][/ROW]
[ROW][C]74[/C][C]8.6[/C][C]7.97884615384615[/C][C]0.621153846153846[/C][/ROW]
[ROW][C]75[/C][C]8.5[/C][C]7.97884615384615[/C][C]0.521153846153846[/C][/ROW]
[ROW][C]76[/C][C]8.4[/C][C]7.97884615384615[/C][C]0.421153846153847[/C][/ROW]
[ROW][C]77[/C][C]8.4[/C][C]7.97884615384615[/C][C]0.421153846153847[/C][/ROW]
[ROW][C]78[/C][C]8.3[/C][C]7.97884615384615[/C][C]0.321153846153847[/C][/ROW]
[ROW][C]79[/C][C]8.2[/C][C]7.97884615384615[/C][C]0.221153846153845[/C][/ROW]
[ROW][C]80[/C][C]8.1[/C][C]7.97884615384615[/C][C]0.121153846153846[/C][/ROW]
[ROW][C]81[/C][C]8.2[/C][C]7.97884615384615[/C][C]0.221153846153845[/C][/ROW]
[ROW][C]82[/C][C]8.1[/C][C]7.97884615384615[/C][C]0.121153846153846[/C][/ROW]
[ROW][C]83[/C][C]8[/C][C]7.97884615384615[/C][C]0.0211538461538462[/C][/ROW]
[ROW][C]84[/C][C]7.9[/C][C]7.97884615384615[/C][C]-0.0788461538461535[/C][/ROW]
[ROW][C]85[/C][C]7.8[/C][C]7.97884615384615[/C][C]-0.178846153846154[/C][/ROW]
[ROW][C]86[/C][C]7.7[/C][C]7.97884615384615[/C][C]-0.278846153846154[/C][/ROW]
[ROW][C]87[/C][C]7.7[/C][C]7.97884615384615[/C][C]-0.278846153846154[/C][/ROW]
[ROW][C]88[/C][C]7.9[/C][C]7.97884615384615[/C][C]-0.0788461538461535[/C][/ROW]
[ROW][C]89[/C][C]7.8[/C][C]7.97884615384615[/C][C]-0.178846153846154[/C][/ROW]
[ROW][C]90[/C][C]7.6[/C][C]7.97884615384615[/C][C]-0.378846153846154[/C][/ROW]
[ROW][C]91[/C][C]7.4[/C][C]7.97884615384615[/C][C]-0.578846153846153[/C][/ROW]
[ROW][C]92[/C][C]7.3[/C][C]7.97884615384615[/C][C]-0.678846153846154[/C][/ROW]
[ROW][C]93[/C][C]7.1[/C][C]7.97884615384615[/C][C]-0.878846153846154[/C][/ROW]
[ROW][C]94[/C][C]7.1[/C][C]7.97884615384615[/C][C]-0.878846153846154[/C][/ROW]
[ROW][C]95[/C][C]7[/C][C]7.97884615384615[/C][C]-0.978846153846154[/C][/ROW]
[ROW][C]96[/C][C]7[/C][C]7.97884615384615[/C][C]-0.978846153846154[/C][/ROW]
[ROW][C]97[/C][C]7[/C][C]7.97884615384615[/C][C]-0.978846153846154[/C][/ROW]
[ROW][C]98[/C][C]6.9[/C][C]7.97884615384615[/C][C]-1.07884615384615[/C][/ROW]
[ROW][C]99[/C][C]6.8[/C][C]7.97884615384615[/C][C]-1.17884615384615[/C][/ROW]
[ROW][C]100[/C][C]6.7[/C][C]7.97884615384615[/C][C]-1.27884615384615[/C][/ROW]
[ROW][C]101[/C][C]6.6[/C][C]7.97884615384615[/C][C]-1.37884615384615[/C][/ROW]
[ROW][C]102[/C][C]6.6[/C][C]7.97884615384615[/C][C]-1.37884615384615[/C][/ROW]
[/TABLE]
Source: https://freestatistics.org/blog/index.php?pk=25476&T=4

Globally Unique Identifier (entire table): ba.freestatistics.org/blog/index.php?pk=25476&T=4

As an alternative you can also use a QR Code:  

The GUIDs for individual cells are displayed in the table below:

Multiple Linear Regression - Actuals, Interpolation, and Residuals
Time or IndexActualsInterpolationForecastResidualsPrediction Error
17.47.337999999999980.0620000000000203
27.27.338-0.138000000000000
37.17.338-0.238000000000001
46.97.338-0.438
56.87.338-0.538
66.87.338-0.538
76.87.338-0.538
86.97.338-0.438
96.77.338-0.638
106.67.338-0.738
116.57.338-0.838
126.47.338-0.938
136.37.338-1.038
146.37.338-1.038
156.37.338-1.038
166.57.338-0.838
176.67.338-0.738
186.57.338-0.838
196.47.338-0.938
206.57.338-0.838
216.77.338-0.638
227.17.338-0.238000000000001
237.17.338-0.238000000000001
247.27.338-0.138000000000000
257.27.338-0.138000000000000
267.37.338-0.0380000000000005
277.37.338-0.0380000000000005
287.37.338-0.0380000000000005
297.37.338-0.0380000000000005
307.47.3380.062
317.67.3380.261999999999999
327.67.3380.261999999999999
337.67.3380.261999999999999
347.77.3380.362
357.87.3380.461999999999999
367.97.3380.562
378.17.3380.762
388.17.3380.762
398.17.3380.762
408.27.3380.861999999999999
418.27.3380.861999999999999
428.27.3380.861999999999999
438.27.3380.861999999999999
448.27.3380.861999999999999
458.27.3380.861999999999999
468.37.3380.962
478.37.3380.962
488.47.3381.062
498.47.3381.062
508.47.3381.062
518.37.978846153846150.321153846153847
5287.978846153846150.0211538461538462
5387.978846153846150.0211538461538462
548.27.978846153846150.221153846153845
558.67.978846153846150.621153846153846
568.77.978846153846150.721153846153845
578.77.978846153846150.721153846153845
588.57.978846153846150.521153846153846
598.47.978846153846150.421153846153847
608.47.978846153846150.421153846153847
618.47.978846153846150.421153846153847
628.57.978846153846150.521153846153846
638.57.978846153846150.521153846153846
648.57.978846153846150.521153846153846
658.57.978846153846150.521153846153846
668.57.978846153846150.521153846153846
678.47.978846153846150.421153846153847
688.47.978846153846150.421153846153847
698.47.978846153846150.421153846153847
708.57.978846153846150.521153846153846
718.67.978846153846150.621153846153846
728.67.978846153846150.621153846153846
738.67.978846153846150.621153846153846
748.67.978846153846150.621153846153846
758.57.978846153846150.521153846153846
768.47.978846153846150.421153846153847
778.47.978846153846150.421153846153847
788.37.978846153846150.321153846153847
798.27.978846153846150.221153846153845
808.17.978846153846150.121153846153846
818.27.978846153846150.221153846153845
828.17.978846153846150.121153846153846
8387.978846153846150.0211538461538462
847.97.97884615384615-0.0788461538461535
857.87.97884615384615-0.178846153846154
867.77.97884615384615-0.278846153846154
877.77.97884615384615-0.278846153846154
887.97.97884615384615-0.0788461538461535
897.87.97884615384615-0.178846153846154
907.67.97884615384615-0.378846153846154
917.47.97884615384615-0.578846153846153
927.37.97884615384615-0.678846153846154
937.17.97884615384615-0.878846153846154
947.17.97884615384615-0.878846153846154
9577.97884615384615-0.978846153846154
9677.97884615384615-0.978846153846154
9777.97884615384615-0.978846153846154
986.97.97884615384615-1.07884615384615
996.87.97884615384615-1.17884615384615
1006.77.97884615384615-1.27884615384615
1016.67.97884615384615-1.37884615384615
1026.67.97884615384615-1.37884615384615


Parameters (Session):
par1 = 1 ; par2 = Do not include Seasonal Dummies ; par3 = No Linear Trend ;
Parameters (R input):
par1 = 1 ; par2 = Do not include Seasonal Dummies ; par3 = No Linear Trend ;
R code (references can be found in the software module):
library(lattice)
par1 <- as.numeric(par1)
x <- t(y)
k <- length(x[1,])
n <- length(x[,1])
x1 <- cbind(x[,par1], x[,1:k!=par1])
mycolnames <- c(colnames(x)[par1], colnames(x)[1:k!=par1])
colnames(x1) <- mycolnames #colnames(x)[par1]
x <- x1
if (par3 == 'First Differences'){
x2 <- array(0, dim=c(n-1,k), dimnames=list(1:(n-1), paste('(1-B)',colnames(x),sep='')))
for (i in 1:n-1) {
for (j in 1:k) {
x2[i,j] <- x[i+1,j] - x[i,j]
}
}
x <- x2
}
if (par2 == 'Include Monthly Dummies'){
x2 <- array(0, dim=c(n,11), dimnames=list(1:n, paste('M', seq(1:11), sep ='')))
for (i in 1:11){
x2[seq(i,n,12),i] <- 1
}
x <- cbind(x, x2)
}
if (par2 == 'Include Quarterly Dummies'){
x2 <- array(0, dim=c(n,3), dimnames=list(1:n, paste('Q', seq(1:3), sep ='')))
for (i in 1:3){
x2[seq(i,n,4),i] <- 1
}
x <- cbind(x, x2)
}
k <- length(x[1,])
if (par3 == 'Linear Trend'){
x <- cbind(x, c(1:n))
colnames(x)[k+1] <- 't'
}
x
k <- length(x[1,])
df <- as.data.frame(x)
(mylm <- lm(df))
(mysum <- summary(mylm))
bitmap(file='test0.png')
plot(x[,1], type='l', main='Actuals and Interpolation', ylab='value of Actuals and Interpolation (dots)', xlab='time or index')
points(x[,1]-mysum$resid)
grid()
dev.off()
bitmap(file='test1.png')
plot(mysum$resid, type='b', pch=19, main='Residuals', ylab='value of Residuals', xlab='time or index')
grid()
dev.off()
bitmap(file='test2.png')
hist(mysum$resid, main='Residual Histogram', xlab='values of Residuals')
grid()
dev.off()
bitmap(file='test3.png')
densityplot(~mysum$resid,col='black',main='Residual Density Plot', xlab='values of Residuals')
dev.off()
bitmap(file='test4.png')
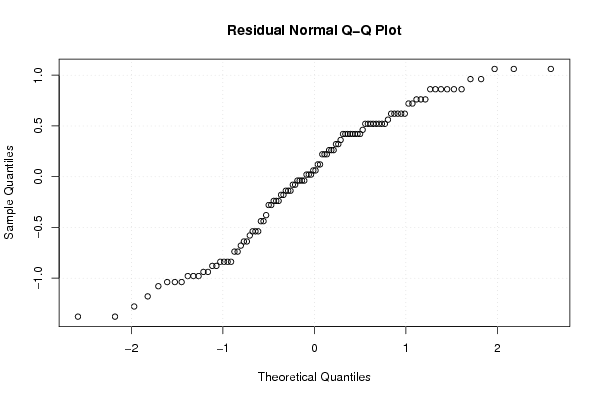
qqnorm(mysum$resid, main='Residual Normal Q-Q Plot')
grid()
dev.off()
(myerror <- as.ts(mysum$resid))
bitmap(file='test5.png')
dum <- cbind(lag(myerror,k=1),myerror)
dum
dum1 <- dum[2:length(myerror),]
dum1
z <- as.data.frame(dum1)
z
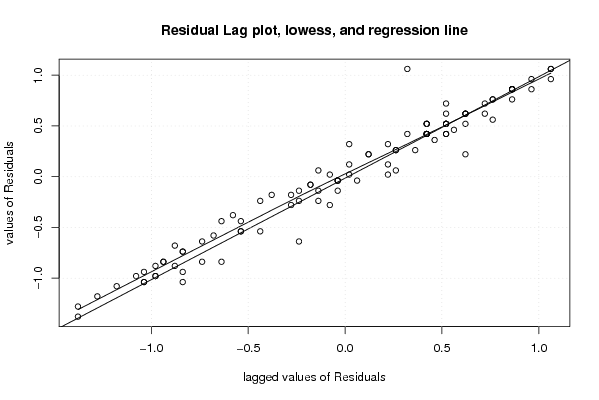
plot(z,main=paste('Residual Lag plot, lowess, and regression line'), ylab='values of Residuals', xlab='lagged values of Residuals')
lines(lowess(z))
abline(lm(z))
grid()
dev.off()
bitmap(file='test6.png')
acf(mysum$resid, lag.max=length(mysum$resid)/2, main='Residual Autocorrelation Function')
grid()
dev.off()
bitmap(file='test7.png')
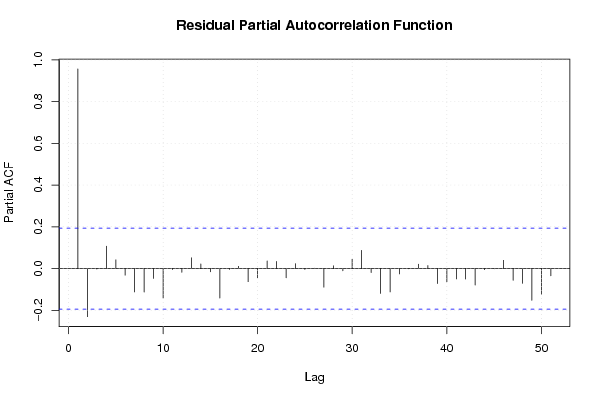
pacf(mysum$resid, lag.max=length(mysum$resid)/2, main='Residual Partial Autocorrelation Function')
grid()
dev.off()
bitmap(file='test8.png')
opar <- par(mfrow = c(2,2), oma = c(0, 0, 1.1, 0))
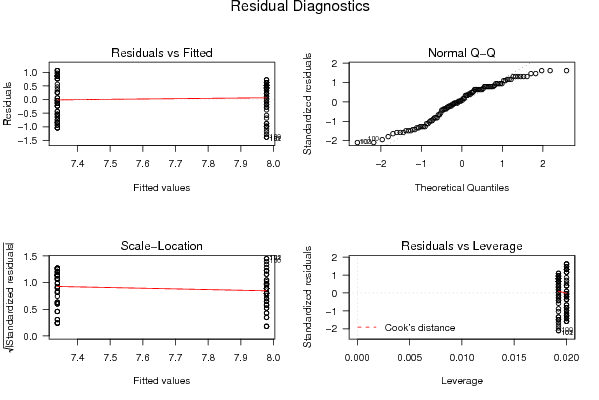
plot(mylm, las = 1, sub='Residual Diagnostics')
par(opar)
dev.off()
load(file='createtable')
a<-table.start()
a<-table.row.start(a)
a<-table.element(a, 'Multiple Linear Regression - Estimated Regression Equation', 1, TRUE)
a<-table.row.end(a)
myeq <- colnames(x)[1]
myeq <- paste(myeq, '[t] = ', sep='')
for (i in 1:k){
if (mysum$coefficients[i,1] > 0) myeq <- paste(myeq, '+', '')
myeq <- paste(myeq, mysum$coefficients[i,1], sep=' ')
if (rownames(mysum$coefficients)[i] != '(Intercept)') {
myeq <- paste(myeq, rownames(mysum$coefficients)[i], sep='')
if (rownames(mysum$coefficients)[i] != 't') myeq <- paste(myeq, '[t]', sep='')
}
}
myeq <- paste(myeq, ' + e[t]')
a<-table.row.start(a)
a<-table.element(a, myeq)
a<-table.row.end(a)
a<-table.end(a)
table.save(a,file='mytable1.tab')
a<-table.start()
a<-table.row.start(a)
a<-table.element(a,hyperlink('ols1.htm','Multiple Linear Regression - Ordinary Least Squares',''), 6, TRUE)
a<-table.row.end(a)
a<-table.row.start(a)
a<-table.element(a,'Variable',header=TRUE)
a<-table.element(a,'Parameter',header=TRUE)
a<-table.element(a,'S.D.',header=TRUE)
a<-table.element(a,'T-STAT
H0: parameter = 0',header=TRUE)
a<-table.element(a,'2-tail p-value',header=TRUE)
a<-table.element(a,'1-tail p-value',header=TRUE)
a<-table.row.end(a)
for (i in 1:k){
a<-table.row.start(a)
a<-table.element(a,rownames(mysum$coefficients)[i],header=TRUE)
a<-table.element(a,mysum$coefficients[i,1])
a<-table.element(a, round(mysum$coefficients[i,2],6))
a<-table.element(a, round(mysum$coefficients[i,3],4))
a<-table.element(a, round(mysum$coefficients[i,4],6))
a<-table.element(a, round(mysum$coefficients[i,4]/2,6))
a<-table.row.end(a)
}
a<-table.end(a)
table.save(a,file='mytable2.tab')
a<-table.start()
a<-table.row.start(a)
a<-table.element(a, 'Multiple Linear Regression - Regression Statistics', 2, TRUE)
a<-table.row.end(a)
a<-table.row.start(a)
a<-table.element(a, 'Multiple R',1,TRUE)
a<-table.element(a, sqrt(mysum$r.squared))
a<-table.row.end(a)
a<-table.row.start(a)
a<-table.element(a, 'R-squared',1,TRUE)
a<-table.element(a, mysum$r.squared)
a<-table.row.end(a)
a<-table.row.start(a)
a<-table.element(a, 'Adjusted R-squared',1,TRUE)
a<-table.element(a, mysum$adj.r.squared)
a<-table.row.end(a)
a<-table.row.start(a)
a<-table.element(a, 'F-TEST (value)',1,TRUE)
a<-table.element(a, mysum$fstatistic[1])
a<-table.row.end(a)
a<-table.row.start(a)
a<-table.element(a, 'F-TEST (DF numerator)',1,TRUE)
a<-table.element(a, mysum$fstatistic[2])
a<-table.row.end(a)
a<-table.row.start(a)
a<-table.element(a, 'F-TEST (DF denominator)',1,TRUE)
a<-table.element(a, mysum$fstatistic[3])
a<-table.row.end(a)
a<-table.row.start(a)
a<-table.element(a, 'p-value',1,TRUE)
a<-table.element(a, 1-pf(mysum$fstatistic[1],mysum$fstatistic[2],mysum$fstatistic[3]))
a<-table.row.end(a)
a<-table.row.start(a)
a<-table.element(a, 'Multiple Linear Regression - Residual Statistics', 2, TRUE)
a<-table.row.end(a)
a<-table.row.start(a)
a<-table.element(a, 'Residual Standard Deviation',1,TRUE)
a<-table.element(a, mysum$sigma)
a<-table.row.end(a)
a<-table.row.start(a)
a<-table.element(a, 'Sum Squared Residuals',1,TRUE)
a<-table.element(a, sum(myerror*myerror))
a<-table.row.end(a)
a<-table.end(a)
table.save(a,file='mytable3.tab')
a<-table.start()
a<-table.row.start(a)
a<-table.element(a, 'Multiple Linear Regression - Actuals, Interpolation, and Residuals', 4, TRUE)
a<-table.row.end(a)
a<-table.row.start(a)
a<-table.element(a, 'Time or Index', 1, TRUE)
a<-table.element(a, 'Actuals', 1, TRUE)
a<-table.element(a, 'Interpolation
Forecast', 1, TRUE)
a<-table.element(a, 'Residuals
Prediction Error', 1, TRUE)
a<-table.row.end(a)
for (i in 1:n) {
a<-table.row.start(a)
a<-table.element(a,i, 1, TRUE)
a<-table.element(a,x[i])
a<-table.element(a,x[i]-mysum$resid[i])
a<-table.element(a,mysum$resid[i])
a<-table.row.end(a)
}
a<-table.end(a)
table.save(a,file='mytable4.tab')