Free Statistics

of Irreproducible Research!

Author's title

Author*Unverified author*
R Software Modulerwasp_multipleregression.wasp
Title produced by softwareMultiple Regression
Date of computationMon, 24 Nov 2008 11:04:59 -0700
Cite this page as followsStatistical Computations at FreeStatistics.org, Office for Research Development and Education, URL https://freestatistics.org/blog/index.php?v=date/2008/Nov/24/t1227549948r8xy1x1qbyrf4e5.htm/, Retrieved Mon, 13 May 2024 21:03:18 +0000
Statistical Computations at FreeStatistics.org, Office for Research Development and Education, URL https://freestatistics.org/blog/index.php?pk=25473, Retrieved Mon, 13 May 2024 21:03:18 +0000
QR Codes:

Original text written by user:
IsPrivate?No (this computation is public)
User-defined keywords
Estimated Impact184
Family? (F = Feedback message, R = changed R code, M = changed R Module, P = changed Parameters, D = changed Data)
F     [Multiple Regression] [] [2007-11-19 20:22:41] [3a1956effdcb54c39e5044435310d6c8]
F R  D    [Multiple Regression] [seatbeltlaw Q3 we...] [2008-11-24 18:04:59] [b09437381d488816ab9f5cf07e347c02] [Current]
Feedback Forum
2008-11-30 14:44:50 [Ken Wright] [reply
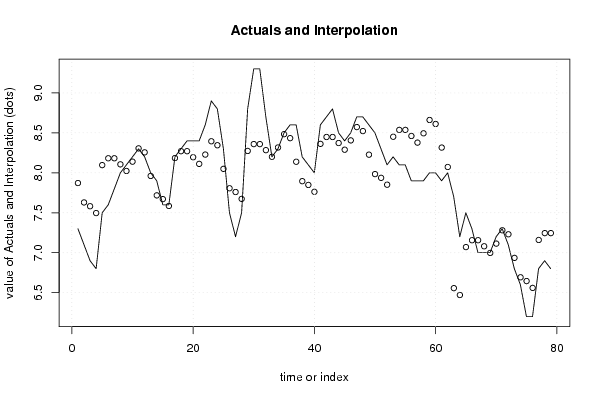
bij actuals and interpolation zie je voor de invoering van de dummy ook nog een golvend verloop, dus er kunnen nog andere gegevens zijn die invloed uitoefenen op de werkloosheidsgraad.
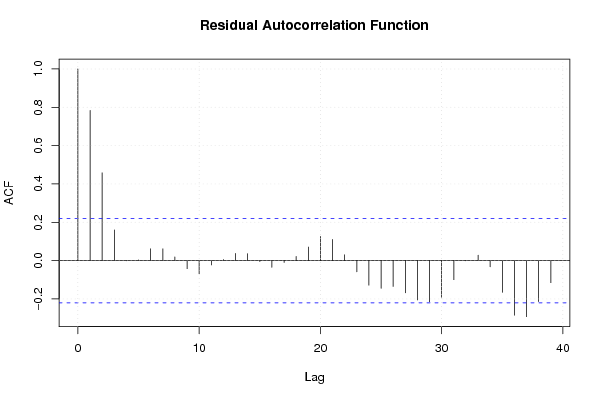
bij residual autocorrelation wordt het 95% betrouwbaarheidsinterval soms overschreden; dit duidt erop dat er kan worden voorspeld op basis van het verleden. Wat niet goed is voor dit model
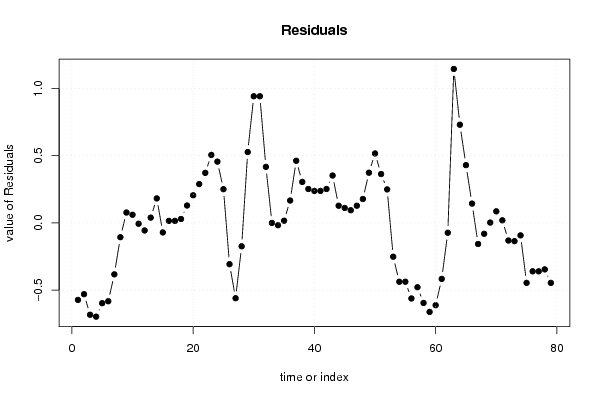
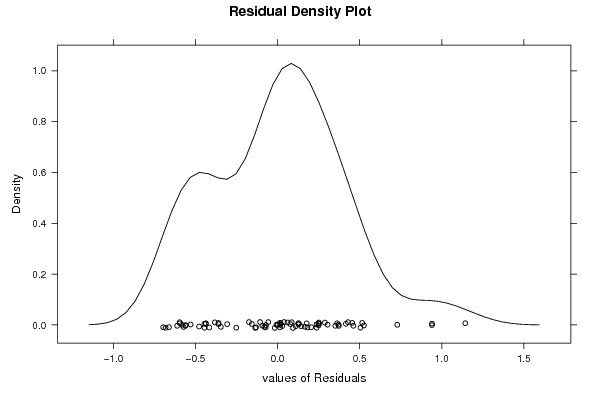
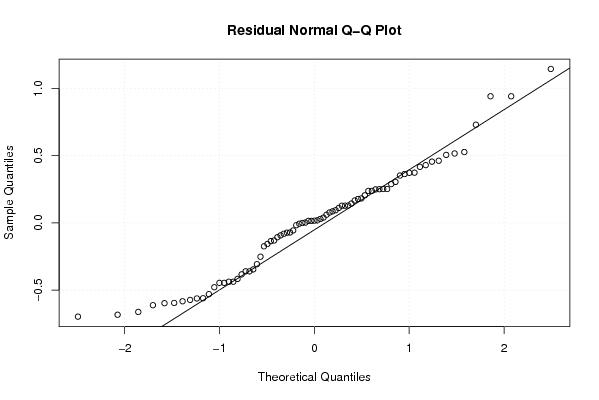
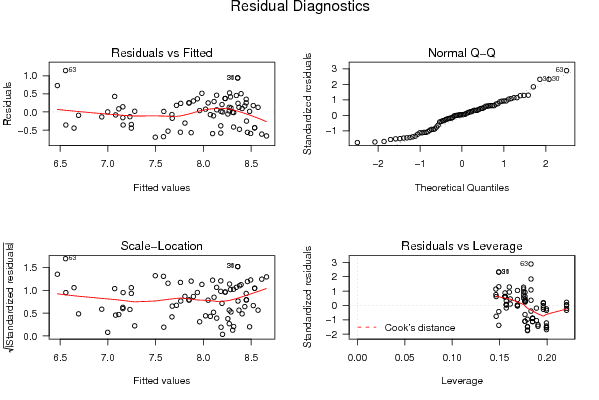
bij grafiek van de residuals kan je zien dat het verschil tussen het aantal effectieve werklozen en het aantal geschatte nooit gelijk aan 0 zal zijn

men kan besluiten dat er nog veel aan het model kan worden gewerkt.
2008-11-30 16:48:36 [Lana Van Wesemael] [reply
De keuze van de 1 of 2 zijdige p-waarde is goed geargumenteerd.
- actuals and interpolation: het is inderdaad duidelijk dat de dummy een invloed heeft op de werkloosheid. Voor de invoering van de dummy zijn er echter ook schommelingen te zien, deze zullen te wijten zijn aan andere variabelen.
- residual autocorrelation:hier kan ik nog aan toevoegen dat er sprake is van autocorrelatie, positieve waarden worden gevolgd door positieve waarden en omgekeerd. Dus het model kan nog verbeterd worden.
- residuals: als het een goed model is zouden deze moeten schommelen rond nul, wat nog niet het geval is. Er is ook hier autocorrelatie positieve waarden worden gevolgd door positieve waarden en omgekeerd. Dit wijst erop dat er voorspelbaarheid aanwezig is. Het model kan dus nog verder verbeterd worden.
- residual lag plot: deze grafiek heeft de student niet opgenomen in zijn worddocument. In deze grafiek kan men een positieve correlatie opmerken. Er is voorspelbaarheid op basis van het verleden. Het model is dus nog voor verbetering vatbaar.

Post a new message
Dataseries X:
7,3	0
7,1	0
6,9	0
6,8	0
7,5	0
7,6	0
7,8	0
8	0
8,1	0
8,2	0
8,3	0
8,2	0
8	0
7,9	0
7,6	0
7,6	0
8,2	0
8,3	0
8,4	0
8,4	0
8,4	0
8,6	0
8,9	0
8,8	0
8,3	0
7,5	0
7,2	0
7,5	0
8,8	0
9,3	0
9,3	0
8,7	0
8,2	0
8,3	0
8,5	0
8,6	0
8,6	0
8,2	0
8,1	0
8	0
8,6	0
8,7	0
8,8	0
8,5	0
8,4	0
8,5	0
8,7	0
8,7	0
8,6	0
8,5	0
8,3	0
8,1	0
8,2	0
8,1	0
8,1	0
7,9	0
7,9	0
7,9	0
8	0
8	0
7,9	0
8	0
7,7	1
7,2	1
7,5	1
7,3	1
7	1
7	1
7	1
7,2	1
7,3	1
7,1	1
6,8	1
6,6	1
6,2	1
6,2	1
6,8	1
6,9	1
6,8	1


Summary of computational transaction
Raw Inputview raw input (R code)
Raw Outputview raw output of R engine
Computing time7 seconds
R Server'Herman Ole Andreas Wold' @ 193.190.124.10:1001

\begin{tabular}{lllllllll}
\hline
Summary of computational transaction \tabularnewline
Raw Input & view raw input (R code)  \tabularnewline
Raw Output & view raw output of R engine  \tabularnewline
Computing time & 7 seconds \tabularnewline
R Server & 'Herman Ole Andreas Wold' @ 193.190.124.10:1001 \tabularnewline
\hline
\end{tabular}
%Source: https://freestatistics.org/blog/index.php?pk=25473&T=0

[TABLE]
[ROW][C]Summary of computational transaction[/C][/ROW]
[ROW][C]Raw Input[/C][C]view raw input (R code) [/C][/ROW]
[ROW][C]Raw Output[/C][C]view raw output of R engine [/C][/ROW]
[ROW][C]Computing time[/C][C]7 seconds[/C][/ROW]
[ROW][C]R Server[/C][C]'Herman Ole Andreas Wold' @ 193.190.124.10:1001[/C][/ROW]
[/TABLE]
Source: https://freestatistics.org/blog/index.php?pk=25473&T=0

Globally Unique Identifier (entire table): ba.freestatistics.org/blog/index.php?pk=25473&T=0

As an alternative you can also use a QR Code:  

The GUIDs for individual cells are displayed in the table below:

Summary of computational transaction
Raw Inputview raw input (R code)
Raw Outputview raw output of R engine
Computing time7 seconds
R Server'Herman Ole Andreas Wold' @ 193.190.124.10:1001


Multiple Linear Regression - Estimated Regression Equation
y[t] = + 8.1675925925926 -1.46916666666667x[t] -0.302765652557318M1[t] -0.553018077601411M2[t] -0.607675264550264M3[t] -0.700784832451499M4[t] -0.108180114638448M5[t] -0.0298611111111110M6[t] -0.0372563932980598M7[t] -0.120418871252205M8[t] -0.211147486772487M9[t] -0.101876102292769M10[t] + 0.0573952821869489M11[t] + 0.00739528218694884t + e[t]

\begin{tabular}{lllllllll}
\hline
Multiple Linear Regression - Estimated Regression Equation \tabularnewline
y[t] =  +  8.1675925925926 -1.46916666666667x[t] -0.302765652557318M1[t] -0.553018077601411M2[t] -0.607675264550264M3[t] -0.700784832451499M4[t] -0.108180114638448M5[t] -0.0298611111111110M6[t] -0.0372563932980598M7[t] -0.120418871252205M8[t] -0.211147486772487M9[t] -0.101876102292769M10[t] +  0.0573952821869489M11[t] +  0.00739528218694884t  + e[t] \tabularnewline
\hline
\end{tabular}
%Source: https://freestatistics.org/blog/index.php?pk=25473&T=1

[TABLE]
[ROW][C]Multiple Linear Regression - Estimated Regression Equation[/C][/ROW]
[ROW][C]y[t] =  +  8.1675925925926 -1.46916666666667x[t] -0.302765652557318M1[t] -0.553018077601411M2[t] -0.607675264550264M3[t] -0.700784832451499M4[t] -0.108180114638448M5[t] -0.0298611111111110M6[t] -0.0372563932980598M7[t] -0.120418871252205M8[t] -0.211147486772487M9[t] -0.101876102292769M10[t] +  0.0573952821869489M11[t] +  0.00739528218694884t  + e[t][/C][/ROW]
[/TABLE]
Source: https://freestatistics.org/blog/index.php?pk=25473&T=1

Globally Unique Identifier (entire table): ba.freestatistics.org/blog/index.php?pk=25473&T=1

As an alternative you can also use a QR Code:  

The GUIDs for individual cells are displayed in the table below:

Multiple Linear Regression - Estimated Regression Equation
y[t] = + 8.1675925925926 -1.46916666666667x[t] -0.302765652557318M1[t] -0.553018077601411M2[t] -0.607675264550264M3[t] -0.700784832451499M4[t] -0.108180114638448M5[t] -0.0298611111111110M6[t] -0.0372563932980598M7[t] -0.120418871252205M8[t] -0.211147486772487M9[t] -0.101876102292769M10[t] + 0.0573952821869489M11[t] + 0.00739528218694884t + e[t]


Multiple Linear Regression - Ordinary Least Squares
VariableParameterS.D.T-STATH0: parameter = 02-tail p-value1-tail p-value
(Intercept)8.16759259259260.21130238.653600
x-1.469166666666670.174296-8.429200
M1-0.3027656525573180.244681-1.23740.2203940.110197
M2-0.5530180776014110.24454-2.26150.0270830.013542
M3-0.6076752645502640.245961-2.47060.016120.00806
M4-0.7007848324514990.245675-2.85250.0058110.002905
M5-0.1081801146384480.245427-0.44080.6608330.330416
M6-0.02986111111111100.245219-0.12180.9034540.451727
M7-0.03725639329805980.24505-0.1520.879630.439815
M8-0.1204188712522050.253869-0.47430.636850.318425
M9-0.2111474867724870.253735-0.83220.4083670.204183
M10-0.1018761022927690.253639-0.40170.6892540.344627
M110.05739528218694890.2535820.22630.8216490.410824
t0.007395282186948840.0031132.37550.0204830.010242

\begin{tabular}{lllllllll}
\hline
Multiple Linear Regression - Ordinary Least Squares \tabularnewline
Variable & Parameter & S.D. & T-STATH0: parameter = 0 & 2-tail p-value & 1-tail p-value \tabularnewline
(Intercept) & 8.1675925925926 & 0.211302 & 38.6536 & 0 & 0 \tabularnewline
x & -1.46916666666667 & 0.174296 & -8.4292 & 0 & 0 \tabularnewline
M1 & -0.302765652557318 & 0.244681 & -1.2374 & 0.220394 & 0.110197 \tabularnewline
M2 & -0.553018077601411 & 0.24454 & -2.2615 & 0.027083 & 0.013542 \tabularnewline
M3 & -0.607675264550264 & 0.245961 & -2.4706 & 0.01612 & 0.00806 \tabularnewline
M4 & -0.700784832451499 & 0.245675 & -2.8525 & 0.005811 & 0.002905 \tabularnewline
M5 & -0.108180114638448 & 0.245427 & -0.4408 & 0.660833 & 0.330416 \tabularnewline
M6 & -0.0298611111111110 & 0.245219 & -0.1218 & 0.903454 & 0.451727 \tabularnewline
M7 & -0.0372563932980598 & 0.24505 & -0.152 & 0.87963 & 0.439815 \tabularnewline
M8 & -0.120418871252205 & 0.253869 & -0.4743 & 0.63685 & 0.318425 \tabularnewline
M9 & -0.211147486772487 & 0.253735 & -0.8322 & 0.408367 & 0.204183 \tabularnewline
M10 & -0.101876102292769 & 0.253639 & -0.4017 & 0.689254 & 0.344627 \tabularnewline
M11 & 0.0573952821869489 & 0.253582 & 0.2263 & 0.821649 & 0.410824 \tabularnewline
t & 0.00739528218694884 & 0.003113 & 2.3755 & 0.020483 & 0.010242 \tabularnewline
\hline
\end{tabular}
%Source: https://freestatistics.org/blog/index.php?pk=25473&T=2

[TABLE]
[ROW][C]Multiple Linear Regression - Ordinary Least Squares[/C][/ROW]
[ROW][C]Variable[/C][C]Parameter[/C][C]S.D.[/C][C]T-STATH0: parameter = 0[/C][C]2-tail p-value[/C][C]1-tail p-value[/C][/ROW]
[ROW][C](Intercept)[/C][C]8.1675925925926[/C][C]0.211302[/C][C]38.6536[/C][C]0[/C][C]0[/C][/ROW]
[ROW][C]x[/C][C]-1.46916666666667[/C][C]0.174296[/C][C]-8.4292[/C][C]0[/C][C]0[/C][/ROW]
[ROW][C]M1[/C][C]-0.302765652557318[/C][C]0.244681[/C][C]-1.2374[/C][C]0.220394[/C][C]0.110197[/C][/ROW]
[ROW][C]M2[/C][C]-0.553018077601411[/C][C]0.24454[/C][C]-2.2615[/C][C]0.027083[/C][C]0.013542[/C][/ROW]
[ROW][C]M3[/C][C]-0.607675264550264[/C][C]0.245961[/C][C]-2.4706[/C][C]0.01612[/C][C]0.00806[/C][/ROW]
[ROW][C]M4[/C][C]-0.700784832451499[/C][C]0.245675[/C][C]-2.8525[/C][C]0.005811[/C][C]0.002905[/C][/ROW]
[ROW][C]M5[/C][C]-0.108180114638448[/C][C]0.245427[/C][C]-0.4408[/C][C]0.660833[/C][C]0.330416[/C][/ROW]
[ROW][C]M6[/C][C]-0.0298611111111110[/C][C]0.245219[/C][C]-0.1218[/C][C]0.903454[/C][C]0.451727[/C][/ROW]
[ROW][C]M7[/C][C]-0.0372563932980598[/C][C]0.24505[/C][C]-0.152[/C][C]0.87963[/C][C]0.439815[/C][/ROW]
[ROW][C]M8[/C][C]-0.120418871252205[/C][C]0.253869[/C][C]-0.4743[/C][C]0.63685[/C][C]0.318425[/C][/ROW]
[ROW][C]M9[/C][C]-0.211147486772487[/C][C]0.253735[/C][C]-0.8322[/C][C]0.408367[/C][C]0.204183[/C][/ROW]
[ROW][C]M10[/C][C]-0.101876102292769[/C][C]0.253639[/C][C]-0.4017[/C][C]0.689254[/C][C]0.344627[/C][/ROW]
[ROW][C]M11[/C][C]0.0573952821869489[/C][C]0.253582[/C][C]0.2263[/C][C]0.821649[/C][C]0.410824[/C][/ROW]
[ROW][C]t[/C][C]0.00739528218694884[/C][C]0.003113[/C][C]2.3755[/C][C]0.020483[/C][C]0.010242[/C][/ROW]
[/TABLE]
Source: https://freestatistics.org/blog/index.php?pk=25473&T=2

Globally Unique Identifier (entire table): ba.freestatistics.org/blog/index.php?pk=25473&T=2

As an alternative you can also use a QR Code:  

The GUIDs for individual cells are displayed in the table below:

Multiple Linear Regression - Ordinary Least Squares
VariableParameterS.D.T-STATH0: parameter = 02-tail p-value1-tail p-value
(Intercept)8.16759259259260.21130238.653600
x-1.469166666666670.174296-8.429200
M1-0.3027656525573180.244681-1.23740.2203940.110197
M2-0.5530180776014110.24454-2.26150.0270830.013542
M3-0.6076752645502640.245961-2.47060.016120.00806
M4-0.7007848324514990.245675-2.85250.0058110.002905
M5-0.1081801146384480.245427-0.44080.6608330.330416
M6-0.02986111111111100.245219-0.12180.9034540.451727
M7-0.03725639329805980.24505-0.1520.879630.439815
M8-0.1204188712522050.253869-0.47430.636850.318425
M9-0.2111474867724870.253735-0.83220.4083670.204183
M10-0.1018761022927690.253639-0.40170.6892540.344627
M110.05739528218694890.2535820.22630.8216490.410824
t0.007395282186948840.0031132.37550.0204830.010242


Multiple Linear Regression - Regression Statistics
Multiple R0.818150968119422
R-squared0.669371006634748
Adjusted R-squared0.603245207961698
F-TEST (value)10.1226906905784
F-TEST (DF numerator)13
F-TEST (DF denominator)65
p-value3.44609896174575e-11
Multiple Linear Regression - Residual Statistics
Residual Standard Deviation0.439183993768649
Sum Squared Residuals12.5373677248677

\begin{tabular}{lllllllll}
\hline
Multiple Linear Regression - Regression Statistics \tabularnewline
Multiple R & 0.818150968119422 \tabularnewline
R-squared & 0.669371006634748 \tabularnewline
Adjusted R-squared & 0.603245207961698 \tabularnewline
F-TEST (value) & 10.1226906905784 \tabularnewline
F-TEST (DF numerator) & 13 \tabularnewline
F-TEST (DF denominator) & 65 \tabularnewline
p-value & 3.44609896174575e-11 \tabularnewline
Multiple Linear Regression - Residual Statistics \tabularnewline
Residual Standard Deviation & 0.439183993768649 \tabularnewline
Sum Squared Residuals & 12.5373677248677 \tabularnewline
\hline
\end{tabular}
%Source: https://freestatistics.org/blog/index.php?pk=25473&T=3

[TABLE]
[ROW][C]Multiple Linear Regression - Regression Statistics[/C][/ROW]
[ROW][C]Multiple R[/C][C]0.818150968119422[/C][/ROW]
[ROW][C]R-squared[/C][C]0.669371006634748[/C][/ROW]
[ROW][C]Adjusted R-squared[/C][C]0.603245207961698[/C][/ROW]
[ROW][C]F-TEST (value)[/C][C]10.1226906905784[/C][/ROW]
[ROW][C]F-TEST (DF numerator)[/C][C]13[/C][/ROW]
[ROW][C]F-TEST (DF denominator)[/C][C]65[/C][/ROW]
[ROW][C]p-value[/C][C]3.44609896174575e-11[/C][/ROW]
[ROW][C]Multiple Linear Regression - Residual Statistics[/C][/ROW]
[ROW][C]Residual Standard Deviation[/C][C]0.439183993768649[/C][/ROW]
[ROW][C]Sum Squared Residuals[/C][C]12.5373677248677[/C][/ROW]
[/TABLE]
Source: https://freestatistics.org/blog/index.php?pk=25473&T=3

Globally Unique Identifier (entire table): ba.freestatistics.org/blog/index.php?pk=25473&T=3

As an alternative you can also use a QR Code:  

The GUIDs for individual cells are displayed in the table below:

Multiple Linear Regression - Regression Statistics
Multiple R0.818150968119422
R-squared0.669371006634748
Adjusted R-squared0.603245207961698
F-TEST (value)10.1226906905784
F-TEST (DF numerator)13
F-TEST (DF denominator)65
p-value3.44609896174575e-11
Multiple Linear Regression - Residual Statistics
Residual Standard Deviation0.439183993768649
Sum Squared Residuals12.5373677248677


Multiple Linear Regression - Actuals, Interpolation, and Residuals
Time or IndexActualsInterpolationForecastResidualsPrediction Error
17.37.87222222222222-0.572222222222218
27.17.62936507936508-0.529365079365079
36.97.58210317460317-0.682103174603174
46.87.49638888888889-0.696388888888889
57.58.09638888888889-0.596388888888889
67.68.18210317460317-0.582103174603175
77.88.18210317460317-0.382103174603175
888.10633597883598-0.106335978835979
98.18.023002645502650.0769973544973538
108.28.139669312169310.060330687830687
118.38.30633597883598-0.00633597883597844
128.28.25633597883598-0.0563359788359797
1387.960965608465610.0390343915343907
147.97.718108465608470.181891534391534
157.67.67084656084656-0.0708465608465614
167.67.585132275132270.0148677248677245
178.28.185132275132280.0148677248677242
188.38.270846560846560.0291534391534395
198.48.270846560846560.129153439153439
208.48.195079365079370.204920634920635
218.48.111746031746030.288253968253969
228.68.22841269841270.371587301587301
238.98.395079365079360.504920634920635
248.88.345079365079370.454920634920635
258.38.0497089947090.250291005291005
267.57.80685185185185-0.306851851851852
277.27.75958994708995-0.559589947089947
287.57.67387566137566-0.173875661375661
298.88.273875661375660.52612433862434
309.38.359589947089950.940410052910054
319.38.359589947089950.940410052910054
328.78.283822751322750.416177248677248
338.28.20048941798942-0.000489417989418698
348.38.31715608465609-0.0171560846560841
358.58.483822751322750.0161772486772487
368.68.433822751322750.166177248677248
378.68.138452380952380.461547619047618
388.27.895595238095240.304404761904761
398.17.848333333333330.251666666666666
4087.762619047619050.237380952380953
418.68.362619047619050.237380952380952
428.78.448333333333330.251666666666666
438.88.448333333333330.351666666666667
448.58.372566137566140.127433862433863
458.48.28923280423280.110767195767196
468.58.405899470899470.0941005291005292
478.78.572566137566140.127433862433862
488.78.522566137566140.177433862433862
498.68.227195767195770.372804232804232
508.57.984338624338620.515661375661376
518.37.937076719576720.362923280423281
528.17.851362433862430.248637566137566
538.28.45136243386243-0.251362433862434
548.18.53707671957672-0.43707671957672
558.18.53707671957672-0.43707671957672
567.98.46130952380952-0.561309523809523
577.98.37797619047619-0.47797619047619
587.98.49464285714286-0.594642857142857
5988.66130952380952-0.661309523809524
6088.61130952380952-0.611309523809524
617.98.31593915343915-0.415939153439153
6288.07308201058201-0.0730820105820103
637.76.556653439153441.14334656084656
647.26.470939153439150.729060846560847
657.57.070939153439150.429060846560847
667.37.156653439153440.143346560846561
6777.15665343915344-0.156653439153439
6877.08088624338624-0.0808862433862434
6976.997552910052910.00244708994709005
707.27.114219576719580.0857804232804234
717.37.280886243386240.0191137566137566
727.17.23088624338624-0.130886243386244
736.86.93551587301587-0.135515873015874
746.66.69265873015873-0.0926587301587303
756.26.64539682539683-0.445396825396825
766.26.55968253968254-0.359682539682539
776.87.15968253968254-0.359682539682539
786.97.24539682539683-0.345396825396825
796.87.24539682539683-0.445396825396826

\begin{tabular}{lllllllll}
\hline
Multiple Linear Regression - Actuals, Interpolation, and Residuals \tabularnewline
Time or Index & Actuals & InterpolationForecast & ResidualsPrediction Error \tabularnewline
1 & 7.3 & 7.87222222222222 & -0.572222222222218 \tabularnewline
2 & 7.1 & 7.62936507936508 & -0.529365079365079 \tabularnewline
3 & 6.9 & 7.58210317460317 & -0.682103174603174 \tabularnewline
4 & 6.8 & 7.49638888888889 & -0.696388888888889 \tabularnewline
5 & 7.5 & 8.09638888888889 & -0.596388888888889 \tabularnewline
6 & 7.6 & 8.18210317460317 & -0.582103174603175 \tabularnewline
7 & 7.8 & 8.18210317460317 & -0.382103174603175 \tabularnewline
8 & 8 & 8.10633597883598 & -0.106335978835979 \tabularnewline
9 & 8.1 & 8.02300264550265 & 0.0769973544973538 \tabularnewline
10 & 8.2 & 8.13966931216931 & 0.060330687830687 \tabularnewline
11 & 8.3 & 8.30633597883598 & -0.00633597883597844 \tabularnewline
12 & 8.2 & 8.25633597883598 & -0.0563359788359797 \tabularnewline
13 & 8 & 7.96096560846561 & 0.0390343915343907 \tabularnewline
14 & 7.9 & 7.71810846560847 & 0.181891534391534 \tabularnewline
15 & 7.6 & 7.67084656084656 & -0.0708465608465614 \tabularnewline
16 & 7.6 & 7.58513227513227 & 0.0148677248677245 \tabularnewline
17 & 8.2 & 8.18513227513228 & 0.0148677248677242 \tabularnewline
18 & 8.3 & 8.27084656084656 & 0.0291534391534395 \tabularnewline
19 & 8.4 & 8.27084656084656 & 0.129153439153439 \tabularnewline
20 & 8.4 & 8.19507936507937 & 0.204920634920635 \tabularnewline
21 & 8.4 & 8.11174603174603 & 0.288253968253969 \tabularnewline
22 & 8.6 & 8.2284126984127 & 0.371587301587301 \tabularnewline
23 & 8.9 & 8.39507936507936 & 0.504920634920635 \tabularnewline
24 & 8.8 & 8.34507936507937 & 0.454920634920635 \tabularnewline
25 & 8.3 & 8.049708994709 & 0.250291005291005 \tabularnewline
26 & 7.5 & 7.80685185185185 & -0.306851851851852 \tabularnewline
27 & 7.2 & 7.75958994708995 & -0.559589947089947 \tabularnewline
28 & 7.5 & 7.67387566137566 & -0.173875661375661 \tabularnewline
29 & 8.8 & 8.27387566137566 & 0.52612433862434 \tabularnewline
30 & 9.3 & 8.35958994708995 & 0.940410052910054 \tabularnewline
31 & 9.3 & 8.35958994708995 & 0.940410052910054 \tabularnewline
32 & 8.7 & 8.28382275132275 & 0.416177248677248 \tabularnewline
33 & 8.2 & 8.20048941798942 & -0.000489417989418698 \tabularnewline
34 & 8.3 & 8.31715608465609 & -0.0171560846560841 \tabularnewline
35 & 8.5 & 8.48382275132275 & 0.0161772486772487 \tabularnewline
36 & 8.6 & 8.43382275132275 & 0.166177248677248 \tabularnewline
37 & 8.6 & 8.13845238095238 & 0.461547619047618 \tabularnewline
38 & 8.2 & 7.89559523809524 & 0.304404761904761 \tabularnewline
39 & 8.1 & 7.84833333333333 & 0.251666666666666 \tabularnewline
40 & 8 & 7.76261904761905 & 0.237380952380953 \tabularnewline
41 & 8.6 & 8.36261904761905 & 0.237380952380952 \tabularnewline
42 & 8.7 & 8.44833333333333 & 0.251666666666666 \tabularnewline
43 & 8.8 & 8.44833333333333 & 0.351666666666667 \tabularnewline
44 & 8.5 & 8.37256613756614 & 0.127433862433863 \tabularnewline
45 & 8.4 & 8.2892328042328 & 0.110767195767196 \tabularnewline
46 & 8.5 & 8.40589947089947 & 0.0941005291005292 \tabularnewline
47 & 8.7 & 8.57256613756614 & 0.127433862433862 \tabularnewline
48 & 8.7 & 8.52256613756614 & 0.177433862433862 \tabularnewline
49 & 8.6 & 8.22719576719577 & 0.372804232804232 \tabularnewline
50 & 8.5 & 7.98433862433862 & 0.515661375661376 \tabularnewline
51 & 8.3 & 7.93707671957672 & 0.362923280423281 \tabularnewline
52 & 8.1 & 7.85136243386243 & 0.248637566137566 \tabularnewline
53 & 8.2 & 8.45136243386243 & -0.251362433862434 \tabularnewline
54 & 8.1 & 8.53707671957672 & -0.43707671957672 \tabularnewline
55 & 8.1 & 8.53707671957672 & -0.43707671957672 \tabularnewline
56 & 7.9 & 8.46130952380952 & -0.561309523809523 \tabularnewline
57 & 7.9 & 8.37797619047619 & -0.47797619047619 \tabularnewline
58 & 7.9 & 8.49464285714286 & -0.594642857142857 \tabularnewline
59 & 8 & 8.66130952380952 & -0.661309523809524 \tabularnewline
60 & 8 & 8.61130952380952 & -0.611309523809524 \tabularnewline
61 & 7.9 & 8.31593915343915 & -0.415939153439153 \tabularnewline
62 & 8 & 8.07308201058201 & -0.0730820105820103 \tabularnewline
63 & 7.7 & 6.55665343915344 & 1.14334656084656 \tabularnewline
64 & 7.2 & 6.47093915343915 & 0.729060846560847 \tabularnewline
65 & 7.5 & 7.07093915343915 & 0.429060846560847 \tabularnewline
66 & 7.3 & 7.15665343915344 & 0.143346560846561 \tabularnewline
67 & 7 & 7.15665343915344 & -0.156653439153439 \tabularnewline
68 & 7 & 7.08088624338624 & -0.0808862433862434 \tabularnewline
69 & 7 & 6.99755291005291 & 0.00244708994709005 \tabularnewline
70 & 7.2 & 7.11421957671958 & 0.0857804232804234 \tabularnewline
71 & 7.3 & 7.28088624338624 & 0.0191137566137566 \tabularnewline
72 & 7.1 & 7.23088624338624 & -0.130886243386244 \tabularnewline
73 & 6.8 & 6.93551587301587 & -0.135515873015874 \tabularnewline
74 & 6.6 & 6.69265873015873 & -0.0926587301587303 \tabularnewline
75 & 6.2 & 6.64539682539683 & -0.445396825396825 \tabularnewline
76 & 6.2 & 6.55968253968254 & -0.359682539682539 \tabularnewline
77 & 6.8 & 7.15968253968254 & -0.359682539682539 \tabularnewline
78 & 6.9 & 7.24539682539683 & -0.345396825396825 \tabularnewline
79 & 6.8 & 7.24539682539683 & -0.445396825396826 \tabularnewline
\hline
\end{tabular}
%Source: https://freestatistics.org/blog/index.php?pk=25473&T=4

[TABLE]
[ROW][C]Multiple Linear Regression - Actuals, Interpolation, and Residuals[/C][/ROW]
[ROW][C]Time or Index[/C][C]Actuals[/C][C]InterpolationForecast[/C][C]ResidualsPrediction Error[/C][/ROW]
[ROW][C]1[/C][C]7.3[/C][C]7.87222222222222[/C][C]-0.572222222222218[/C][/ROW]
[ROW][C]2[/C][C]7.1[/C][C]7.62936507936508[/C][C]-0.529365079365079[/C][/ROW]
[ROW][C]3[/C][C]6.9[/C][C]7.58210317460317[/C][C]-0.682103174603174[/C][/ROW]
[ROW][C]4[/C][C]6.8[/C][C]7.49638888888889[/C][C]-0.696388888888889[/C][/ROW]
[ROW][C]5[/C][C]7.5[/C][C]8.09638888888889[/C][C]-0.596388888888889[/C][/ROW]
[ROW][C]6[/C][C]7.6[/C][C]8.18210317460317[/C][C]-0.582103174603175[/C][/ROW]
[ROW][C]7[/C][C]7.8[/C][C]8.18210317460317[/C][C]-0.382103174603175[/C][/ROW]
[ROW][C]8[/C][C]8[/C][C]8.10633597883598[/C][C]-0.106335978835979[/C][/ROW]
[ROW][C]9[/C][C]8.1[/C][C]8.02300264550265[/C][C]0.0769973544973538[/C][/ROW]
[ROW][C]10[/C][C]8.2[/C][C]8.13966931216931[/C][C]0.060330687830687[/C][/ROW]
[ROW][C]11[/C][C]8.3[/C][C]8.30633597883598[/C][C]-0.00633597883597844[/C][/ROW]
[ROW][C]12[/C][C]8.2[/C][C]8.25633597883598[/C][C]-0.0563359788359797[/C][/ROW]
[ROW][C]13[/C][C]8[/C][C]7.96096560846561[/C][C]0.0390343915343907[/C][/ROW]
[ROW][C]14[/C][C]7.9[/C][C]7.71810846560847[/C][C]0.181891534391534[/C][/ROW]
[ROW][C]15[/C][C]7.6[/C][C]7.67084656084656[/C][C]-0.0708465608465614[/C][/ROW]
[ROW][C]16[/C][C]7.6[/C][C]7.58513227513227[/C][C]0.0148677248677245[/C][/ROW]
[ROW][C]17[/C][C]8.2[/C][C]8.18513227513228[/C][C]0.0148677248677242[/C][/ROW]
[ROW][C]18[/C][C]8.3[/C][C]8.27084656084656[/C][C]0.0291534391534395[/C][/ROW]
[ROW][C]19[/C][C]8.4[/C][C]8.27084656084656[/C][C]0.129153439153439[/C][/ROW]
[ROW][C]20[/C][C]8.4[/C][C]8.19507936507937[/C][C]0.204920634920635[/C][/ROW]
[ROW][C]21[/C][C]8.4[/C][C]8.11174603174603[/C][C]0.288253968253969[/C][/ROW]
[ROW][C]22[/C][C]8.6[/C][C]8.2284126984127[/C][C]0.371587301587301[/C][/ROW]
[ROW][C]23[/C][C]8.9[/C][C]8.39507936507936[/C][C]0.504920634920635[/C][/ROW]
[ROW][C]24[/C][C]8.8[/C][C]8.34507936507937[/C][C]0.454920634920635[/C][/ROW]
[ROW][C]25[/C][C]8.3[/C][C]8.049708994709[/C][C]0.250291005291005[/C][/ROW]
[ROW][C]26[/C][C]7.5[/C][C]7.80685185185185[/C][C]-0.306851851851852[/C][/ROW]
[ROW][C]27[/C][C]7.2[/C][C]7.75958994708995[/C][C]-0.559589947089947[/C][/ROW]
[ROW][C]28[/C][C]7.5[/C][C]7.67387566137566[/C][C]-0.173875661375661[/C][/ROW]
[ROW][C]29[/C][C]8.8[/C][C]8.27387566137566[/C][C]0.52612433862434[/C][/ROW]
[ROW][C]30[/C][C]9.3[/C][C]8.35958994708995[/C][C]0.940410052910054[/C][/ROW]
[ROW][C]31[/C][C]9.3[/C][C]8.35958994708995[/C][C]0.940410052910054[/C][/ROW]
[ROW][C]32[/C][C]8.7[/C][C]8.28382275132275[/C][C]0.416177248677248[/C][/ROW]
[ROW][C]33[/C][C]8.2[/C][C]8.20048941798942[/C][C]-0.000489417989418698[/C][/ROW]
[ROW][C]34[/C][C]8.3[/C][C]8.31715608465609[/C][C]-0.0171560846560841[/C][/ROW]
[ROW][C]35[/C][C]8.5[/C][C]8.48382275132275[/C][C]0.0161772486772487[/C][/ROW]
[ROW][C]36[/C][C]8.6[/C][C]8.43382275132275[/C][C]0.166177248677248[/C][/ROW]
[ROW][C]37[/C][C]8.6[/C][C]8.13845238095238[/C][C]0.461547619047618[/C][/ROW]
[ROW][C]38[/C][C]8.2[/C][C]7.89559523809524[/C][C]0.304404761904761[/C][/ROW]
[ROW][C]39[/C][C]8.1[/C][C]7.84833333333333[/C][C]0.251666666666666[/C][/ROW]
[ROW][C]40[/C][C]8[/C][C]7.76261904761905[/C][C]0.237380952380953[/C][/ROW]
[ROW][C]41[/C][C]8.6[/C][C]8.36261904761905[/C][C]0.237380952380952[/C][/ROW]
[ROW][C]42[/C][C]8.7[/C][C]8.44833333333333[/C][C]0.251666666666666[/C][/ROW]
[ROW][C]43[/C][C]8.8[/C][C]8.44833333333333[/C][C]0.351666666666667[/C][/ROW]
[ROW][C]44[/C][C]8.5[/C][C]8.37256613756614[/C][C]0.127433862433863[/C][/ROW]
[ROW][C]45[/C][C]8.4[/C][C]8.2892328042328[/C][C]0.110767195767196[/C][/ROW]
[ROW][C]46[/C][C]8.5[/C][C]8.40589947089947[/C][C]0.0941005291005292[/C][/ROW]
[ROW][C]47[/C][C]8.7[/C][C]8.57256613756614[/C][C]0.127433862433862[/C][/ROW]
[ROW][C]48[/C][C]8.7[/C][C]8.52256613756614[/C][C]0.177433862433862[/C][/ROW]
[ROW][C]49[/C][C]8.6[/C][C]8.22719576719577[/C][C]0.372804232804232[/C][/ROW]
[ROW][C]50[/C][C]8.5[/C][C]7.98433862433862[/C][C]0.515661375661376[/C][/ROW]
[ROW][C]51[/C][C]8.3[/C][C]7.93707671957672[/C][C]0.362923280423281[/C][/ROW]
[ROW][C]52[/C][C]8.1[/C][C]7.85136243386243[/C][C]0.248637566137566[/C][/ROW]
[ROW][C]53[/C][C]8.2[/C][C]8.45136243386243[/C][C]-0.251362433862434[/C][/ROW]
[ROW][C]54[/C][C]8.1[/C][C]8.53707671957672[/C][C]-0.43707671957672[/C][/ROW]
[ROW][C]55[/C][C]8.1[/C][C]8.53707671957672[/C][C]-0.43707671957672[/C][/ROW]
[ROW][C]56[/C][C]7.9[/C][C]8.46130952380952[/C][C]-0.561309523809523[/C][/ROW]
[ROW][C]57[/C][C]7.9[/C][C]8.37797619047619[/C][C]-0.47797619047619[/C][/ROW]
[ROW][C]58[/C][C]7.9[/C][C]8.49464285714286[/C][C]-0.594642857142857[/C][/ROW]
[ROW][C]59[/C][C]8[/C][C]8.66130952380952[/C][C]-0.661309523809524[/C][/ROW]
[ROW][C]60[/C][C]8[/C][C]8.61130952380952[/C][C]-0.611309523809524[/C][/ROW]
[ROW][C]61[/C][C]7.9[/C][C]8.31593915343915[/C][C]-0.415939153439153[/C][/ROW]
[ROW][C]62[/C][C]8[/C][C]8.07308201058201[/C][C]-0.0730820105820103[/C][/ROW]
[ROW][C]63[/C][C]7.7[/C][C]6.55665343915344[/C][C]1.14334656084656[/C][/ROW]
[ROW][C]64[/C][C]7.2[/C][C]6.47093915343915[/C][C]0.729060846560847[/C][/ROW]
[ROW][C]65[/C][C]7.5[/C][C]7.07093915343915[/C][C]0.429060846560847[/C][/ROW]
[ROW][C]66[/C][C]7.3[/C][C]7.15665343915344[/C][C]0.143346560846561[/C][/ROW]
[ROW][C]67[/C][C]7[/C][C]7.15665343915344[/C][C]-0.156653439153439[/C][/ROW]
[ROW][C]68[/C][C]7[/C][C]7.08088624338624[/C][C]-0.0808862433862434[/C][/ROW]
[ROW][C]69[/C][C]7[/C][C]6.99755291005291[/C][C]0.00244708994709005[/C][/ROW]
[ROW][C]70[/C][C]7.2[/C][C]7.11421957671958[/C][C]0.0857804232804234[/C][/ROW]
[ROW][C]71[/C][C]7.3[/C][C]7.28088624338624[/C][C]0.0191137566137566[/C][/ROW]
[ROW][C]72[/C][C]7.1[/C][C]7.23088624338624[/C][C]-0.130886243386244[/C][/ROW]
[ROW][C]73[/C][C]6.8[/C][C]6.93551587301587[/C][C]-0.135515873015874[/C][/ROW]
[ROW][C]74[/C][C]6.6[/C][C]6.69265873015873[/C][C]-0.0926587301587303[/C][/ROW]
[ROW][C]75[/C][C]6.2[/C][C]6.64539682539683[/C][C]-0.445396825396825[/C][/ROW]
[ROW][C]76[/C][C]6.2[/C][C]6.55968253968254[/C][C]-0.359682539682539[/C][/ROW]
[ROW][C]77[/C][C]6.8[/C][C]7.15968253968254[/C][C]-0.359682539682539[/C][/ROW]
[ROW][C]78[/C][C]6.9[/C][C]7.24539682539683[/C][C]-0.345396825396825[/C][/ROW]
[ROW][C]79[/C][C]6.8[/C][C]7.24539682539683[/C][C]-0.445396825396826[/C][/ROW]
[/TABLE]
Source: https://freestatistics.org/blog/index.php?pk=25473&T=4

Globally Unique Identifier (entire table): ba.freestatistics.org/blog/index.php?pk=25473&T=4

As an alternative you can also use a QR Code:  

The GUIDs for individual cells are displayed in the table below:

Multiple Linear Regression - Actuals, Interpolation, and Residuals
Time or IndexActualsInterpolationForecastResidualsPrediction Error
17.37.87222222222222-0.572222222222218
27.17.62936507936508-0.529365079365079
36.97.58210317460317-0.682103174603174
46.87.49638888888889-0.696388888888889
57.58.09638888888889-0.596388888888889
67.68.18210317460317-0.582103174603175
77.88.18210317460317-0.382103174603175
888.10633597883598-0.106335978835979
98.18.023002645502650.0769973544973538
108.28.139669312169310.060330687830687
118.38.30633597883598-0.00633597883597844
128.28.25633597883598-0.0563359788359797
1387.960965608465610.0390343915343907
147.97.718108465608470.181891534391534
157.67.67084656084656-0.0708465608465614
167.67.585132275132270.0148677248677245
178.28.185132275132280.0148677248677242
188.38.270846560846560.0291534391534395
198.48.270846560846560.129153439153439
208.48.195079365079370.204920634920635
218.48.111746031746030.288253968253969
228.68.22841269841270.371587301587301
238.98.395079365079360.504920634920635
248.88.345079365079370.454920634920635
258.38.0497089947090.250291005291005
267.57.80685185185185-0.306851851851852
277.27.75958994708995-0.559589947089947
287.57.67387566137566-0.173875661375661
298.88.273875661375660.52612433862434
309.38.359589947089950.940410052910054
319.38.359589947089950.940410052910054
328.78.283822751322750.416177248677248
338.28.20048941798942-0.000489417989418698
348.38.31715608465609-0.0171560846560841
358.58.483822751322750.0161772486772487
368.68.433822751322750.166177248677248
378.68.138452380952380.461547619047618
388.27.895595238095240.304404761904761
398.17.848333333333330.251666666666666
4087.762619047619050.237380952380953
418.68.362619047619050.237380952380952
428.78.448333333333330.251666666666666
438.88.448333333333330.351666666666667
448.58.372566137566140.127433862433863
458.48.28923280423280.110767195767196
468.58.405899470899470.0941005291005292
478.78.572566137566140.127433862433862
488.78.522566137566140.177433862433862
498.68.227195767195770.372804232804232
508.57.984338624338620.515661375661376
518.37.937076719576720.362923280423281
528.17.851362433862430.248637566137566
538.28.45136243386243-0.251362433862434
548.18.53707671957672-0.43707671957672
558.18.53707671957672-0.43707671957672
567.98.46130952380952-0.561309523809523
577.98.37797619047619-0.47797619047619
587.98.49464285714286-0.594642857142857
5988.66130952380952-0.661309523809524
6088.61130952380952-0.611309523809524
617.98.31593915343915-0.415939153439153
6288.07308201058201-0.0730820105820103
637.76.556653439153441.14334656084656
647.26.470939153439150.729060846560847
657.57.070939153439150.429060846560847
667.37.156653439153440.143346560846561
6777.15665343915344-0.156653439153439
6877.08088624338624-0.0808862433862434
6976.997552910052910.00244708994709005
707.27.114219576719580.0857804232804234
717.37.280886243386240.0191137566137566
727.17.23088624338624-0.130886243386244
736.86.93551587301587-0.135515873015874
746.66.69265873015873-0.0926587301587303
756.26.64539682539683-0.445396825396825
766.26.55968253968254-0.359682539682539
776.87.15968253968254-0.359682539682539
786.97.24539682539683-0.345396825396825
796.87.24539682539683-0.445396825396826


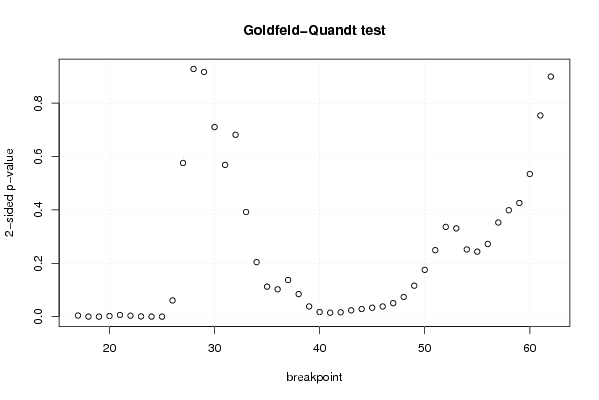
Goldfeld-Quandt test for Heteroskedasticity
p-valuesAlternative Hypothesis
breakpoint indexgreater2-sidedless
170.002269826000240610.004539652000481220.99773017399976
180.0002859879532277890.0005719759064555790.999714012046772
190.0001824634798662910.0003649269597325810.999817536520134
200.001321539265588400.002643078531176800.998678460734412
210.003282270486576680.006564540973153370.996717729513423
220.001941038595285660.003882077190571330.998058961404714
230.0006073840156977850.001214768031395570.999392615984302
240.0001782510195035470.0003565020390070940.999821748980496
250.0001648483094748210.0003296966189496430.999835151690525
260.03052767160548090.06105534321096190.969472328394519
270.2880974576977140.5761949153954290.711902542302286
280.4641898759253710.9283797518507420.535810124074629
290.4585752040696780.9171504081393560.541424795930322
300.6447367202072150.710526559585570.355263279792785
310.7154964767762560.5690070464474880.284503523223744
320.6590985275065650.681802944986870.340901472493435
330.8038456538368360.3923086923263290.196154346163164
340.8976893370481190.2046213259037620.102310662951881
350.9436002690834030.1127994618331940.056399730916597
360.9485348221384750.102930355723050.051465177861525
370.9312072240101680.1375855519796640.0687927759898319
380.9576229862378930.08475402752421470.0423770137621074
390.9807414926629160.03851701467416880.0192585073370844
400.9911096952819650.01778060943606960.00889030471803481
410.9924174056130480.01516518877390440.0075825943869522
420.9916848332227860.01663033355442700.00831516677721352
430.9879806781389260.0240386437221480.012019321861074
440.9855590044295360.02888199114092880.0144409955704644
450.9831258698850180.03374826022996410.0168741301149820
460.9807614807232110.03847703855357720.0192385192767886
470.9745685208909860.05086295821802720.0254314791090136
480.9629606797777250.07407864044454970.0370393202222748
490.9418382086609050.116323582678190.058161791339095
500.9121656663958160.1756686672083680.087834333604184
510.8753180493860560.2493639012278870.124681950613944
520.8316733925780030.3366532148439940.168326607421997
530.8345586359526810.3308827280946380.165441364047319
540.8739357327988440.2521285344023130.126064267201156
550.8780779911559550.243844017688090.121922008844045
560.8636157003937360.2727685992125270.136384299606264
570.8235138950081810.3529722099836380.176486104991819
580.8004528382690240.3990943234619520.199547161730976
590.7868904724083430.4262190551833150.213109527591657
600.7326110567993250.534777886401350.267388943200675
610.6229933758642210.7540132482715580.377006624135779
620.4498613162460510.8997226324921020.550138683753949

\begin{tabular}{lllllllll}
\hline
Goldfeld-Quandt test for Heteroskedasticity \tabularnewline
p-values & Alternative Hypothesis \tabularnewline
breakpoint index & greater & 2-sided & less \tabularnewline
17 & 0.00226982600024061 & 0.00453965200048122 & 0.99773017399976 \tabularnewline
18 & 0.000285987953227789 & 0.000571975906455579 & 0.999714012046772 \tabularnewline
19 & 0.000182463479866291 & 0.000364926959732581 & 0.999817536520134 \tabularnewline
20 & 0.00132153926558840 & 0.00264307853117680 & 0.998678460734412 \tabularnewline
21 & 0.00328227048657668 & 0.00656454097315337 & 0.996717729513423 \tabularnewline
22 & 0.00194103859528566 & 0.00388207719057133 & 0.998058961404714 \tabularnewline
23 & 0.000607384015697785 & 0.00121476803139557 & 0.999392615984302 \tabularnewline
24 & 0.000178251019503547 & 0.000356502039007094 & 0.999821748980496 \tabularnewline
25 & 0.000164848309474821 & 0.000329696618949643 & 0.999835151690525 \tabularnewline
26 & 0.0305276716054809 & 0.0610553432109619 & 0.969472328394519 \tabularnewline
27 & 0.288097457697714 & 0.576194915395429 & 0.711902542302286 \tabularnewline
28 & 0.464189875925371 & 0.928379751850742 & 0.535810124074629 \tabularnewline
29 & 0.458575204069678 & 0.917150408139356 & 0.541424795930322 \tabularnewline
30 & 0.644736720207215 & 0.71052655958557 & 0.355263279792785 \tabularnewline
31 & 0.715496476776256 & 0.569007046447488 & 0.284503523223744 \tabularnewline
32 & 0.659098527506565 & 0.68180294498687 & 0.340901472493435 \tabularnewline
33 & 0.803845653836836 & 0.392308692326329 & 0.196154346163164 \tabularnewline
34 & 0.897689337048119 & 0.204621325903762 & 0.102310662951881 \tabularnewline
35 & 0.943600269083403 & 0.112799461833194 & 0.056399730916597 \tabularnewline
36 & 0.948534822138475 & 0.10293035572305 & 0.051465177861525 \tabularnewline
37 & 0.931207224010168 & 0.137585551979664 & 0.0687927759898319 \tabularnewline
38 & 0.957622986237893 & 0.0847540275242147 & 0.0423770137621074 \tabularnewline
39 & 0.980741492662916 & 0.0385170146741688 & 0.0192585073370844 \tabularnewline
40 & 0.991109695281965 & 0.0177806094360696 & 0.00889030471803481 \tabularnewline
41 & 0.992417405613048 & 0.0151651887739044 & 0.0075825943869522 \tabularnewline
42 & 0.991684833222786 & 0.0166303335544270 & 0.00831516677721352 \tabularnewline
43 & 0.987980678138926 & 0.024038643722148 & 0.012019321861074 \tabularnewline
44 & 0.985559004429536 & 0.0288819911409288 & 0.0144409955704644 \tabularnewline
45 & 0.983125869885018 & 0.0337482602299641 & 0.0168741301149820 \tabularnewline
46 & 0.980761480723211 & 0.0384770385535772 & 0.0192385192767886 \tabularnewline
47 & 0.974568520890986 & 0.0508629582180272 & 0.0254314791090136 \tabularnewline
48 & 0.962960679777725 & 0.0740786404445497 & 0.0370393202222748 \tabularnewline
49 & 0.941838208660905 & 0.11632358267819 & 0.058161791339095 \tabularnewline
50 & 0.912165666395816 & 0.175668667208368 & 0.087834333604184 \tabularnewline
51 & 0.875318049386056 & 0.249363901227887 & 0.124681950613944 \tabularnewline
52 & 0.831673392578003 & 0.336653214843994 & 0.168326607421997 \tabularnewline
53 & 0.834558635952681 & 0.330882728094638 & 0.165441364047319 \tabularnewline
54 & 0.873935732798844 & 0.252128534402313 & 0.126064267201156 \tabularnewline
55 & 0.878077991155955 & 0.24384401768809 & 0.121922008844045 \tabularnewline
56 & 0.863615700393736 & 0.272768599212527 & 0.136384299606264 \tabularnewline
57 & 0.823513895008181 & 0.352972209983638 & 0.176486104991819 \tabularnewline
58 & 0.800452838269024 & 0.399094323461952 & 0.199547161730976 \tabularnewline
59 & 0.786890472408343 & 0.426219055183315 & 0.213109527591657 \tabularnewline
60 & 0.732611056799325 & 0.53477788640135 & 0.267388943200675 \tabularnewline
61 & 0.622993375864221 & 0.754013248271558 & 0.377006624135779 \tabularnewline
62 & 0.449861316246051 & 0.899722632492102 & 0.550138683753949 \tabularnewline
\hline
\end{tabular}
%Source: https://freestatistics.org/blog/index.php?pk=25473&T=5

[TABLE]
[ROW][C]Goldfeld-Quandt test for Heteroskedasticity[/C][/ROW]
[ROW][C]p-values[/C][C]Alternative Hypothesis[/C][/ROW]
[ROW][C]breakpoint index[/C][C]greater[/C][C]2-sided[/C][C]less[/C][/ROW]
[ROW][C]17[/C][C]0.00226982600024061[/C][C]0.00453965200048122[/C][C]0.99773017399976[/C][/ROW]
[ROW][C]18[/C][C]0.000285987953227789[/C][C]0.000571975906455579[/C][C]0.999714012046772[/C][/ROW]
[ROW][C]19[/C][C]0.000182463479866291[/C][C]0.000364926959732581[/C][C]0.999817536520134[/C][/ROW]
[ROW][C]20[/C][C]0.00132153926558840[/C][C]0.00264307853117680[/C][C]0.998678460734412[/C][/ROW]
[ROW][C]21[/C][C]0.00328227048657668[/C][C]0.00656454097315337[/C][C]0.996717729513423[/C][/ROW]
[ROW][C]22[/C][C]0.00194103859528566[/C][C]0.00388207719057133[/C][C]0.998058961404714[/C][/ROW]
[ROW][C]23[/C][C]0.000607384015697785[/C][C]0.00121476803139557[/C][C]0.999392615984302[/C][/ROW]
[ROW][C]24[/C][C]0.000178251019503547[/C][C]0.000356502039007094[/C][C]0.999821748980496[/C][/ROW]
[ROW][C]25[/C][C]0.000164848309474821[/C][C]0.000329696618949643[/C][C]0.999835151690525[/C][/ROW]
[ROW][C]26[/C][C]0.0305276716054809[/C][C]0.0610553432109619[/C][C]0.969472328394519[/C][/ROW]
[ROW][C]27[/C][C]0.288097457697714[/C][C]0.576194915395429[/C][C]0.711902542302286[/C][/ROW]
[ROW][C]28[/C][C]0.464189875925371[/C][C]0.928379751850742[/C][C]0.535810124074629[/C][/ROW]
[ROW][C]29[/C][C]0.458575204069678[/C][C]0.917150408139356[/C][C]0.541424795930322[/C][/ROW]
[ROW][C]30[/C][C]0.644736720207215[/C][C]0.71052655958557[/C][C]0.355263279792785[/C][/ROW]
[ROW][C]31[/C][C]0.715496476776256[/C][C]0.569007046447488[/C][C]0.284503523223744[/C][/ROW]
[ROW][C]32[/C][C]0.659098527506565[/C][C]0.68180294498687[/C][C]0.340901472493435[/C][/ROW]
[ROW][C]33[/C][C]0.803845653836836[/C][C]0.392308692326329[/C][C]0.196154346163164[/C][/ROW]
[ROW][C]34[/C][C]0.897689337048119[/C][C]0.204621325903762[/C][C]0.102310662951881[/C][/ROW]
[ROW][C]35[/C][C]0.943600269083403[/C][C]0.112799461833194[/C][C]0.056399730916597[/C][/ROW]
[ROW][C]36[/C][C]0.948534822138475[/C][C]0.10293035572305[/C][C]0.051465177861525[/C][/ROW]
[ROW][C]37[/C][C]0.931207224010168[/C][C]0.137585551979664[/C][C]0.0687927759898319[/C][/ROW]
[ROW][C]38[/C][C]0.957622986237893[/C][C]0.0847540275242147[/C][C]0.0423770137621074[/C][/ROW]
[ROW][C]39[/C][C]0.980741492662916[/C][C]0.0385170146741688[/C][C]0.0192585073370844[/C][/ROW]
[ROW][C]40[/C][C]0.991109695281965[/C][C]0.0177806094360696[/C][C]0.00889030471803481[/C][/ROW]
[ROW][C]41[/C][C]0.992417405613048[/C][C]0.0151651887739044[/C][C]0.0075825943869522[/C][/ROW]
[ROW][C]42[/C][C]0.991684833222786[/C][C]0.0166303335544270[/C][C]0.00831516677721352[/C][/ROW]
[ROW][C]43[/C][C]0.987980678138926[/C][C]0.024038643722148[/C][C]0.012019321861074[/C][/ROW]
[ROW][C]44[/C][C]0.985559004429536[/C][C]0.0288819911409288[/C][C]0.0144409955704644[/C][/ROW]
[ROW][C]45[/C][C]0.983125869885018[/C][C]0.0337482602299641[/C][C]0.0168741301149820[/C][/ROW]
[ROW][C]46[/C][C]0.980761480723211[/C][C]0.0384770385535772[/C][C]0.0192385192767886[/C][/ROW]
[ROW][C]47[/C][C]0.974568520890986[/C][C]0.0508629582180272[/C][C]0.0254314791090136[/C][/ROW]
[ROW][C]48[/C][C]0.962960679777725[/C][C]0.0740786404445497[/C][C]0.0370393202222748[/C][/ROW]
[ROW][C]49[/C][C]0.941838208660905[/C][C]0.11632358267819[/C][C]0.058161791339095[/C][/ROW]
[ROW][C]50[/C][C]0.912165666395816[/C][C]0.175668667208368[/C][C]0.087834333604184[/C][/ROW]
[ROW][C]51[/C][C]0.875318049386056[/C][C]0.249363901227887[/C][C]0.124681950613944[/C][/ROW]
[ROW][C]52[/C][C]0.831673392578003[/C][C]0.336653214843994[/C][C]0.168326607421997[/C][/ROW]
[ROW][C]53[/C][C]0.834558635952681[/C][C]0.330882728094638[/C][C]0.165441364047319[/C][/ROW]
[ROW][C]54[/C][C]0.873935732798844[/C][C]0.252128534402313[/C][C]0.126064267201156[/C][/ROW]
[ROW][C]55[/C][C]0.878077991155955[/C][C]0.24384401768809[/C][C]0.121922008844045[/C][/ROW]
[ROW][C]56[/C][C]0.863615700393736[/C][C]0.272768599212527[/C][C]0.136384299606264[/C][/ROW]
[ROW][C]57[/C][C]0.823513895008181[/C][C]0.352972209983638[/C][C]0.176486104991819[/C][/ROW]
[ROW][C]58[/C][C]0.800452838269024[/C][C]0.399094323461952[/C][C]0.199547161730976[/C][/ROW]
[ROW][C]59[/C][C]0.786890472408343[/C][C]0.426219055183315[/C][C]0.213109527591657[/C][/ROW]
[ROW][C]60[/C][C]0.732611056799325[/C][C]0.53477788640135[/C][C]0.267388943200675[/C][/ROW]
[ROW][C]61[/C][C]0.622993375864221[/C][C]0.754013248271558[/C][C]0.377006624135779[/C][/ROW]
[ROW][C]62[/C][C]0.449861316246051[/C][C]0.899722632492102[/C][C]0.550138683753949[/C][/ROW]
[/TABLE]
Source: https://freestatistics.org/blog/index.php?pk=25473&T=5

Globally Unique Identifier (entire table): ba.freestatistics.org/blog/index.php?pk=25473&T=5

As an alternative you can also use a QR Code:  

The GUIDs for individual cells are displayed in the table below:

Goldfeld-Quandt test for Heteroskedasticity
p-valuesAlternative Hypothesis
breakpoint indexgreater2-sidedless
170.002269826000240610.004539652000481220.99773017399976
180.0002859879532277890.0005719759064555790.999714012046772
190.0001824634798662910.0003649269597325810.999817536520134
200.001321539265588400.002643078531176800.998678460734412
210.003282270486576680.006564540973153370.996717729513423
220.001941038595285660.003882077190571330.998058961404714
230.0006073840156977850.001214768031395570.999392615984302
240.0001782510195035470.0003565020390070940.999821748980496
250.0001648483094748210.0003296966189496430.999835151690525
260.03052767160548090.06105534321096190.969472328394519
270.2880974576977140.5761949153954290.711902542302286
280.4641898759253710.9283797518507420.535810124074629
290.4585752040696780.9171504081393560.541424795930322
300.6447367202072150.710526559585570.355263279792785
310.7154964767762560.5690070464474880.284503523223744
320.6590985275065650.681802944986870.340901472493435
330.8038456538368360.3923086923263290.196154346163164
340.8976893370481190.2046213259037620.102310662951881
350.9436002690834030.1127994618331940.056399730916597
360.9485348221384750.102930355723050.051465177861525
370.9312072240101680.1375855519796640.0687927759898319
380.9576229862378930.08475402752421470.0423770137621074
390.9807414926629160.03851701467416880.0192585073370844
400.9911096952819650.01778060943606960.00889030471803481
410.9924174056130480.01516518877390440.0075825943869522
420.9916848332227860.01663033355442700.00831516677721352
430.9879806781389260.0240386437221480.012019321861074
440.9855590044295360.02888199114092880.0144409955704644
450.9831258698850180.03374826022996410.0168741301149820
460.9807614807232110.03847703855357720.0192385192767886
470.9745685208909860.05086295821802720.0254314791090136
480.9629606797777250.07407864044454970.0370393202222748
490.9418382086609050.116323582678190.058161791339095
500.9121656663958160.1756686672083680.087834333604184
510.8753180493860560.2493639012278870.124681950613944
520.8316733925780030.3366532148439940.168326607421997
530.8345586359526810.3308827280946380.165441364047319
540.8739357327988440.2521285344023130.126064267201156
550.8780779911559550.243844017688090.121922008844045
560.8636157003937360.2727685992125270.136384299606264
570.8235138950081810.3529722099836380.176486104991819
580.8004528382690240.3990943234619520.199547161730976
590.7868904724083430.4262190551833150.213109527591657
600.7326110567993250.534777886401350.267388943200675
610.6229933758642210.7540132482715580.377006624135779
620.4498613162460510.8997226324921020.550138683753949


Meta Analysis of Goldfeld-Quandt test for Heteroskedasticity
Description# significant tests% significant testsOK/NOK
1% type I error level90.195652173913043NOK
5% type I error level170.369565217391304NOK
10% type I error level210.456521739130435NOK

\begin{tabular}{lllllllll}
\hline
Meta Analysis of Goldfeld-Quandt test for Heteroskedasticity \tabularnewline
Description & # significant tests & % significant tests & OK/NOK \tabularnewline
1% type I error level & 9 & 0.195652173913043 & NOK \tabularnewline
5% type I error level & 17 & 0.369565217391304 & NOK \tabularnewline
10% type I error level & 21 & 0.456521739130435 & NOK \tabularnewline
\hline
\end{tabular}
%Source: https://freestatistics.org/blog/index.php?pk=25473&T=6

[TABLE]
[ROW][C]Meta Analysis of Goldfeld-Quandt test for Heteroskedasticity[/C][/ROW]
[ROW][C]Description[/C][C]# significant tests[/C][C]% significant tests[/C][C]OK/NOK[/C][/ROW]
[ROW][C]1% type I error level[/C][C]9[/C][C]0.195652173913043[/C][C]NOK[/C][/ROW]
[ROW][C]5% type I error level[/C][C]17[/C][C]0.369565217391304[/C][C]NOK[/C][/ROW]
[ROW][C]10% type I error level[/C][C]21[/C][C]0.456521739130435[/C][C]NOK[/C][/ROW]
[/TABLE]
Source: https://freestatistics.org/blog/index.php?pk=25473&T=6

Globally Unique Identifier (entire table): ba.freestatistics.org/blog/index.php?pk=25473&T=6

As an alternative you can also use a QR Code:  

The GUIDs for individual cells are displayed in the table below:

Meta Analysis of Goldfeld-Quandt test for Heteroskedasticity
Description# significant tests% significant testsOK/NOK
1% type I error level90.195652173913043NOK
5% type I error level170.369565217391304NOK
10% type I error level210.456521739130435NOK


Parameters (Session):
par1 = 1 ; par2 = Include Monthly Dummies ; par3 = Linear Trend ;
Parameters (R input):
par1 = 1 ; par2 = Include Monthly Dummies ; par3 = Linear Trend ;
R code (references can be found in the software module):
library(lattice)
library(lmtest)
n25 <- 25 #minimum number of obs. for Goldfeld-Quandt test
par1 <- as.numeric(par1)
x <- t(y)
k <- length(x[1,])
n <- length(x[,1])
x1 <- cbind(x[,par1], x[,1:k!=par1])
mycolnames <- c(colnames(x)[par1], colnames(x)[1:k!=par1])
colnames(x1) <- mycolnames #colnames(x)[par1]
x <- x1
if (par3 == 'First Differences'){
x2 <- array(0, dim=c(n-1,k), dimnames=list(1:(n-1), paste('(1-B)',colnames(x),sep='')))
for (i in 1:n-1) {
for (j in 1:k) {
x2[i,j] <- x[i+1,j] - x[i,j]
}
}
x <- x2
}
if (par2 == 'Include Monthly Dummies'){
x2 <- array(0, dim=c(n,11), dimnames=list(1:n, paste('M', seq(1:11), sep ='')))
for (i in 1:11){
x2[seq(i,n,12),i] <- 1
}
x <- cbind(x, x2)
}
if (par2 == 'Include Quarterly Dummies'){
x2 <- array(0, dim=c(n,3), dimnames=list(1:n, paste('Q', seq(1:3), sep ='')))
for (i in 1:3){
x2[seq(i,n,4),i] <- 1
}
x <- cbind(x, x2)
}
k <- length(x[1,])
if (par3 == 'Linear Trend'){
x <- cbind(x, c(1:n))
colnames(x)[k+1] <- 't'
}
x
k <- length(x[1,])
df <- as.data.frame(x)
(mylm <- lm(df))
(mysum <- summary(mylm))
if (n > n25) {
kp3 <- k + 3
nmkm3 <- n - k - 3
gqarr <- array(NA, dim=c(nmkm3-kp3+1,3))
numgqtests <- 0
numsignificant1 <- 0
numsignificant5 <- 0
numsignificant10 <- 0
for (mypoint in kp3:nmkm3) {
j <- 0
numgqtests <- numgqtests + 1
for (myalt in c('greater', 'two.sided', 'less')) {
j <- j + 1
gqarr[mypoint-kp3+1,j] <- gqtest(mylm, point=mypoint, alternative=myalt)$p.value
}
if (gqarr[mypoint-kp3+1,2] < 0.01) numsignificant1 <- numsignificant1 + 1
if (gqarr[mypoint-kp3+1,2] < 0.05) numsignificant5 <- numsignificant5 + 1
if (gqarr[mypoint-kp3+1,2] < 0.10) numsignificant10 <- numsignificant10 + 1
}
gqarr
}
bitmap(file='test0.png')
plot(x[,1], type='l', main='Actuals and Interpolation', ylab='value of Actuals and Interpolation (dots)', xlab='time or index')
points(x[,1]-mysum$resid)
grid()
dev.off()
bitmap(file='test1.png')
plot(mysum$resid, type='b', pch=19, main='Residuals', ylab='value of Residuals', xlab='time or index')
grid()
dev.off()
bitmap(file='test2.png')
hist(mysum$resid, main='Residual Histogram', xlab='values of Residuals')
grid()
dev.off()
bitmap(file='test3.png')
densityplot(~mysum$resid,col='black',main='Residual Density Plot', xlab='values of Residuals')
dev.off()
bitmap(file='test4.png')
qqnorm(mysum$resid, main='Residual Normal Q-Q Plot')
qqline(mysum$resid)
grid()
dev.off()
(myerror <- as.ts(mysum$resid))
bitmap(file='test5.png')
dum <- cbind(lag(myerror,k=1),myerror)
dum
dum1 <- dum[2:length(myerror),]
dum1
z <- as.data.frame(dum1)
z
plot(z,main=paste('Residual Lag plot, lowess, and regression line'), ylab='values of Residuals', xlab='lagged values of Residuals')
lines(lowess(z))
abline(lm(z))
grid()
dev.off()
bitmap(file='test6.png')
acf(mysum$resid, lag.max=length(mysum$resid)/2, main='Residual Autocorrelation Function')
grid()
dev.off()
bitmap(file='test7.png')
pacf(mysum$resid, lag.max=length(mysum$resid)/2, main='Residual Partial Autocorrelation Function')
grid()
dev.off()
bitmap(file='test8.png')
opar <- par(mfrow = c(2,2), oma = c(0, 0, 1.1, 0))
plot(mylm, las = 1, sub='Residual Diagnostics')
par(opar)
dev.off()
if (n > n25) {
bitmap(file='test9.png')
plot(kp3:nmkm3,gqarr[,2], main='Goldfeld-Quandt test',ylab='2-sided p-value',xlab='breakpoint')
grid()
dev.off()
}
load(file='createtable')
a<-table.start()
a<-table.row.start(a)
a<-table.element(a, 'Multiple Linear Regression - Estimated Regression Equation', 1, TRUE)
a<-table.row.end(a)
myeq <- colnames(x)[1]
myeq <- paste(myeq, '[t] = ', sep='')
for (i in 1:k){
if (mysum$coefficients[i,1] > 0) myeq <- paste(myeq, '+', '')
myeq <- paste(myeq, mysum$coefficients[i,1], sep=' ')
if (rownames(mysum$coefficients)[i] != '(Intercept)') {
myeq <- paste(myeq, rownames(mysum$coefficients)[i], sep='')
if (rownames(mysum$coefficients)[i] != 't') myeq <- paste(myeq, '[t]', sep='')
}
}
myeq <- paste(myeq, ' + e[t]')
a<-table.row.start(a)
a<-table.element(a, myeq)
a<-table.row.end(a)
a<-table.end(a)
table.save(a,file='mytable1.tab')
a<-table.start()
a<-table.row.start(a)
a<-table.element(a,hyperlink('ols1.htm','Multiple Linear Regression - Ordinary Least Squares',''), 6, TRUE)
a<-table.row.end(a)
a<-table.row.start(a)
a<-table.element(a,'Variable',header=TRUE)
a<-table.element(a,'Parameter',header=TRUE)
a<-table.element(a,'S.D.',header=TRUE)
a<-table.element(a,'T-STAT
H0: parameter = 0',header=TRUE)
a<-table.element(a,'2-tail p-value',header=TRUE)
a<-table.element(a,'1-tail p-value',header=TRUE)
a<-table.row.end(a)
for (i in 1:k){
a<-table.row.start(a)
a<-table.element(a,rownames(mysum$coefficients)[i],header=TRUE)
a<-table.element(a,mysum$coefficients[i,1])
a<-table.element(a, round(mysum$coefficients[i,2],6))
a<-table.element(a, round(mysum$coefficients[i,3],4))
a<-table.element(a, round(mysum$coefficients[i,4],6))
a<-table.element(a, round(mysum$coefficients[i,4]/2,6))
a<-table.row.end(a)
}
a<-table.end(a)
table.save(a,file='mytable2.tab')
a<-table.start()
a<-table.row.start(a)
a<-table.element(a, 'Multiple Linear Regression - Regression Statistics', 2, TRUE)
a<-table.row.end(a)
a<-table.row.start(a)
a<-table.element(a, 'Multiple R',1,TRUE)
a<-table.element(a, sqrt(mysum$r.squared))
a<-table.row.end(a)
a<-table.row.start(a)
a<-table.element(a, 'R-squared',1,TRUE)
a<-table.element(a, mysum$r.squared)
a<-table.row.end(a)
a<-table.row.start(a)
a<-table.element(a, 'Adjusted R-squared',1,TRUE)
a<-table.element(a, mysum$adj.r.squared)
a<-table.row.end(a)
a<-table.row.start(a)
a<-table.element(a, 'F-TEST (value)',1,TRUE)
a<-table.element(a, mysum$fstatistic[1])
a<-table.row.end(a)
a<-table.row.start(a)
a<-table.element(a, 'F-TEST (DF numerator)',1,TRUE)
a<-table.element(a, mysum$fstatistic[2])
a<-table.row.end(a)
a<-table.row.start(a)
a<-table.element(a, 'F-TEST (DF denominator)',1,TRUE)
a<-table.element(a, mysum$fstatistic[3])
a<-table.row.end(a)
a<-table.row.start(a)
a<-table.element(a, 'p-value',1,TRUE)
a<-table.element(a, 1-pf(mysum$fstatistic[1],mysum$fstatistic[2],mysum$fstatistic[3]))
a<-table.row.end(a)
a<-table.row.start(a)
a<-table.element(a, 'Multiple Linear Regression - Residual Statistics', 2, TRUE)
a<-table.row.end(a)
a<-table.row.start(a)
a<-table.element(a, 'Residual Standard Deviation',1,TRUE)
a<-table.element(a, mysum$sigma)
a<-table.row.end(a)
a<-table.row.start(a)
a<-table.element(a, 'Sum Squared Residuals',1,TRUE)
a<-table.element(a, sum(myerror*myerror))
a<-table.row.end(a)
a<-table.end(a)
table.save(a,file='mytable3.tab')
a<-table.start()
a<-table.row.start(a)
a<-table.element(a, 'Multiple Linear Regression - Actuals, Interpolation, and Residuals', 4, TRUE)
a<-table.row.end(a)
a<-table.row.start(a)
a<-table.element(a, 'Time or Index', 1, TRUE)
a<-table.element(a, 'Actuals', 1, TRUE)
a<-table.element(a, 'Interpolation
Forecast', 1, TRUE)
a<-table.element(a, 'Residuals
Prediction Error', 1, TRUE)
a<-table.row.end(a)
for (i in 1:n) {
a<-table.row.start(a)
a<-table.element(a,i, 1, TRUE)
a<-table.element(a,x[i])
a<-table.element(a,x[i]-mysum$resid[i])
a<-table.element(a,mysum$resid[i])
a<-table.row.end(a)
}
a<-table.end(a)
table.save(a,file='mytable4.tab')
if (n > n25) {
a<-table.start()
a<-table.row.start(a)
a<-table.element(a,'Goldfeld-Quandt test for Heteroskedasticity',4,TRUE)
a<-table.row.end(a)
a<-table.row.start(a)
a<-table.element(a,'p-values',header=TRUE)
a<-table.element(a,'Alternative Hypothesis',3,header=TRUE)
a<-table.row.end(a)
a<-table.row.start(a)
a<-table.element(a,'breakpoint index',header=TRUE)
a<-table.element(a,'greater',header=TRUE)
a<-table.element(a,'2-sided',header=TRUE)
a<-table.element(a,'less',header=TRUE)
a<-table.row.end(a)
for (mypoint in kp3:nmkm3) {
a<-table.row.start(a)
a<-table.element(a,mypoint,header=TRUE)
a<-table.element(a,gqarr[mypoint-kp3+1,1])
a<-table.element(a,gqarr[mypoint-kp3+1,2])
a<-table.element(a,gqarr[mypoint-kp3+1,3])
a<-table.row.end(a)
}
a<-table.end(a)
table.save(a,file='mytable5.tab')
a<-table.start()
a<-table.row.start(a)
a<-table.element(a,'Meta Analysis of Goldfeld-Quandt test for Heteroskedasticity',4,TRUE)
a<-table.row.end(a)
a<-table.row.start(a)
a<-table.element(a,'Description',header=TRUE)
a<-table.element(a,'# significant tests',header=TRUE)
a<-table.element(a,'% significant tests',header=TRUE)
a<-table.element(a,'OK/NOK',header=TRUE)
a<-table.row.end(a)
a<-table.row.start(a)
a<-table.element(a,'1% type I error level',header=TRUE)
a<-table.element(a,numsignificant1)
a<-table.element(a,numsignificant1/numgqtests)
if (numsignificant1/numgqtests < 0.01) dum <- 'OK' else dum <- 'NOK'
a<-table.element(a,dum)
a<-table.row.end(a)
a<-table.row.start(a)
a<-table.element(a,'5% type I error level',header=TRUE)
a<-table.element(a,numsignificant5)
a<-table.element(a,numsignificant5/numgqtests)
if (numsignificant5/numgqtests < 0.05) dum <- 'OK' else dum <- 'NOK'
a<-table.element(a,dum)
a<-table.row.end(a)
a<-table.row.start(a)
a<-table.element(a,'10% type I error level',header=TRUE)
a<-table.element(a,numsignificant10)
a<-table.element(a,numsignificant10/numgqtests)
if (numsignificant10/numgqtests < 0.1) dum <- 'OK' else dum <- 'NOK'
a<-table.element(a,dum)
a<-table.row.end(a)
a<-table.end(a)
table.save(a,file='mytable6.tab')
}