Free Statistics

of Irreproducible Research!

Author's title

Author*The author of this computation has been verified*
R Software Modulerwasp_multipleregression.wasp
Title produced by softwareMultiple Regression
Date of computationMon, 24 Nov 2008 10:25:36 -0700
Cite this page as followsStatistical Computations at FreeStatistics.org, Office for Research Development and Education, URL https://freestatistics.org/blog/index.php?v=date/2008/Nov/24/t1227547709a2we7tychqn3xy9.htm/, Retrieved Mon, 13 May 2024 21:23:47 +0000
Statistical Computations at FreeStatistics.org, Office for Research Development and Education, URL https://freestatistics.org/blog/index.php?pk=25465, Retrieved Mon, 13 May 2024 21:23:47 +0000
QR Codes:

Original text written by user:
IsPrivate?No (this computation is public)
User-defined keywords
Estimated Impact169
Family? (F = Feedback message, R = changed R code, M = changed R Module, P = changed Parameters, D = changed Data)
F     [Multiple Regression] [Q1 ] [2008-11-16 11:57:38] [4396f984ebeab43316cd6baa88a4fd40]
F    D    [Multiple Regression] [Q3 ] [2008-11-24 17:25:36] [54ae75b68e6a45c6d55fa4235827d5b3] [Current]
Feedback Forum
2008-12-01 23:08:07 [Kristof Augustyns] [reply
Berekeningen werden juist gedaan en interpretatie is ook correct.
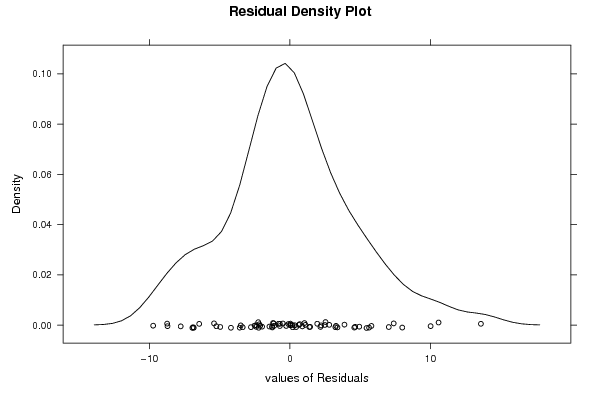
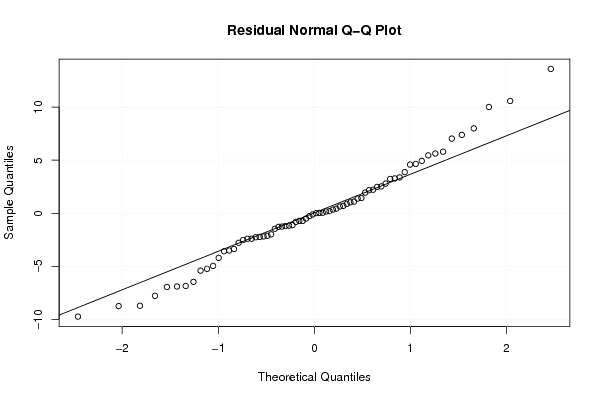
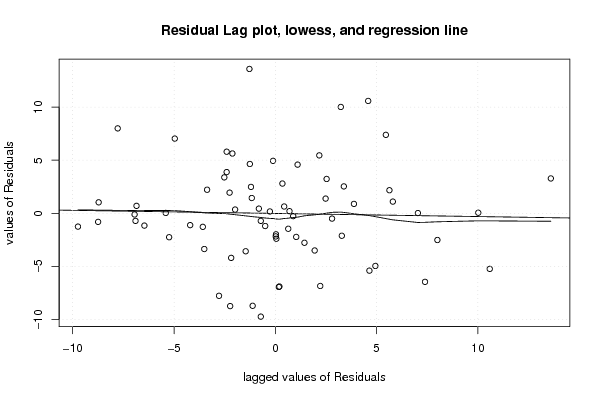
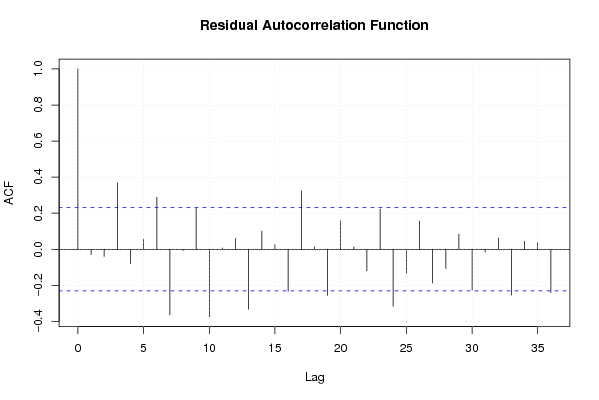
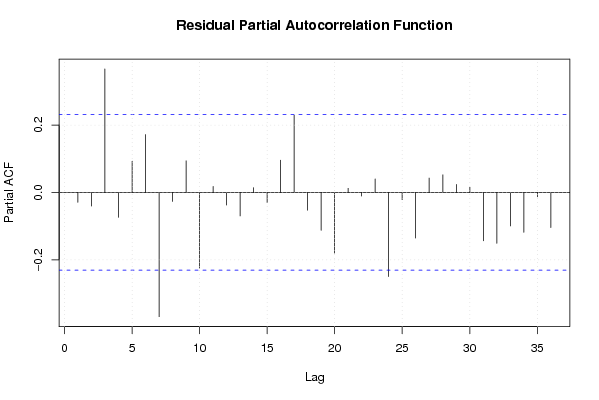
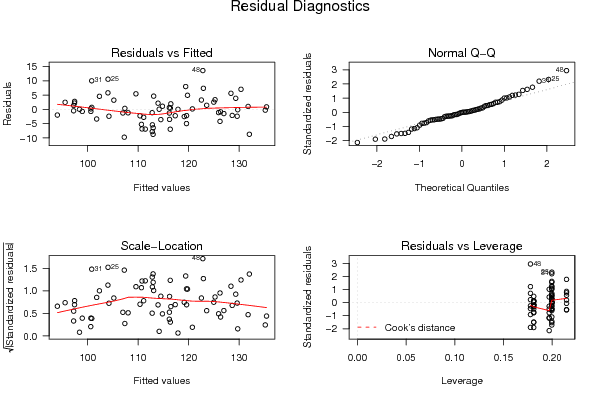
De bedoeling was om te controleren of het ging om een goed model, of er geen correlatie terug te vinden is en dat het gemiddelde constant is.
Dit is hier wel in de mate van het mogelijk correct gedaan.

Post a new message
Dataseries X:
98,6	0
98	0
106,8	0
96,7	0
100,2	0
107,7	0
92	0
98,4	0
107,4	0
117,7	0
105,7	0
97,5	0
99,9	0
98,2	0
104,5	0
100,8	0
101,5	0
103,9	0
99,6	0
98,4	0
112,7	0
118,4	0
108,1	0
105,4	0
114,6	0
106,9	0
115,9	0
109,8	0
101,8	0
114,2	0
110,8	0
108,4	0
127,5	1
128,6	1
116,6	1
127,4	1
105	1
108,3	1
125	1
111,6	1
106,5	1
130,3	1
115	1
116,1	1
134	1
126,5	1
125,8	1
136,4	1
114,9	1
110,9	1
125,5	1
116,8	1
116,8	1
125,5	1
104,2	1
115,1	1
132,8	1
123,3	1
124,8	1
122	1
117,4	1
117,9	1
137,4	1
114,6	1
124,7	1
129,6	1
109,4	1
120,9	1
134,9	1
136,3	1
133,2	1
127,2	1


Summary of computational transaction
Raw Inputview raw input (R code)
Raw Outputview raw output of R engine
Computing time6 seconds
R Server'Sir Ronald Aylmer Fisher' @ 193.190.124.24

\begin{tabular}{lllllllll}
\hline
Summary of computational transaction \tabularnewline
Raw Input & view raw input (R code)  \tabularnewline
Raw Output & view raw output of R engine  \tabularnewline
Computing time & 6 seconds \tabularnewline
R Server & 'Sir Ronald Aylmer Fisher' @ 193.190.124.24 \tabularnewline
\hline
\end{tabular}
%Source: https://freestatistics.org/blog/index.php?pk=25465&T=0

[TABLE]
[ROW][C]Summary of computational transaction[/C][/ROW]
[ROW][C]Raw Input[/C][C]view raw input (R code) [/C][/ROW]
[ROW][C]Raw Output[/C][C]view raw output of R engine [/C][/ROW]
[ROW][C]Computing time[/C][C]6 seconds[/C][/ROW]
[ROW][C]R Server[/C][C]'Sir Ronald Aylmer Fisher' @ 193.190.124.24[/C][/ROW]
[/TABLE]
Source: https://freestatistics.org/blog/index.php?pk=25465&T=0

Globally Unique Identifier (entire table): ba.freestatistics.org/blog/index.php?pk=25465&T=0

As an alternative you can also use a QR Code:  

The GUIDs for individual cells are displayed in the table below:

Summary of computational transaction
Raw Inputview raw input (R code)
Raw Outputview raw output of R engine
Computing time6 seconds
R Server'Sir Ronald Aylmer Fisher' @ 193.190.124.24


Multiple Linear Regression - Estimated Regression Equation
Y[t] = + 103.842307692308 + 5.36153846153846D[t] -6.90641025641023M1[t] -8.8897435897436M2[t] + 3.31025641025641M3[t] -7.77307692307693M4[t] -7.85641025641026M5[t] + 1.81025641025641M6[t] -11.8397435897436M7[t] -7.73974358974359M8[t] + 6.41666666666667M9[t] + 6.38333333333333M10[t] -6.2461389791266e-15M11[t] + 0.283333333333333t + e[t]

\begin{tabular}{lllllllll}
\hline
Multiple Linear Regression - Estimated Regression Equation \tabularnewline
Y[t] =  +  103.842307692308 +  5.36153846153846D[t] -6.90641025641023M1[t] -8.8897435897436M2[t] +  3.31025641025641M3[t] -7.77307692307693M4[t] -7.85641025641026M5[t] +  1.81025641025641M6[t] -11.8397435897436M7[t] -7.73974358974359M8[t] +  6.41666666666667M9[t] +  6.38333333333333M10[t] -6.2461389791266e-15M11[t] +  0.283333333333333t  + e[t] \tabularnewline
\hline
\end{tabular}
%Source: https://freestatistics.org/blog/index.php?pk=25465&T=1

[TABLE]
[ROW][C]Multiple Linear Regression - Estimated Regression Equation[/C][/ROW]
[ROW][C]Y[t] =  +  103.842307692308 +  5.36153846153846D[t] -6.90641025641023M1[t] -8.8897435897436M2[t] +  3.31025641025641M3[t] -7.77307692307693M4[t] -7.85641025641026M5[t] +  1.81025641025641M6[t] -11.8397435897436M7[t] -7.73974358974359M8[t] +  6.41666666666667M9[t] +  6.38333333333333M10[t] -6.2461389791266e-15M11[t] +  0.283333333333333t  + e[t][/C][/ROW]
[/TABLE]
Source: https://freestatistics.org/blog/index.php?pk=25465&T=1

Globally Unique Identifier (entire table): ba.freestatistics.org/blog/index.php?pk=25465&T=1

As an alternative you can also use a QR Code:  

The GUIDs for individual cells are displayed in the table below:

Multiple Linear Regression - Estimated Regression Equation
Y[t] = + 103.842307692308 + 5.36153846153846D[t] -6.90641025641023M1[t] -8.8897435897436M2[t] + 3.31025641025641M3[t] -7.77307692307693M4[t] -7.85641025641026M5[t] + 1.81025641025641M6[t] -11.8397435897436M7[t] -7.73974358974359M8[t] + 6.41666666666667M9[t] + 6.38333333333333M10[t] -6.2461389791266e-15M11[t] + 0.283333333333333t + e[t]


Multiple Linear Regression - Ordinary Least Squares
VariableParameterS.D.T-STATH0: parameter = 02-tail p-value1-tail p-value
(Intercept)103.8423076923082.4642242.1400
D5.361538461538462.4130542.22190.0302060.015103
M1-6.906410256410232.962447-2.33130.0232330.011616
M2-8.88974358974362.957373-3.0060.0039080.001954
M33.310256410256412.953421.12080.2669830.133492
M4-7.773076923076932.950593-2.63440.010790.005395
M5-7.856410256410262.948896-2.66420.0099760.004988
M61.810256410256412.948330.6140.541620.27081
M7-11.83974358974362.948896-4.0150.0001738.6e-05
M8-7.739743589743592.950593-2.62310.0111140.005557
M96.416666666666672.946372.17780.0334990.01675
M106.383333333333332.9435372.16860.0342280.017114
M11-6.2461389791266e-152.941836010.5
t0.2833333333333330.0577724.90438e-064e-06

\begin{tabular}{lllllllll}
\hline
Multiple Linear Regression - Ordinary Least Squares \tabularnewline
Variable & Parameter & S.D. & T-STATH0: parameter = 0 & 2-tail p-value & 1-tail p-value \tabularnewline
(Intercept) & 103.842307692308 & 2.46422 & 42.14 & 0 & 0 \tabularnewline
D & 5.36153846153846 & 2.413054 & 2.2219 & 0.030206 & 0.015103 \tabularnewline
M1 & -6.90641025641023 & 2.962447 & -2.3313 & 0.023233 & 0.011616 \tabularnewline
M2 & -8.8897435897436 & 2.957373 & -3.006 & 0.003908 & 0.001954 \tabularnewline
M3 & 3.31025641025641 & 2.95342 & 1.1208 & 0.266983 & 0.133492 \tabularnewline
M4 & -7.77307692307693 & 2.950593 & -2.6344 & 0.01079 & 0.005395 \tabularnewline
M5 & -7.85641025641026 & 2.948896 & -2.6642 & 0.009976 & 0.004988 \tabularnewline
M6 & 1.81025641025641 & 2.94833 & 0.614 & 0.54162 & 0.27081 \tabularnewline
M7 & -11.8397435897436 & 2.948896 & -4.015 & 0.000173 & 8.6e-05 \tabularnewline
M8 & -7.73974358974359 & 2.950593 & -2.6231 & 0.011114 & 0.005557 \tabularnewline
M9 & 6.41666666666667 & 2.94637 & 2.1778 & 0.033499 & 0.01675 \tabularnewline
M10 & 6.38333333333333 & 2.943537 & 2.1686 & 0.034228 & 0.017114 \tabularnewline
M11 & -6.2461389791266e-15 & 2.941836 & 0 & 1 & 0.5 \tabularnewline
t & 0.283333333333333 & 0.057772 & 4.9043 & 8e-06 & 4e-06 \tabularnewline
\hline
\end{tabular}
%Source: https://freestatistics.org/blog/index.php?pk=25465&T=2

[TABLE]
[ROW][C]Multiple Linear Regression - Ordinary Least Squares[/C][/ROW]
[ROW][C]Variable[/C][C]Parameter[/C][C]S.D.[/C][C]T-STATH0: parameter = 0[/C][C]2-tail p-value[/C][C]1-tail p-value[/C][/ROW]
[ROW][C](Intercept)[/C][C]103.842307692308[/C][C]2.46422[/C][C]42.14[/C][C]0[/C][C]0[/C][/ROW]
[ROW][C]D[/C][C]5.36153846153846[/C][C]2.413054[/C][C]2.2219[/C][C]0.030206[/C][C]0.015103[/C][/ROW]
[ROW][C]M1[/C][C]-6.90641025641023[/C][C]2.962447[/C][C]-2.3313[/C][C]0.023233[/C][C]0.011616[/C][/ROW]
[ROW][C]M2[/C][C]-8.8897435897436[/C][C]2.957373[/C][C]-3.006[/C][C]0.003908[/C][C]0.001954[/C][/ROW]
[ROW][C]M3[/C][C]3.31025641025641[/C][C]2.95342[/C][C]1.1208[/C][C]0.266983[/C][C]0.133492[/C][/ROW]
[ROW][C]M4[/C][C]-7.77307692307693[/C][C]2.950593[/C][C]-2.6344[/C][C]0.01079[/C][C]0.005395[/C][/ROW]
[ROW][C]M5[/C][C]-7.85641025641026[/C][C]2.948896[/C][C]-2.6642[/C][C]0.009976[/C][C]0.004988[/C][/ROW]
[ROW][C]M6[/C][C]1.81025641025641[/C][C]2.94833[/C][C]0.614[/C][C]0.54162[/C][C]0.27081[/C][/ROW]
[ROW][C]M7[/C][C]-11.8397435897436[/C][C]2.948896[/C][C]-4.015[/C][C]0.000173[/C][C]8.6e-05[/C][/ROW]
[ROW][C]M8[/C][C]-7.73974358974359[/C][C]2.950593[/C][C]-2.6231[/C][C]0.011114[/C][C]0.005557[/C][/ROW]
[ROW][C]M9[/C][C]6.41666666666667[/C][C]2.94637[/C][C]2.1778[/C][C]0.033499[/C][C]0.01675[/C][/ROW]
[ROW][C]M10[/C][C]6.38333333333333[/C][C]2.943537[/C][C]2.1686[/C][C]0.034228[/C][C]0.017114[/C][/ROW]
[ROW][C]M11[/C][C]-6.2461389791266e-15[/C][C]2.941836[/C][C]0[/C][C]1[/C][C]0.5[/C][/ROW]
[ROW][C]t[/C][C]0.283333333333333[/C][C]0.057772[/C][C]4.9043[/C][C]8e-06[/C][C]4e-06[/C][/ROW]
[/TABLE]
Source: https://freestatistics.org/blog/index.php?pk=25465&T=2

Globally Unique Identifier (entire table): ba.freestatistics.org/blog/index.php?pk=25465&T=2

As an alternative you can also use a QR Code:  

The GUIDs for individual cells are displayed in the table below:

Multiple Linear Regression - Ordinary Least Squares
VariableParameterS.D.T-STATH0: parameter = 02-tail p-value1-tail p-value
(Intercept)103.8423076923082.4642242.1400
D5.361538461538462.4130542.22190.0302060.015103
M1-6.906410256410232.962447-2.33130.0232330.011616
M2-8.88974358974362.957373-3.0060.0039080.001954
M33.310256410256412.953421.12080.2669830.133492
M4-7.773076923076932.950593-2.63440.010790.005395
M5-7.856410256410262.948896-2.66420.0099760.004988
M61.810256410256412.948330.6140.541620.27081
M7-11.83974358974362.948896-4.0150.0001738.6e-05
M8-7.739743589743592.950593-2.62310.0111140.005557
M96.416666666666672.946372.17780.0334990.01675
M106.383333333333332.9435372.16860.0342280.017114
M11-6.2461389791266e-152.941836010.5
t0.2833333333333330.0577724.90438e-064e-06


Multiple Linear Regression - Regression Statistics
Multiple R0.920304038737113
R-squared0.846959523715841
Adjusted R-squared0.812657347996978
F-TEST (value)24.6911312756785
F-TEST (DF numerator)13
F-TEST (DF denominator)58
p-value0
Multiple Linear Regression - Residual Statistics
Residual Standard Deviation5.09442622902778
Sum Squared Residuals1505.28435897436

\begin{tabular}{lllllllll}
\hline
Multiple Linear Regression - Regression Statistics \tabularnewline
Multiple R & 0.920304038737113 \tabularnewline
R-squared & 0.846959523715841 \tabularnewline
Adjusted R-squared & 0.812657347996978 \tabularnewline
F-TEST (value) & 24.6911312756785 \tabularnewline
F-TEST (DF numerator) & 13 \tabularnewline
F-TEST (DF denominator) & 58 \tabularnewline
p-value & 0 \tabularnewline
Multiple Linear Regression - Residual Statistics \tabularnewline
Residual Standard Deviation & 5.09442622902778 \tabularnewline
Sum Squared Residuals & 1505.28435897436 \tabularnewline
\hline
\end{tabular}
%Source: https://freestatistics.org/blog/index.php?pk=25465&T=3

[TABLE]
[ROW][C]Multiple Linear Regression - Regression Statistics[/C][/ROW]
[ROW][C]Multiple R[/C][C]0.920304038737113[/C][/ROW]
[ROW][C]R-squared[/C][C]0.846959523715841[/C][/ROW]
[ROW][C]Adjusted R-squared[/C][C]0.812657347996978[/C][/ROW]
[ROW][C]F-TEST (value)[/C][C]24.6911312756785[/C][/ROW]
[ROW][C]F-TEST (DF numerator)[/C][C]13[/C][/ROW]
[ROW][C]F-TEST (DF denominator)[/C][C]58[/C][/ROW]
[ROW][C]p-value[/C][C]0[/C][/ROW]
[ROW][C]Multiple Linear Regression - Residual Statistics[/C][/ROW]
[ROW][C]Residual Standard Deviation[/C][C]5.09442622902778[/C][/ROW]
[ROW][C]Sum Squared Residuals[/C][C]1505.28435897436[/C][/ROW]
[/TABLE]
Source: https://freestatistics.org/blog/index.php?pk=25465&T=3

Globally Unique Identifier (entire table): ba.freestatistics.org/blog/index.php?pk=25465&T=3

As an alternative you can also use a QR Code:  

The GUIDs for individual cells are displayed in the table below:

Multiple Linear Regression - Regression Statistics
Multiple R0.920304038737113
R-squared0.846959523715841
Adjusted R-squared0.812657347996978
F-TEST (value)24.6911312756785
F-TEST (DF numerator)13
F-TEST (DF denominator)58
p-value0
Multiple Linear Regression - Residual Statistics
Residual Standard Deviation5.09442622902778
Sum Squared Residuals1505.28435897436


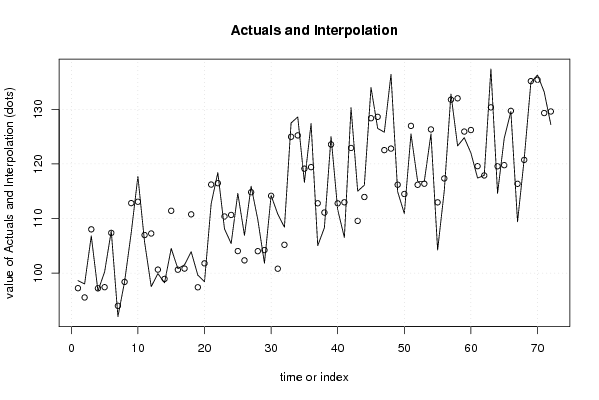
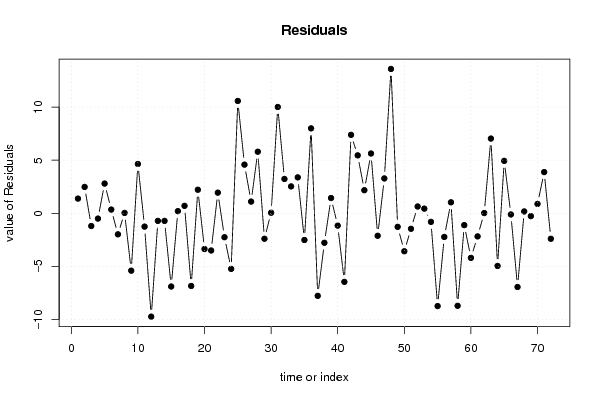
Multiple Linear Regression - Actuals, Interpolation, and Residuals
Time or IndexActualsInterpolationForecastResidualsPrediction Error
198.697.21923076923061.38076923076939
29895.51923076923082.48076923076922
3106.8108.002564102564-1.20256410256411
496.797.202564102564-0.502564102564097
5100.297.40256410256412.79743589743590
6107.7107.3525641025640.347435897435890
79293.9858974358974-1.98589743589744
898.498.36923076923080.0307692307692309
9107.4112.808974358974-5.40897435897437
10117.7113.0589743589744.64102564102563
11105.7106.958974358974-1.25897435897436
1297.5107.242307692308-9.7423076923077
1399.9100.619230769231-0.719230769230802
1498.298.9192307692308-0.719230769230773
15104.5111.402564102564-6.90256410256411
16100.8100.6025641025640.197435897435894
17101.5100.8025641025640.697435897435894
18103.9110.752564102564-6.8525641025641
1999.697.38589743589742.21410256410256
2098.4101.769230769231-3.36923076923077
21112.7116.208974358974-3.50897435897436
22118.4116.4589743589741.94102564102564
23108.1110.358974358974-2.25897435897436
24105.4110.642307692308-5.24230769230769
25114.6104.01923076923110.5807692307692
26106.9102.3192307692314.58076923076923
27115.9114.8025641025641.09743589743590
28109.8104.0025641025645.7974358974359
29101.8104.202564102564-2.40256410256411
30114.2114.1525641025640.0474358974358975
31110.8100.78589743589710.0141025641026
32108.4105.1692307692313.23076923076923
33127.5124.9705128205132.52948717948717
34128.6125.2205128205133.37948717948717
35116.6119.120512820513-2.52051282051283
36127.4119.4038461538467.99615384615385
37105112.780769230769-7.78076923076927
38108.3111.080769230769-2.78076923076924
39125123.5641025641031.43589743589743
40111.6112.764102564103-1.16410256410257
41106.5112.964102564103-6.46410256410257
42130.3122.9141025641037.38589743589745
43115109.5474358974365.4525641025641
44116.1113.9307692307692.16923076923076
45134128.3705128205135.62948717948718
46126.5128.620512820513-2.12051282051282
47125.8122.5205128205133.27948717948718
48136.4122.80384615384613.5961538461538
49114.9116.180769230769-1.28076923076926
50110.9114.480769230769-3.58076923076923
51125.5126.964102564103-1.46410256410256
52116.8116.1641025641030.635897435897439
53116.8116.3641025641030.435897435897437
54125.5126.314102564103-0.814102564102563
55104.2112.947435897436-8.74743589743589
56115.1117.330769230769-2.23076923076923
57132.8131.7705128205131.02948717948719
58123.3132.020512820513-8.72051282051282
59124.8125.920512820513-1.12051282051281
60122126.203846153846-4.20384615384615
61117.4119.580769230769-2.18076923076925
62117.9117.8807692307690.0192307692307785
63137.4130.3641025641037.03589743589745
64114.6119.564102564103-4.96410256410256
65124.7119.7641025641034.93589743589745
66129.6129.714102564103-0.114102564102566
67109.4116.347435897436-6.94743589743589
68120.9120.7307692307690.169230769230778
69134.9135.170512820513-0.270512820512813
70136.3135.4205128205130.879487179487195
71133.2129.3205128205133.87948717948718
72127.2129.603846153846-2.40384615384615

\begin{tabular}{lllllllll}
\hline
Multiple Linear Regression - Actuals, Interpolation, and Residuals \tabularnewline
Time or Index & Actuals & InterpolationForecast & ResidualsPrediction Error \tabularnewline
1 & 98.6 & 97.2192307692306 & 1.38076923076939 \tabularnewline
2 & 98 & 95.5192307692308 & 2.48076923076922 \tabularnewline
3 & 106.8 & 108.002564102564 & -1.20256410256411 \tabularnewline
4 & 96.7 & 97.202564102564 & -0.502564102564097 \tabularnewline
5 & 100.2 & 97.4025641025641 & 2.79743589743590 \tabularnewline
6 & 107.7 & 107.352564102564 & 0.347435897435890 \tabularnewline
7 & 92 & 93.9858974358974 & -1.98589743589744 \tabularnewline
8 & 98.4 & 98.3692307692308 & 0.0307692307692309 \tabularnewline
9 & 107.4 & 112.808974358974 & -5.40897435897437 \tabularnewline
10 & 117.7 & 113.058974358974 & 4.64102564102563 \tabularnewline
11 & 105.7 & 106.958974358974 & -1.25897435897436 \tabularnewline
12 & 97.5 & 107.242307692308 & -9.7423076923077 \tabularnewline
13 & 99.9 & 100.619230769231 & -0.719230769230802 \tabularnewline
14 & 98.2 & 98.9192307692308 & -0.719230769230773 \tabularnewline
15 & 104.5 & 111.402564102564 & -6.90256410256411 \tabularnewline
16 & 100.8 & 100.602564102564 & 0.197435897435894 \tabularnewline
17 & 101.5 & 100.802564102564 & 0.697435897435894 \tabularnewline
18 & 103.9 & 110.752564102564 & -6.8525641025641 \tabularnewline
19 & 99.6 & 97.3858974358974 & 2.21410256410256 \tabularnewline
20 & 98.4 & 101.769230769231 & -3.36923076923077 \tabularnewline
21 & 112.7 & 116.208974358974 & -3.50897435897436 \tabularnewline
22 & 118.4 & 116.458974358974 & 1.94102564102564 \tabularnewline
23 & 108.1 & 110.358974358974 & -2.25897435897436 \tabularnewline
24 & 105.4 & 110.642307692308 & -5.24230769230769 \tabularnewline
25 & 114.6 & 104.019230769231 & 10.5807692307692 \tabularnewline
26 & 106.9 & 102.319230769231 & 4.58076923076923 \tabularnewline
27 & 115.9 & 114.802564102564 & 1.09743589743590 \tabularnewline
28 & 109.8 & 104.002564102564 & 5.7974358974359 \tabularnewline
29 & 101.8 & 104.202564102564 & -2.40256410256411 \tabularnewline
30 & 114.2 & 114.152564102564 & 0.0474358974358975 \tabularnewline
31 & 110.8 & 100.785897435897 & 10.0141025641026 \tabularnewline
32 & 108.4 & 105.169230769231 & 3.23076923076923 \tabularnewline
33 & 127.5 & 124.970512820513 & 2.52948717948717 \tabularnewline
34 & 128.6 & 125.220512820513 & 3.37948717948717 \tabularnewline
35 & 116.6 & 119.120512820513 & -2.52051282051283 \tabularnewline
36 & 127.4 & 119.403846153846 & 7.99615384615385 \tabularnewline
37 & 105 & 112.780769230769 & -7.78076923076927 \tabularnewline
38 & 108.3 & 111.080769230769 & -2.78076923076924 \tabularnewline
39 & 125 & 123.564102564103 & 1.43589743589743 \tabularnewline
40 & 111.6 & 112.764102564103 & -1.16410256410257 \tabularnewline
41 & 106.5 & 112.964102564103 & -6.46410256410257 \tabularnewline
42 & 130.3 & 122.914102564103 & 7.38589743589745 \tabularnewline
43 & 115 & 109.547435897436 & 5.4525641025641 \tabularnewline
44 & 116.1 & 113.930769230769 & 2.16923076923076 \tabularnewline
45 & 134 & 128.370512820513 & 5.62948717948718 \tabularnewline
46 & 126.5 & 128.620512820513 & -2.12051282051282 \tabularnewline
47 & 125.8 & 122.520512820513 & 3.27948717948718 \tabularnewline
48 & 136.4 & 122.803846153846 & 13.5961538461538 \tabularnewline
49 & 114.9 & 116.180769230769 & -1.28076923076926 \tabularnewline
50 & 110.9 & 114.480769230769 & -3.58076923076923 \tabularnewline
51 & 125.5 & 126.964102564103 & -1.46410256410256 \tabularnewline
52 & 116.8 & 116.164102564103 & 0.635897435897439 \tabularnewline
53 & 116.8 & 116.364102564103 & 0.435897435897437 \tabularnewline
54 & 125.5 & 126.314102564103 & -0.814102564102563 \tabularnewline
55 & 104.2 & 112.947435897436 & -8.74743589743589 \tabularnewline
56 & 115.1 & 117.330769230769 & -2.23076923076923 \tabularnewline
57 & 132.8 & 131.770512820513 & 1.02948717948719 \tabularnewline
58 & 123.3 & 132.020512820513 & -8.72051282051282 \tabularnewline
59 & 124.8 & 125.920512820513 & -1.12051282051281 \tabularnewline
60 & 122 & 126.203846153846 & -4.20384615384615 \tabularnewline
61 & 117.4 & 119.580769230769 & -2.18076923076925 \tabularnewline
62 & 117.9 & 117.880769230769 & 0.0192307692307785 \tabularnewline
63 & 137.4 & 130.364102564103 & 7.03589743589745 \tabularnewline
64 & 114.6 & 119.564102564103 & -4.96410256410256 \tabularnewline
65 & 124.7 & 119.764102564103 & 4.93589743589745 \tabularnewline
66 & 129.6 & 129.714102564103 & -0.114102564102566 \tabularnewline
67 & 109.4 & 116.347435897436 & -6.94743589743589 \tabularnewline
68 & 120.9 & 120.730769230769 & 0.169230769230778 \tabularnewline
69 & 134.9 & 135.170512820513 & -0.270512820512813 \tabularnewline
70 & 136.3 & 135.420512820513 & 0.879487179487195 \tabularnewline
71 & 133.2 & 129.320512820513 & 3.87948717948718 \tabularnewline
72 & 127.2 & 129.603846153846 & -2.40384615384615 \tabularnewline
\hline
\end{tabular}
%Source: https://freestatistics.org/blog/index.php?pk=25465&T=4

[TABLE]
[ROW][C]Multiple Linear Regression - Actuals, Interpolation, and Residuals[/C][/ROW]
[ROW][C]Time or Index[/C][C]Actuals[/C][C]InterpolationForecast[/C][C]ResidualsPrediction Error[/C][/ROW]
[ROW][C]1[/C][C]98.6[/C][C]97.2192307692306[/C][C]1.38076923076939[/C][/ROW]
[ROW][C]2[/C][C]98[/C][C]95.5192307692308[/C][C]2.48076923076922[/C][/ROW]
[ROW][C]3[/C][C]106.8[/C][C]108.002564102564[/C][C]-1.20256410256411[/C][/ROW]
[ROW][C]4[/C][C]96.7[/C][C]97.202564102564[/C][C]-0.502564102564097[/C][/ROW]
[ROW][C]5[/C][C]100.2[/C][C]97.4025641025641[/C][C]2.79743589743590[/C][/ROW]
[ROW][C]6[/C][C]107.7[/C][C]107.352564102564[/C][C]0.347435897435890[/C][/ROW]
[ROW][C]7[/C][C]92[/C][C]93.9858974358974[/C][C]-1.98589743589744[/C][/ROW]
[ROW][C]8[/C][C]98.4[/C][C]98.3692307692308[/C][C]0.0307692307692309[/C][/ROW]
[ROW][C]9[/C][C]107.4[/C][C]112.808974358974[/C][C]-5.40897435897437[/C][/ROW]
[ROW][C]10[/C][C]117.7[/C][C]113.058974358974[/C][C]4.64102564102563[/C][/ROW]
[ROW][C]11[/C][C]105.7[/C][C]106.958974358974[/C][C]-1.25897435897436[/C][/ROW]
[ROW][C]12[/C][C]97.5[/C][C]107.242307692308[/C][C]-9.7423076923077[/C][/ROW]
[ROW][C]13[/C][C]99.9[/C][C]100.619230769231[/C][C]-0.719230769230802[/C][/ROW]
[ROW][C]14[/C][C]98.2[/C][C]98.9192307692308[/C][C]-0.719230769230773[/C][/ROW]
[ROW][C]15[/C][C]104.5[/C][C]111.402564102564[/C][C]-6.90256410256411[/C][/ROW]
[ROW][C]16[/C][C]100.8[/C][C]100.602564102564[/C][C]0.197435897435894[/C][/ROW]
[ROW][C]17[/C][C]101.5[/C][C]100.802564102564[/C][C]0.697435897435894[/C][/ROW]
[ROW][C]18[/C][C]103.9[/C][C]110.752564102564[/C][C]-6.8525641025641[/C][/ROW]
[ROW][C]19[/C][C]99.6[/C][C]97.3858974358974[/C][C]2.21410256410256[/C][/ROW]
[ROW][C]20[/C][C]98.4[/C][C]101.769230769231[/C][C]-3.36923076923077[/C][/ROW]
[ROW][C]21[/C][C]112.7[/C][C]116.208974358974[/C][C]-3.50897435897436[/C][/ROW]
[ROW][C]22[/C][C]118.4[/C][C]116.458974358974[/C][C]1.94102564102564[/C][/ROW]
[ROW][C]23[/C][C]108.1[/C][C]110.358974358974[/C][C]-2.25897435897436[/C][/ROW]
[ROW][C]24[/C][C]105.4[/C][C]110.642307692308[/C][C]-5.24230769230769[/C][/ROW]
[ROW][C]25[/C][C]114.6[/C][C]104.019230769231[/C][C]10.5807692307692[/C][/ROW]
[ROW][C]26[/C][C]106.9[/C][C]102.319230769231[/C][C]4.58076923076923[/C][/ROW]
[ROW][C]27[/C][C]115.9[/C][C]114.802564102564[/C][C]1.09743589743590[/C][/ROW]
[ROW][C]28[/C][C]109.8[/C][C]104.002564102564[/C][C]5.7974358974359[/C][/ROW]
[ROW][C]29[/C][C]101.8[/C][C]104.202564102564[/C][C]-2.40256410256411[/C][/ROW]
[ROW][C]30[/C][C]114.2[/C][C]114.152564102564[/C][C]0.0474358974358975[/C][/ROW]
[ROW][C]31[/C][C]110.8[/C][C]100.785897435897[/C][C]10.0141025641026[/C][/ROW]
[ROW][C]32[/C][C]108.4[/C][C]105.169230769231[/C][C]3.23076923076923[/C][/ROW]
[ROW][C]33[/C][C]127.5[/C][C]124.970512820513[/C][C]2.52948717948717[/C][/ROW]
[ROW][C]34[/C][C]128.6[/C][C]125.220512820513[/C][C]3.37948717948717[/C][/ROW]
[ROW][C]35[/C][C]116.6[/C][C]119.120512820513[/C][C]-2.52051282051283[/C][/ROW]
[ROW][C]36[/C][C]127.4[/C][C]119.403846153846[/C][C]7.99615384615385[/C][/ROW]
[ROW][C]37[/C][C]105[/C][C]112.780769230769[/C][C]-7.78076923076927[/C][/ROW]
[ROW][C]38[/C][C]108.3[/C][C]111.080769230769[/C][C]-2.78076923076924[/C][/ROW]
[ROW][C]39[/C][C]125[/C][C]123.564102564103[/C][C]1.43589743589743[/C][/ROW]
[ROW][C]40[/C][C]111.6[/C][C]112.764102564103[/C][C]-1.16410256410257[/C][/ROW]
[ROW][C]41[/C][C]106.5[/C][C]112.964102564103[/C][C]-6.46410256410257[/C][/ROW]
[ROW][C]42[/C][C]130.3[/C][C]122.914102564103[/C][C]7.38589743589745[/C][/ROW]
[ROW][C]43[/C][C]115[/C][C]109.547435897436[/C][C]5.4525641025641[/C][/ROW]
[ROW][C]44[/C][C]116.1[/C][C]113.930769230769[/C][C]2.16923076923076[/C][/ROW]
[ROW][C]45[/C][C]134[/C][C]128.370512820513[/C][C]5.62948717948718[/C][/ROW]
[ROW][C]46[/C][C]126.5[/C][C]128.620512820513[/C][C]-2.12051282051282[/C][/ROW]
[ROW][C]47[/C][C]125.8[/C][C]122.520512820513[/C][C]3.27948717948718[/C][/ROW]
[ROW][C]48[/C][C]136.4[/C][C]122.803846153846[/C][C]13.5961538461538[/C][/ROW]
[ROW][C]49[/C][C]114.9[/C][C]116.180769230769[/C][C]-1.28076923076926[/C][/ROW]
[ROW][C]50[/C][C]110.9[/C][C]114.480769230769[/C][C]-3.58076923076923[/C][/ROW]
[ROW][C]51[/C][C]125.5[/C][C]126.964102564103[/C][C]-1.46410256410256[/C][/ROW]
[ROW][C]52[/C][C]116.8[/C][C]116.164102564103[/C][C]0.635897435897439[/C][/ROW]
[ROW][C]53[/C][C]116.8[/C][C]116.364102564103[/C][C]0.435897435897437[/C][/ROW]
[ROW][C]54[/C][C]125.5[/C][C]126.314102564103[/C][C]-0.814102564102563[/C][/ROW]
[ROW][C]55[/C][C]104.2[/C][C]112.947435897436[/C][C]-8.74743589743589[/C][/ROW]
[ROW][C]56[/C][C]115.1[/C][C]117.330769230769[/C][C]-2.23076923076923[/C][/ROW]
[ROW][C]57[/C][C]132.8[/C][C]131.770512820513[/C][C]1.02948717948719[/C][/ROW]
[ROW][C]58[/C][C]123.3[/C][C]132.020512820513[/C][C]-8.72051282051282[/C][/ROW]
[ROW][C]59[/C][C]124.8[/C][C]125.920512820513[/C][C]-1.12051282051281[/C][/ROW]
[ROW][C]60[/C][C]122[/C][C]126.203846153846[/C][C]-4.20384615384615[/C][/ROW]
[ROW][C]61[/C][C]117.4[/C][C]119.580769230769[/C][C]-2.18076923076925[/C][/ROW]
[ROW][C]62[/C][C]117.9[/C][C]117.880769230769[/C][C]0.0192307692307785[/C][/ROW]
[ROW][C]63[/C][C]137.4[/C][C]130.364102564103[/C][C]7.03589743589745[/C][/ROW]
[ROW][C]64[/C][C]114.6[/C][C]119.564102564103[/C][C]-4.96410256410256[/C][/ROW]
[ROW][C]65[/C][C]124.7[/C][C]119.764102564103[/C][C]4.93589743589745[/C][/ROW]
[ROW][C]66[/C][C]129.6[/C][C]129.714102564103[/C][C]-0.114102564102566[/C][/ROW]
[ROW][C]67[/C][C]109.4[/C][C]116.347435897436[/C][C]-6.94743589743589[/C][/ROW]
[ROW][C]68[/C][C]120.9[/C][C]120.730769230769[/C][C]0.169230769230778[/C][/ROW]
[ROW][C]69[/C][C]134.9[/C][C]135.170512820513[/C][C]-0.270512820512813[/C][/ROW]
[ROW][C]70[/C][C]136.3[/C][C]135.420512820513[/C][C]0.879487179487195[/C][/ROW]
[ROW][C]71[/C][C]133.2[/C][C]129.320512820513[/C][C]3.87948717948718[/C][/ROW]
[ROW][C]72[/C][C]127.2[/C][C]129.603846153846[/C][C]-2.40384615384615[/C][/ROW]
[/TABLE]
Source: https://freestatistics.org/blog/index.php?pk=25465&T=4

Globally Unique Identifier (entire table): ba.freestatistics.org/blog/index.php?pk=25465&T=4

As an alternative you can also use a QR Code:  

The GUIDs for individual cells are displayed in the table below:

Multiple Linear Regression - Actuals, Interpolation, and Residuals
Time or IndexActualsInterpolationForecastResidualsPrediction Error
198.697.21923076923061.38076923076939
29895.51923076923082.48076923076922
3106.8108.002564102564-1.20256410256411
496.797.202564102564-0.502564102564097
5100.297.40256410256412.79743589743590
6107.7107.3525641025640.347435897435890
79293.9858974358974-1.98589743589744
898.498.36923076923080.0307692307692309
9107.4112.808974358974-5.40897435897437
10117.7113.0589743589744.64102564102563
11105.7106.958974358974-1.25897435897436
1297.5107.242307692308-9.7423076923077
1399.9100.619230769231-0.719230769230802
1498.298.9192307692308-0.719230769230773
15104.5111.402564102564-6.90256410256411
16100.8100.6025641025640.197435897435894
17101.5100.8025641025640.697435897435894
18103.9110.752564102564-6.8525641025641
1999.697.38589743589742.21410256410256
2098.4101.769230769231-3.36923076923077
21112.7116.208974358974-3.50897435897436
22118.4116.4589743589741.94102564102564
23108.1110.358974358974-2.25897435897436
24105.4110.642307692308-5.24230769230769
25114.6104.01923076923110.5807692307692
26106.9102.3192307692314.58076923076923
27115.9114.8025641025641.09743589743590
28109.8104.0025641025645.7974358974359
29101.8104.202564102564-2.40256410256411
30114.2114.1525641025640.0474358974358975
31110.8100.78589743589710.0141025641026
32108.4105.1692307692313.23076923076923
33127.5124.9705128205132.52948717948717
34128.6125.2205128205133.37948717948717
35116.6119.120512820513-2.52051282051283
36127.4119.4038461538467.99615384615385
37105112.780769230769-7.78076923076927
38108.3111.080769230769-2.78076923076924
39125123.5641025641031.43589743589743
40111.6112.764102564103-1.16410256410257
41106.5112.964102564103-6.46410256410257
42130.3122.9141025641037.38589743589745
43115109.5474358974365.4525641025641
44116.1113.9307692307692.16923076923076
45134128.3705128205135.62948717948718
46126.5128.620512820513-2.12051282051282
47125.8122.5205128205133.27948717948718
48136.4122.80384615384613.5961538461538
49114.9116.180769230769-1.28076923076926
50110.9114.480769230769-3.58076923076923
51125.5126.964102564103-1.46410256410256
52116.8116.1641025641030.635897435897439
53116.8116.3641025641030.435897435897437
54125.5126.314102564103-0.814102564102563
55104.2112.947435897436-8.74743589743589
56115.1117.330769230769-2.23076923076923
57132.8131.7705128205131.02948717948719
58123.3132.020512820513-8.72051282051282
59124.8125.920512820513-1.12051282051281
60122126.203846153846-4.20384615384615
61117.4119.580769230769-2.18076923076925
62117.9117.8807692307690.0192307692307785
63137.4130.3641025641037.03589743589745
64114.6119.564102564103-4.96410256410256
65124.7119.7641025641034.93589743589745
66129.6129.714102564103-0.114102564102566
67109.4116.347435897436-6.94743589743589
68120.9120.7307692307690.169230769230778
69134.9135.170512820513-0.270512820512813
70136.3135.4205128205130.879487179487195
71133.2129.3205128205133.87948717948718
72127.2129.603846153846-2.40384615384615


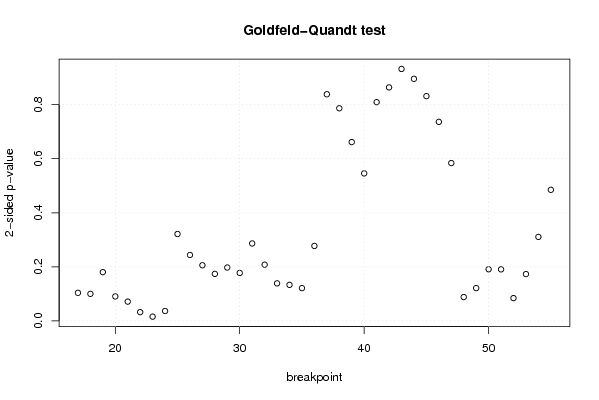
Goldfeld-Quandt test for Heteroskedasticity
p-valuesAlternative Hypothesis
breakpoint indexgreater2-sidedless
170.05184188298439240.1036837659687850.948158117015608
180.04996001390649590.09992002781299190.950039986093504
190.09010643029079050.1802128605815810.90989356970921
200.04519650491900510.09039300983801020.954803495080995
210.03561029256378330.07122058512756660.964389707436217
220.01610655144675860.03221310289351720.983893448553241
230.007760992993423940.01552198598684790.992239007006576
240.01821473808164810.03642947616329610.981785261918352
250.1606940845114730.3213881690229460.839305915488527
260.1218560063078560.2437120126157120.878143993692144
270.1028466755316720.2056933510633450.897153324468328
280.08690436798119560.1738087359623910.913095632018804
290.0986665842060450.197333168412090.901333415793955
300.08866905567831310.1773381113566260.911330944321687
310.1431909915072370.2863819830144740.856809008492763
320.1039003831137950.207800766227590.896099616886205
330.06938445827792650.1387689165558530.930615541722074
340.06660641316742570.1332128263348510.933393586832574
350.06055863631579470.1211172726315890.939441363684205
360.1386278780429190.2772557560858380.861372121957081
370.4192891549454520.8385783098909030.580710845054548
380.3933654031441010.7867308062882020.606634596855899
390.3308340497488530.6616680994977070.669165950251147
400.2728346286122470.5456692572244940.727165371387753
410.4046444269961830.8092888539923650.595355573003817
420.4319636611897520.8639273223795030.568036338810248
430.5338907383355980.9322185233288040.466109261664402
440.447840618538580.895681237077160.55215938146142
450.415778004055480.831556008110960.58422199594452
460.368244386050850.73648877210170.63175561394915
470.2919630630912220.5839261261824440.708036936908778
480.9559605690242540.08807886195149120.0440394309757456
490.939413332834560.1211733343308790.0605866671654396
500.9045669303119250.190866139376150.095433069688075
510.9047066789559220.1905866420881560.095293321044078
520.9579037015207330.0841925969585350.0420962984792675
530.9134549516971510.1730900966056970.0865450483028486
540.8446495778364960.3107008443270080.155350422163504
550.7575546565359530.4848906869280940.242445343464047

\begin{tabular}{lllllllll}
\hline
Goldfeld-Quandt test for Heteroskedasticity \tabularnewline
p-values & Alternative Hypothesis \tabularnewline
breakpoint index & greater & 2-sided & less \tabularnewline
17 & 0.0518418829843924 & 0.103683765968785 & 0.948158117015608 \tabularnewline
18 & 0.0499600139064959 & 0.0999200278129919 & 0.950039986093504 \tabularnewline
19 & 0.0901064302907905 & 0.180212860581581 & 0.90989356970921 \tabularnewline
20 & 0.0451965049190051 & 0.0903930098380102 & 0.954803495080995 \tabularnewline
21 & 0.0356102925637833 & 0.0712205851275666 & 0.964389707436217 \tabularnewline
22 & 0.0161065514467586 & 0.0322131028935172 & 0.983893448553241 \tabularnewline
23 & 0.00776099299342394 & 0.0155219859868479 & 0.992239007006576 \tabularnewline
24 & 0.0182147380816481 & 0.0364294761632961 & 0.981785261918352 \tabularnewline
25 & 0.160694084511473 & 0.321388169022946 & 0.839305915488527 \tabularnewline
26 & 0.121856006307856 & 0.243712012615712 & 0.878143993692144 \tabularnewline
27 & 0.102846675531672 & 0.205693351063345 & 0.897153324468328 \tabularnewline
28 & 0.0869043679811956 & 0.173808735962391 & 0.913095632018804 \tabularnewline
29 & 0.098666584206045 & 0.19733316841209 & 0.901333415793955 \tabularnewline
30 & 0.0886690556783131 & 0.177338111356626 & 0.911330944321687 \tabularnewline
31 & 0.143190991507237 & 0.286381983014474 & 0.856809008492763 \tabularnewline
32 & 0.103900383113795 & 0.20780076622759 & 0.896099616886205 \tabularnewline
33 & 0.0693844582779265 & 0.138768916555853 & 0.930615541722074 \tabularnewline
34 & 0.0666064131674257 & 0.133212826334851 & 0.933393586832574 \tabularnewline
35 & 0.0605586363157947 & 0.121117272631589 & 0.939441363684205 \tabularnewline
36 & 0.138627878042919 & 0.277255756085838 & 0.861372121957081 \tabularnewline
37 & 0.419289154945452 & 0.838578309890903 & 0.580710845054548 \tabularnewline
38 & 0.393365403144101 & 0.786730806288202 & 0.606634596855899 \tabularnewline
39 & 0.330834049748853 & 0.661668099497707 & 0.669165950251147 \tabularnewline
40 & 0.272834628612247 & 0.545669257224494 & 0.727165371387753 \tabularnewline
41 & 0.404644426996183 & 0.809288853992365 & 0.595355573003817 \tabularnewline
42 & 0.431963661189752 & 0.863927322379503 & 0.568036338810248 \tabularnewline
43 & 0.533890738335598 & 0.932218523328804 & 0.466109261664402 \tabularnewline
44 & 0.44784061853858 & 0.89568123707716 & 0.55215938146142 \tabularnewline
45 & 0.41577800405548 & 0.83155600811096 & 0.58422199594452 \tabularnewline
46 & 0.36824438605085 & 0.7364887721017 & 0.63175561394915 \tabularnewline
47 & 0.291963063091222 & 0.583926126182444 & 0.708036936908778 \tabularnewline
48 & 0.955960569024254 & 0.0880788619514912 & 0.0440394309757456 \tabularnewline
49 & 0.93941333283456 & 0.121173334330879 & 0.0605866671654396 \tabularnewline
50 & 0.904566930311925 & 0.19086613937615 & 0.095433069688075 \tabularnewline
51 & 0.904706678955922 & 0.190586642088156 & 0.095293321044078 \tabularnewline
52 & 0.957903701520733 & 0.084192596958535 & 0.0420962984792675 \tabularnewline
53 & 0.913454951697151 & 0.173090096605697 & 0.0865450483028486 \tabularnewline
54 & 0.844649577836496 & 0.310700844327008 & 0.155350422163504 \tabularnewline
55 & 0.757554656535953 & 0.484890686928094 & 0.242445343464047 \tabularnewline
\hline
\end{tabular}
%Source: https://freestatistics.org/blog/index.php?pk=25465&T=5

[TABLE]
[ROW][C]Goldfeld-Quandt test for Heteroskedasticity[/C][/ROW]
[ROW][C]p-values[/C][C]Alternative Hypothesis[/C][/ROW]
[ROW][C]breakpoint index[/C][C]greater[/C][C]2-sided[/C][C]less[/C][/ROW]
[ROW][C]17[/C][C]0.0518418829843924[/C][C]0.103683765968785[/C][C]0.948158117015608[/C][/ROW]
[ROW][C]18[/C][C]0.0499600139064959[/C][C]0.0999200278129919[/C][C]0.950039986093504[/C][/ROW]
[ROW][C]19[/C][C]0.0901064302907905[/C][C]0.180212860581581[/C][C]0.90989356970921[/C][/ROW]
[ROW][C]20[/C][C]0.0451965049190051[/C][C]0.0903930098380102[/C][C]0.954803495080995[/C][/ROW]
[ROW][C]21[/C][C]0.0356102925637833[/C][C]0.0712205851275666[/C][C]0.964389707436217[/C][/ROW]
[ROW][C]22[/C][C]0.0161065514467586[/C][C]0.0322131028935172[/C][C]0.983893448553241[/C][/ROW]
[ROW][C]23[/C][C]0.00776099299342394[/C][C]0.0155219859868479[/C][C]0.992239007006576[/C][/ROW]
[ROW][C]24[/C][C]0.0182147380816481[/C][C]0.0364294761632961[/C][C]0.981785261918352[/C][/ROW]
[ROW][C]25[/C][C]0.160694084511473[/C][C]0.321388169022946[/C][C]0.839305915488527[/C][/ROW]
[ROW][C]26[/C][C]0.121856006307856[/C][C]0.243712012615712[/C][C]0.878143993692144[/C][/ROW]
[ROW][C]27[/C][C]0.102846675531672[/C][C]0.205693351063345[/C][C]0.897153324468328[/C][/ROW]
[ROW][C]28[/C][C]0.0869043679811956[/C][C]0.173808735962391[/C][C]0.913095632018804[/C][/ROW]
[ROW][C]29[/C][C]0.098666584206045[/C][C]0.19733316841209[/C][C]0.901333415793955[/C][/ROW]
[ROW][C]30[/C][C]0.0886690556783131[/C][C]0.177338111356626[/C][C]0.911330944321687[/C][/ROW]
[ROW][C]31[/C][C]0.143190991507237[/C][C]0.286381983014474[/C][C]0.856809008492763[/C][/ROW]
[ROW][C]32[/C][C]0.103900383113795[/C][C]0.20780076622759[/C][C]0.896099616886205[/C][/ROW]
[ROW][C]33[/C][C]0.0693844582779265[/C][C]0.138768916555853[/C][C]0.930615541722074[/C][/ROW]
[ROW][C]34[/C][C]0.0666064131674257[/C][C]0.133212826334851[/C][C]0.933393586832574[/C][/ROW]
[ROW][C]35[/C][C]0.0605586363157947[/C][C]0.121117272631589[/C][C]0.939441363684205[/C][/ROW]
[ROW][C]36[/C][C]0.138627878042919[/C][C]0.277255756085838[/C][C]0.861372121957081[/C][/ROW]
[ROW][C]37[/C][C]0.419289154945452[/C][C]0.838578309890903[/C][C]0.580710845054548[/C][/ROW]
[ROW][C]38[/C][C]0.393365403144101[/C][C]0.786730806288202[/C][C]0.606634596855899[/C][/ROW]
[ROW][C]39[/C][C]0.330834049748853[/C][C]0.661668099497707[/C][C]0.669165950251147[/C][/ROW]
[ROW][C]40[/C][C]0.272834628612247[/C][C]0.545669257224494[/C][C]0.727165371387753[/C][/ROW]
[ROW][C]41[/C][C]0.404644426996183[/C][C]0.809288853992365[/C][C]0.595355573003817[/C][/ROW]
[ROW][C]42[/C][C]0.431963661189752[/C][C]0.863927322379503[/C][C]0.568036338810248[/C][/ROW]
[ROW][C]43[/C][C]0.533890738335598[/C][C]0.932218523328804[/C][C]0.466109261664402[/C][/ROW]
[ROW][C]44[/C][C]0.44784061853858[/C][C]0.89568123707716[/C][C]0.55215938146142[/C][/ROW]
[ROW][C]45[/C][C]0.41577800405548[/C][C]0.83155600811096[/C][C]0.58422199594452[/C][/ROW]
[ROW][C]46[/C][C]0.36824438605085[/C][C]0.7364887721017[/C][C]0.63175561394915[/C][/ROW]
[ROW][C]47[/C][C]0.291963063091222[/C][C]0.583926126182444[/C][C]0.708036936908778[/C][/ROW]
[ROW][C]48[/C][C]0.955960569024254[/C][C]0.0880788619514912[/C][C]0.0440394309757456[/C][/ROW]
[ROW][C]49[/C][C]0.93941333283456[/C][C]0.121173334330879[/C][C]0.0605866671654396[/C][/ROW]
[ROW][C]50[/C][C]0.904566930311925[/C][C]0.19086613937615[/C][C]0.095433069688075[/C][/ROW]
[ROW][C]51[/C][C]0.904706678955922[/C][C]0.190586642088156[/C][C]0.095293321044078[/C][/ROW]
[ROW][C]52[/C][C]0.957903701520733[/C][C]0.084192596958535[/C][C]0.0420962984792675[/C][/ROW]
[ROW][C]53[/C][C]0.913454951697151[/C][C]0.173090096605697[/C][C]0.0865450483028486[/C][/ROW]
[ROW][C]54[/C][C]0.844649577836496[/C][C]0.310700844327008[/C][C]0.155350422163504[/C][/ROW]
[ROW][C]55[/C][C]0.757554656535953[/C][C]0.484890686928094[/C][C]0.242445343464047[/C][/ROW]
[/TABLE]
Source: https://freestatistics.org/blog/index.php?pk=25465&T=5

Globally Unique Identifier (entire table): ba.freestatistics.org/blog/index.php?pk=25465&T=5

As an alternative you can also use a QR Code:  

The GUIDs for individual cells are displayed in the table below:

Goldfeld-Quandt test for Heteroskedasticity
p-valuesAlternative Hypothesis
breakpoint indexgreater2-sidedless
170.05184188298439240.1036837659687850.948158117015608
180.04996001390649590.09992002781299190.950039986093504
190.09010643029079050.1802128605815810.90989356970921
200.04519650491900510.09039300983801020.954803495080995
210.03561029256378330.07122058512756660.964389707436217
220.01610655144675860.03221310289351720.983893448553241
230.007760992993423940.01552198598684790.992239007006576
240.01821473808164810.03642947616329610.981785261918352
250.1606940845114730.3213881690229460.839305915488527
260.1218560063078560.2437120126157120.878143993692144
270.1028466755316720.2056933510633450.897153324468328
280.08690436798119560.1738087359623910.913095632018804
290.0986665842060450.197333168412090.901333415793955
300.08866905567831310.1773381113566260.911330944321687
310.1431909915072370.2863819830144740.856809008492763
320.1039003831137950.207800766227590.896099616886205
330.06938445827792650.1387689165558530.930615541722074
340.06660641316742570.1332128263348510.933393586832574
350.06055863631579470.1211172726315890.939441363684205
360.1386278780429190.2772557560858380.861372121957081
370.4192891549454520.8385783098909030.580710845054548
380.3933654031441010.7867308062882020.606634596855899
390.3308340497488530.6616680994977070.669165950251147
400.2728346286122470.5456692572244940.727165371387753
410.4046444269961830.8092888539923650.595355573003817
420.4319636611897520.8639273223795030.568036338810248
430.5338907383355980.9322185233288040.466109261664402
440.447840618538580.895681237077160.55215938146142
450.415778004055480.831556008110960.58422199594452
460.368244386050850.73648877210170.63175561394915
470.2919630630912220.5839261261824440.708036936908778
480.9559605690242540.08807886195149120.0440394309757456
490.939413332834560.1211733343308790.0605866671654396
500.9045669303119250.190866139376150.095433069688075
510.9047066789559220.1905866420881560.095293321044078
520.9579037015207330.0841925969585350.0420962984792675
530.9134549516971510.1730900966056970.0865450483028486
540.8446495778364960.3107008443270080.155350422163504
550.7575546565359530.4848906869280940.242445343464047


Meta Analysis of Goldfeld-Quandt test for Heteroskedasticity
Description# significant tests% significant testsOK/NOK
1% type I error level00OK
5% type I error level30.076923076923077NOK
10% type I error level80.205128205128205NOK

\begin{tabular}{lllllllll}
\hline
Meta Analysis of Goldfeld-Quandt test for Heteroskedasticity \tabularnewline
Description & # significant tests & % significant tests & OK/NOK \tabularnewline
1% type I error level & 0 & 0 & OK \tabularnewline
5% type I error level & 3 & 0.076923076923077 & NOK \tabularnewline
10% type I error level & 8 & 0.205128205128205 & NOK \tabularnewline
\hline
\end{tabular}
%Source: https://freestatistics.org/blog/index.php?pk=25465&T=6

[TABLE]
[ROW][C]Meta Analysis of Goldfeld-Quandt test for Heteroskedasticity[/C][/ROW]
[ROW][C]Description[/C][C]# significant tests[/C][C]% significant tests[/C][C]OK/NOK[/C][/ROW]
[ROW][C]1% type I error level[/C][C]0[/C][C]0[/C][C]OK[/C][/ROW]
[ROW][C]5% type I error level[/C][C]3[/C][C]0.076923076923077[/C][C]NOK[/C][/ROW]
[ROW][C]10% type I error level[/C][C]8[/C][C]0.205128205128205[/C][C]NOK[/C][/ROW]
[/TABLE]
Source: https://freestatistics.org/blog/index.php?pk=25465&T=6

Globally Unique Identifier (entire table): ba.freestatistics.org/blog/index.php?pk=25465&T=6

As an alternative you can also use a QR Code:  

The GUIDs for individual cells are displayed in the table below:

Meta Analysis of Goldfeld-Quandt test for Heteroskedasticity
Description# significant tests% significant testsOK/NOK
1% type I error level00OK
5% type I error level30.076923076923077NOK
10% type I error level80.205128205128205NOK


Parameters (Session):
par1 = 1 ; par2 = Include Monthly Dummies ; par3 = Linear Trend ;
Parameters (R input):
par1 = 1 ; par2 = Include Monthly Dummies ; par3 = Linear Trend ;
R code (references can be found in the software module):
library(lattice)
library(lmtest)
n25 <- 25 #minimum number of obs. for Goldfeld-Quandt test
par1 <- as.numeric(par1)
x <- t(y)
k <- length(x[1,])
n <- length(x[,1])
x1 <- cbind(x[,par1], x[,1:k!=par1])
mycolnames <- c(colnames(x)[par1], colnames(x)[1:k!=par1])
colnames(x1) <- mycolnames #colnames(x)[par1]
x <- x1
if (par3 == 'First Differences'){
x2 <- array(0, dim=c(n-1,k), dimnames=list(1:(n-1), paste('(1-B)',colnames(x),sep='')))
for (i in 1:n-1) {
for (j in 1:k) {
x2[i,j] <- x[i+1,j] - x[i,j]
}
}
x <- x2
}
if (par2 == 'Include Monthly Dummies'){
x2 <- array(0, dim=c(n,11), dimnames=list(1:n, paste('M', seq(1:11), sep ='')))
for (i in 1:11){
x2[seq(i,n,12),i] <- 1
}
x <- cbind(x, x2)
}
if (par2 == 'Include Quarterly Dummies'){
x2 <- array(0, dim=c(n,3), dimnames=list(1:n, paste('Q', seq(1:3), sep ='')))
for (i in 1:3){
x2[seq(i,n,4),i] <- 1
}
x <- cbind(x, x2)
}
k <- length(x[1,])
if (par3 == 'Linear Trend'){
x <- cbind(x, c(1:n))
colnames(x)[k+1] <- 't'
}
x
k <- length(x[1,])
df <- as.data.frame(x)
(mylm <- lm(df))
(mysum <- summary(mylm))
if (n > n25) {
kp3 <- k + 3
nmkm3 <- n - k - 3
gqarr <- array(NA, dim=c(nmkm3-kp3+1,3))
numgqtests <- 0
numsignificant1 <- 0
numsignificant5 <- 0
numsignificant10 <- 0
for (mypoint in kp3:nmkm3) {
j <- 0
numgqtests <- numgqtests + 1
for (myalt in c('greater', 'two.sided', 'less')) {
j <- j + 1
gqarr[mypoint-kp3+1,j] <- gqtest(mylm, point=mypoint, alternative=myalt)$p.value
}
if (gqarr[mypoint-kp3+1,2] < 0.01) numsignificant1 <- numsignificant1 + 1
if (gqarr[mypoint-kp3+1,2] < 0.05) numsignificant5 <- numsignificant5 + 1
if (gqarr[mypoint-kp3+1,2] < 0.10) numsignificant10 <- numsignificant10 + 1
}
gqarr
}
bitmap(file='test0.png')
plot(x[,1], type='l', main='Actuals and Interpolation', ylab='value of Actuals and Interpolation (dots)', xlab='time or index')
points(x[,1]-mysum$resid)
grid()
dev.off()
bitmap(file='test1.png')
plot(mysum$resid, type='b', pch=19, main='Residuals', ylab='value of Residuals', xlab='time or index')
grid()
dev.off()
bitmap(file='test2.png')
hist(mysum$resid, main='Residual Histogram', xlab='values of Residuals')
grid()
dev.off()
bitmap(file='test3.png')
densityplot(~mysum$resid,col='black',main='Residual Density Plot', xlab='values of Residuals')
dev.off()
bitmap(file='test4.png')
qqnorm(mysum$resid, main='Residual Normal Q-Q Plot')
qqline(mysum$resid)
grid()
dev.off()
(myerror <- as.ts(mysum$resid))
bitmap(file='test5.png')
dum <- cbind(lag(myerror,k=1),myerror)
dum
dum1 <- dum[2:length(myerror),]
dum1
z <- as.data.frame(dum1)
z
plot(z,main=paste('Residual Lag plot, lowess, and regression line'), ylab='values of Residuals', xlab='lagged values of Residuals')
lines(lowess(z))
abline(lm(z))
grid()
dev.off()
bitmap(file='test6.png')
acf(mysum$resid, lag.max=length(mysum$resid)/2, main='Residual Autocorrelation Function')
grid()
dev.off()
bitmap(file='test7.png')
pacf(mysum$resid, lag.max=length(mysum$resid)/2, main='Residual Partial Autocorrelation Function')
grid()
dev.off()
bitmap(file='test8.png')
opar <- par(mfrow = c(2,2), oma = c(0, 0, 1.1, 0))
plot(mylm, las = 1, sub='Residual Diagnostics')
par(opar)
dev.off()
if (n > n25) {
bitmap(file='test9.png')
plot(kp3:nmkm3,gqarr[,2], main='Goldfeld-Quandt test',ylab='2-sided p-value',xlab='breakpoint')
grid()
dev.off()
}
load(file='createtable')
a<-table.start()
a<-table.row.start(a)
a<-table.element(a, 'Multiple Linear Regression - Estimated Regression Equation', 1, TRUE)
a<-table.row.end(a)
myeq <- colnames(x)[1]
myeq <- paste(myeq, '[t] = ', sep='')
for (i in 1:k){
if (mysum$coefficients[i,1] > 0) myeq <- paste(myeq, '+', '')
myeq <- paste(myeq, mysum$coefficients[i,1], sep=' ')
if (rownames(mysum$coefficients)[i] != '(Intercept)') {
myeq <- paste(myeq, rownames(mysum$coefficients)[i], sep='')
if (rownames(mysum$coefficients)[i] != 't') myeq <- paste(myeq, '[t]', sep='')
}
}
myeq <- paste(myeq, ' + e[t]')
a<-table.row.start(a)
a<-table.element(a, myeq)
a<-table.row.end(a)
a<-table.end(a)
table.save(a,file='mytable1.tab')
a<-table.start()
a<-table.row.start(a)
a<-table.element(a,hyperlink('ols1.htm','Multiple Linear Regression - Ordinary Least Squares',''), 6, TRUE)
a<-table.row.end(a)
a<-table.row.start(a)
a<-table.element(a,'Variable',header=TRUE)
a<-table.element(a,'Parameter',header=TRUE)
a<-table.element(a,'S.D.',header=TRUE)
a<-table.element(a,'T-STAT
H0: parameter = 0',header=TRUE)
a<-table.element(a,'2-tail p-value',header=TRUE)
a<-table.element(a,'1-tail p-value',header=TRUE)
a<-table.row.end(a)
for (i in 1:k){
a<-table.row.start(a)
a<-table.element(a,rownames(mysum$coefficients)[i],header=TRUE)
a<-table.element(a,mysum$coefficients[i,1])
a<-table.element(a, round(mysum$coefficients[i,2],6))
a<-table.element(a, round(mysum$coefficients[i,3],4))
a<-table.element(a, round(mysum$coefficients[i,4],6))
a<-table.element(a, round(mysum$coefficients[i,4]/2,6))
a<-table.row.end(a)
}
a<-table.end(a)
table.save(a,file='mytable2.tab')
a<-table.start()
a<-table.row.start(a)
a<-table.element(a, 'Multiple Linear Regression - Regression Statistics', 2, TRUE)
a<-table.row.end(a)
a<-table.row.start(a)
a<-table.element(a, 'Multiple R',1,TRUE)
a<-table.element(a, sqrt(mysum$r.squared))
a<-table.row.end(a)
a<-table.row.start(a)
a<-table.element(a, 'R-squared',1,TRUE)
a<-table.element(a, mysum$r.squared)
a<-table.row.end(a)
a<-table.row.start(a)
a<-table.element(a, 'Adjusted R-squared',1,TRUE)
a<-table.element(a, mysum$adj.r.squared)
a<-table.row.end(a)
a<-table.row.start(a)
a<-table.element(a, 'F-TEST (value)',1,TRUE)
a<-table.element(a, mysum$fstatistic[1])
a<-table.row.end(a)
a<-table.row.start(a)
a<-table.element(a, 'F-TEST (DF numerator)',1,TRUE)
a<-table.element(a, mysum$fstatistic[2])
a<-table.row.end(a)
a<-table.row.start(a)
a<-table.element(a, 'F-TEST (DF denominator)',1,TRUE)
a<-table.element(a, mysum$fstatistic[3])
a<-table.row.end(a)
a<-table.row.start(a)
a<-table.element(a, 'p-value',1,TRUE)
a<-table.element(a, 1-pf(mysum$fstatistic[1],mysum$fstatistic[2],mysum$fstatistic[3]))
a<-table.row.end(a)
a<-table.row.start(a)
a<-table.element(a, 'Multiple Linear Regression - Residual Statistics', 2, TRUE)
a<-table.row.end(a)
a<-table.row.start(a)
a<-table.element(a, 'Residual Standard Deviation',1,TRUE)
a<-table.element(a, mysum$sigma)
a<-table.row.end(a)
a<-table.row.start(a)
a<-table.element(a, 'Sum Squared Residuals',1,TRUE)
a<-table.element(a, sum(myerror*myerror))
a<-table.row.end(a)
a<-table.end(a)
table.save(a,file='mytable3.tab')
a<-table.start()
a<-table.row.start(a)
a<-table.element(a, 'Multiple Linear Regression - Actuals, Interpolation, and Residuals', 4, TRUE)
a<-table.row.end(a)
a<-table.row.start(a)
a<-table.element(a, 'Time or Index', 1, TRUE)
a<-table.element(a, 'Actuals', 1, TRUE)
a<-table.element(a, 'Interpolation
Forecast', 1, TRUE)
a<-table.element(a, 'Residuals
Prediction Error', 1, TRUE)
a<-table.row.end(a)
for (i in 1:n) {
a<-table.row.start(a)
a<-table.element(a,i, 1, TRUE)
a<-table.element(a,x[i])
a<-table.element(a,x[i]-mysum$resid[i])
a<-table.element(a,mysum$resid[i])
a<-table.row.end(a)
}
a<-table.end(a)
table.save(a,file='mytable4.tab')
if (n > n25) {
a<-table.start()
a<-table.row.start(a)
a<-table.element(a,'Goldfeld-Quandt test for Heteroskedasticity',4,TRUE)
a<-table.row.end(a)
a<-table.row.start(a)
a<-table.element(a,'p-values',header=TRUE)
a<-table.element(a,'Alternative Hypothesis',3,header=TRUE)
a<-table.row.end(a)
a<-table.row.start(a)
a<-table.element(a,'breakpoint index',header=TRUE)
a<-table.element(a,'greater',header=TRUE)
a<-table.element(a,'2-sided',header=TRUE)
a<-table.element(a,'less',header=TRUE)
a<-table.row.end(a)
for (mypoint in kp3:nmkm3) {
a<-table.row.start(a)
a<-table.element(a,mypoint,header=TRUE)
a<-table.element(a,gqarr[mypoint-kp3+1,1])
a<-table.element(a,gqarr[mypoint-kp3+1,2])
a<-table.element(a,gqarr[mypoint-kp3+1,3])
a<-table.row.end(a)
}
a<-table.end(a)
table.save(a,file='mytable5.tab')
a<-table.start()
a<-table.row.start(a)
a<-table.element(a,'Meta Analysis of Goldfeld-Quandt test for Heteroskedasticity',4,TRUE)
a<-table.row.end(a)
a<-table.row.start(a)
a<-table.element(a,'Description',header=TRUE)
a<-table.element(a,'# significant tests',header=TRUE)
a<-table.element(a,'% significant tests',header=TRUE)
a<-table.element(a,'OK/NOK',header=TRUE)
a<-table.row.end(a)
a<-table.row.start(a)
a<-table.element(a,'1% type I error level',header=TRUE)
a<-table.element(a,numsignificant1)
a<-table.element(a,numsignificant1/numgqtests)
if (numsignificant1/numgqtests < 0.01) dum <- 'OK' else dum <- 'NOK'
a<-table.element(a,dum)
a<-table.row.end(a)
a<-table.row.start(a)
a<-table.element(a,'5% type I error level',header=TRUE)
a<-table.element(a,numsignificant5)
a<-table.element(a,numsignificant5/numgqtests)
if (numsignificant5/numgqtests < 0.05) dum <- 'OK' else dum <- 'NOK'
a<-table.element(a,dum)
a<-table.row.end(a)
a<-table.row.start(a)
a<-table.element(a,'10% type I error level',header=TRUE)
a<-table.element(a,numsignificant10)
a<-table.element(a,numsignificant10/numgqtests)
if (numsignificant10/numgqtests < 0.1) dum <- 'OK' else dum <- 'NOK'
a<-table.element(a,dum)
a<-table.row.end(a)
a<-table.end(a)
table.save(a,file='mytable6.tab')
}