Free Statistics

of Irreproducible Research!

Author's title

Author*The author of this computation has been verified*
R Software Modulerwasp_multipleregression.wasp
Title produced by softwareMultiple Regression
Date of computationMon, 24 Nov 2008 10:04:23 -0700
Cite this page as followsStatistical Computations at FreeStatistics.org, Office for Research Development and Education, URL https://freestatistics.org/blog/index.php?v=date/2008/Nov/24/t1227546350htipze12pesjpig.htm/, Retrieved Tue, 14 May 2024 11:30:20 +0000
Statistical Computations at FreeStatistics.org, Office for Research Development and Education, URL https://freestatistics.org/blog/index.php?pk=25462, Retrieved Tue, 14 May 2024 11:30:20 +0000
QR Codes:

Original text written by user:
IsPrivate?No (this computation is public)
User-defined keywords
Estimated Impact160
Family? (F = Feedback message, R = changed R code, M = changed R Module, P = changed Parameters, D = changed Data)
-     [Multiple Regression] [Q1 The Seatbeltlaw] [2007-11-14 19:27:43] [8cd6641b921d30ebe00b648d1481bba0]
F   PD  [Multiple Regression] [Q1 Case: the Seat...] [2008-11-19 13:32:26] [c993f605b206b366f754f7f8c1fcc291]
F         [Multiple Regression] [q1 tweede] [2008-11-24 16:38:27] [e43247bc0ab243a5af99ac7f55ba0b41]
F    D        [Multiple Regression] [q3 werkloosheid m...] [2008-11-24 17:04:23] [f24298b2e4c2a19d76cf4460ec5d2246] [Current]
Feedback Forum
2008-12-01 20:14:22 [Lindsay Heyndrickx] [reply
Hier is naar te weinig gegevens gekeken. De dummy is hier ook zeer slecht gekozen. Dit moet te maken hebben met een gebeurtenis die invloed kan gehad hebben op de tijdreeks. Hier is totaal geen rekening mee gehouden dus deze dummy is hier totaal niet relevant. Om hier een correcte dummy te vinden moeten we kijken naar wat de werkloosheid net kan beïnvloeden en of er misschien een beslissing is gebeurt vanwege de overheid om de werkloosheid te doen dalen of er in de loop der jaren een crisis is geweest die veel werkloosheid teweeg bracht.

Post a new message
Dataseries X:
7,8	0
7,6	0
7,5	0
7,6	0
7,5	0
7,3	0
7,6	0
7,5	0
7,6	0
7,9	0
7,9	0
8,1	0
8,2	0
8,0	0
7,5	0
6,8	0
6,5	0
6,6	0
7,6	0
8,0	0
8,0	0
7,7	0
7,5	0
7,6	0
7,7	0
7,9	0
7,8	0
7,5	0
7,5	0
7,1	0
7,5	0
7,5	1
7,6	1
7,7	1
7,7	1
7,9	1
8,1	1
8,2	1
8,2	1
8,1	1
7,9	1
7,3	1
6,9	1
6,6	1
6,7	1
6,9	1
7,0	1
7,1	1
7,2	1
7,1	1
6,9	1
7,0	1
6,8	1
6,4	1
6,7	1
6,7	1
6,4	1
6,3	1
6,2	1
6,5	1
6,8	1
6,8	1
6,5	1
6,3	1
5,9	1
5,9	1
6,4	1
6,4	1


Summary of computational transaction
Raw Inputview raw input (R code)
Raw Outputview raw output of R engine
Computing time2 seconds
R Server'Gwilym Jenkins' @ 72.249.127.135

\begin{tabular}{lllllllll}
\hline
Summary of computational transaction \tabularnewline
Raw Input & view raw input (R code)  \tabularnewline
Raw Output & view raw output of R engine  \tabularnewline
Computing time & 2 seconds \tabularnewline
R Server & 'Gwilym Jenkins' @ 72.249.127.135 \tabularnewline
\hline
\end{tabular}
%Source: https://freestatistics.org/blog/index.php?pk=25462&T=0

[TABLE]
[ROW][C]Summary of computational transaction[/C][/ROW]
[ROW][C]Raw Input[/C][C]view raw input (R code) [/C][/ROW]
[ROW][C]Raw Output[/C][C]view raw output of R engine [/C][/ROW]
[ROW][C]Computing time[/C][C]2 seconds[/C][/ROW]
[ROW][C]R Server[/C][C]'Gwilym Jenkins' @ 72.249.127.135[/C][/ROW]
[/TABLE]
Source: https://freestatistics.org/blog/index.php?pk=25462&T=0

Globally Unique Identifier (entire table): ba.freestatistics.org/blog/index.php?pk=25462&T=0

As an alternative you can also use a QR Code:  

The GUIDs for individual cells are displayed in the table below:

Summary of computational transaction
Raw Inputview raw input (R code)
Raw Outputview raw output of R engine
Computing time2 seconds
R Server'Gwilym Jenkins' @ 72.249.127.135


Multiple Linear Regression - Estimated Regression Equation
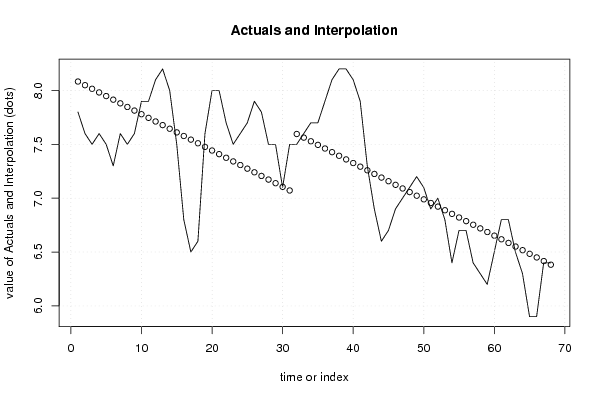
y[t] = + 8.11680424585095 + 0.557962727751495x[t] -0.0337115556882652t + e[t]

\begin{tabular}{lllllllll}
\hline
Multiple Linear Regression - Estimated Regression Equation \tabularnewline
y[t] =  +  8.11680424585095 +  0.557962727751495x[t] -0.0337115556882652t  + e[t] \tabularnewline
\hline
\end{tabular}
%Source: https://freestatistics.org/blog/index.php?pk=25462&T=1

[TABLE]
[ROW][C]Multiple Linear Regression - Estimated Regression Equation[/C][/ROW]
[ROW][C]y[t] =  +  8.11680424585095 +  0.557962727751495x[t] -0.0337115556882652t  + e[t][/C][/ROW]
[/TABLE]
Source: https://freestatistics.org/blog/index.php?pk=25462&T=1

Globally Unique Identifier (entire table): ba.freestatistics.org/blog/index.php?pk=25462&T=1

As an alternative you can also use a QR Code:  

The GUIDs for individual cells are displayed in the table below:

Multiple Linear Regression - Estimated Regression Equation
y[t] = + 8.11680424585095 + 0.557962727751495x[t] -0.0337115556882652t + e[t]


Multiple Linear Regression - Ordinary Least Squares
VariableParameterS.D.T-STATH0: parameter = 02-tail p-value1-tail p-value
(Intercept)8.116804245850950.11556870.233900
x0.5579627277514950.2096222.66180.0097840.004892
t-0.03371155568826520.005319-6.337800

\begin{tabular}{lllllllll}
\hline
Multiple Linear Regression - Ordinary Least Squares \tabularnewline
Variable & Parameter & S.D. & T-STATH0: parameter = 0 & 2-tail p-value & 1-tail p-value \tabularnewline
(Intercept) & 8.11680424585095 & 0.115568 & 70.2339 & 0 & 0 \tabularnewline
x & 0.557962727751495 & 0.209622 & 2.6618 & 0.009784 & 0.004892 \tabularnewline
t & -0.0337115556882652 & 0.005319 & -6.3378 & 0 & 0 \tabularnewline
\hline
\end{tabular}
%Source: https://freestatistics.org/blog/index.php?pk=25462&T=2

[TABLE]
[ROW][C]Multiple Linear Regression - Ordinary Least Squares[/C][/ROW]
[ROW][C]Variable[/C][C]Parameter[/C][C]S.D.[/C][C]T-STATH0: parameter = 0[/C][C]2-tail p-value[/C][C]1-tail p-value[/C][/ROW]
[ROW][C](Intercept)[/C][C]8.11680424585095[/C][C]0.115568[/C][C]70.2339[/C][C]0[/C][C]0[/C][/ROW]
[ROW][C]x[/C][C]0.557962727751495[/C][C]0.209622[/C][C]2.6618[/C][C]0.009784[/C][C]0.004892[/C][/ROW]
[ROW][C]t[/C][C]-0.0337115556882652[/C][C]0.005319[/C][C]-6.3378[/C][C]0[/C][C]0[/C][/ROW]
[/TABLE]
Source: https://freestatistics.org/blog/index.php?pk=25462&T=2

Globally Unique Identifier (entire table): ba.freestatistics.org/blog/index.php?pk=25462&T=2

As an alternative you can also use a QR Code:  

The GUIDs for individual cells are displayed in the table below:

Multiple Linear Regression - Ordinary Least Squares
VariableParameterS.D.T-STATH0: parameter = 02-tail p-value1-tail p-value
(Intercept)8.116804245850950.11556870.233900
x0.5579627277514950.2096222.66180.0097840.004892
t-0.03371155568826520.005319-6.337800


Multiple Linear Regression - Regression Statistics
Multiple R0.722455458256273
R-squared0.521941889164282
Adjusted R-squared0.507232408830875
F-TEST (value)35.4833670077997
F-TEST (DF numerator)2
F-TEST (DF denominator)65
p-value3.82932574538586e-11
Multiple Linear Regression - Residual Statistics
Residual Standard Deviation0.435321277460726
Sum Squared Residuals12.3177999496525

\begin{tabular}{lllllllll}
\hline
Multiple Linear Regression - Regression Statistics \tabularnewline
Multiple R & 0.722455458256273 \tabularnewline
R-squared & 0.521941889164282 \tabularnewline
Adjusted R-squared & 0.507232408830875 \tabularnewline
F-TEST (value) & 35.4833670077997 \tabularnewline
F-TEST (DF numerator) & 2 \tabularnewline
F-TEST (DF denominator) & 65 \tabularnewline
p-value & 3.82932574538586e-11 \tabularnewline
Multiple Linear Regression - Residual Statistics \tabularnewline
Residual Standard Deviation & 0.435321277460726 \tabularnewline
Sum Squared Residuals & 12.3177999496525 \tabularnewline
\hline
\end{tabular}
%Source: https://freestatistics.org/blog/index.php?pk=25462&T=3

[TABLE]
[ROW][C]Multiple Linear Regression - Regression Statistics[/C][/ROW]
[ROW][C]Multiple R[/C][C]0.722455458256273[/C][/ROW]
[ROW][C]R-squared[/C][C]0.521941889164282[/C][/ROW]
[ROW][C]Adjusted R-squared[/C][C]0.507232408830875[/C][/ROW]
[ROW][C]F-TEST (value)[/C][C]35.4833670077997[/C][/ROW]
[ROW][C]F-TEST (DF numerator)[/C][C]2[/C][/ROW]
[ROW][C]F-TEST (DF denominator)[/C][C]65[/C][/ROW]
[ROW][C]p-value[/C][C]3.82932574538586e-11[/C][/ROW]
[ROW][C]Multiple Linear Regression - Residual Statistics[/C][/ROW]
[ROW][C]Residual Standard Deviation[/C][C]0.435321277460726[/C][/ROW]
[ROW][C]Sum Squared Residuals[/C][C]12.3177999496525[/C][/ROW]
[/TABLE]
Source: https://freestatistics.org/blog/index.php?pk=25462&T=3

Globally Unique Identifier (entire table): ba.freestatistics.org/blog/index.php?pk=25462&T=3

As an alternative you can also use a QR Code:  

The GUIDs for individual cells are displayed in the table below:

Multiple Linear Regression - Regression Statistics
Multiple R0.722455458256273
R-squared0.521941889164282
Adjusted R-squared0.507232408830875
F-TEST (value)35.4833670077997
F-TEST (DF numerator)2
F-TEST (DF denominator)65
p-value3.82932574538586e-11
Multiple Linear Regression - Residual Statistics
Residual Standard Deviation0.435321277460726
Sum Squared Residuals12.3177999496525


Multiple Linear Regression - Actuals, Interpolation, and Residuals
Time or IndexActualsInterpolationForecastResidualsPrediction Error
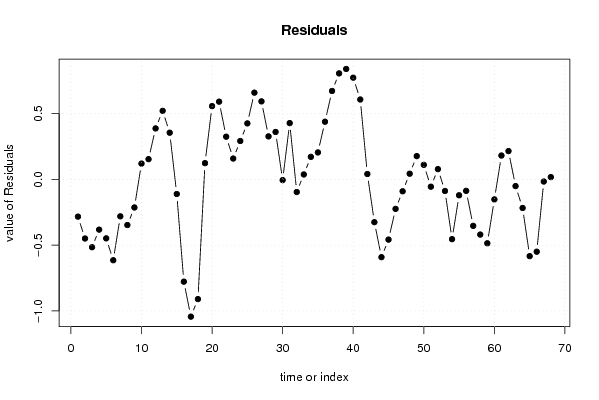
17.88.08309269016268-0.283092690162677
27.68.04938113447442-0.449381134474422
37.58.01566957878616-0.515669578786158
47.67.98195802309789-0.381958023097892
57.57.94824646740963-0.448246467409627
67.37.91453491172136-0.614534911721362
77.67.8808233560331-0.280823356033097
87.57.84711180034483-0.347111800344831
97.67.81340024465657-0.213400244656566
107.97.77968868896830.120311311031700
117.97.745977133280040.154022866719965
128.17.712265577591770.387734422408229
138.27.67855402190350.521445978096494
1487.644842466215240.35515753378476
157.57.61113091052697-0.111130910526975
166.87.57741935483871-0.77741935483871
176.57.54370779915044-1.04370779915044
186.67.50999624346218-0.90999624346218
197.67.476284687773910.123715312226085
2087.442573132085650.557426867914351
2187.408861576397380.591138423602616
227.77.375150020709120.324849979290881
237.57.341438465020850.158561534979146
247.67.307726909332590.292273090667411
257.77.274015353644320.425984646355677
267.97.240303797956060.659696202043942
277.87.20659224226780.593407757732207
287.57.172880686579530.327119313420472
297.57.139169130891260.360830869108737
307.17.105457575203-0.00545757520299779
317.57.071746019514730.428253980485268
327.57.59599719157796-0.0959971915779622
337.67.56228563588970.0377143641103026
347.77.528574080201430.171425919798568
357.77.494862524513170.205137475486833
367.97.46115096882490.438849031175099
378.17.427439413136640.672560586863363
388.27.393727857448370.806272142551628
398.27.36001630176010.839983698239893
408.17.326304746071840.773695253928159
417.97.292593190383580.607406809616425
427.37.258881634695310.0411183653046893
436.97.22517007900705-0.325170079007045
446.67.19145852331878-0.59145852331878
456.77.15774696763051-0.457746967630515
466.97.12403541194225-0.224035411942249
4777.09032385625398-0.0903238562539847
487.17.056612300565720.0433876994342801
497.27.022900744877450.177099255122546
507.16.989189189189190.110810810810810
516.96.95547763350092-0.0554776335009237
5276.921766077812660.0782339221873412
536.86.88805452212439-0.0880545221243938
546.46.85434296643613-0.454342966436128
556.76.82063141074786-0.120631410747863
566.76.7869198550596-0.086919855059598
576.46.75320829937133-0.353208299371333
586.36.71949674368307-0.419496743683068
596.26.6857851879948-0.485785187994802
606.56.65207363230654-0.152073632306537
616.86.618362076618270.181637923381727
626.86.584650520930.215349479069993
636.56.55093896524174-0.0509389652417421
646.36.51722740955348-0.217227409553477
655.96.48351585386521-0.583515853865211
665.96.44980429817695-0.549804298176946
676.46.41609274248868-0.0160927424886810
686.46.382381186800420.0176188131995841

\begin{tabular}{lllllllll}
\hline
Multiple Linear Regression - Actuals, Interpolation, and Residuals \tabularnewline
Time or Index & Actuals & InterpolationForecast & ResidualsPrediction Error \tabularnewline
1 & 7.8 & 8.08309269016268 & -0.283092690162677 \tabularnewline
2 & 7.6 & 8.04938113447442 & -0.449381134474422 \tabularnewline
3 & 7.5 & 8.01566957878616 & -0.515669578786158 \tabularnewline
4 & 7.6 & 7.98195802309789 & -0.381958023097892 \tabularnewline
5 & 7.5 & 7.94824646740963 & -0.448246467409627 \tabularnewline
6 & 7.3 & 7.91453491172136 & -0.614534911721362 \tabularnewline
7 & 7.6 & 7.8808233560331 & -0.280823356033097 \tabularnewline
8 & 7.5 & 7.84711180034483 & -0.347111800344831 \tabularnewline
9 & 7.6 & 7.81340024465657 & -0.213400244656566 \tabularnewline
10 & 7.9 & 7.7796886889683 & 0.120311311031700 \tabularnewline
11 & 7.9 & 7.74597713328004 & 0.154022866719965 \tabularnewline
12 & 8.1 & 7.71226557759177 & 0.387734422408229 \tabularnewline
13 & 8.2 & 7.6785540219035 & 0.521445978096494 \tabularnewline
14 & 8 & 7.64484246621524 & 0.35515753378476 \tabularnewline
15 & 7.5 & 7.61113091052697 & -0.111130910526975 \tabularnewline
16 & 6.8 & 7.57741935483871 & -0.77741935483871 \tabularnewline
17 & 6.5 & 7.54370779915044 & -1.04370779915044 \tabularnewline
18 & 6.6 & 7.50999624346218 & -0.90999624346218 \tabularnewline
19 & 7.6 & 7.47628468777391 & 0.123715312226085 \tabularnewline
20 & 8 & 7.44257313208565 & 0.557426867914351 \tabularnewline
21 & 8 & 7.40886157639738 & 0.591138423602616 \tabularnewline
22 & 7.7 & 7.37515002070912 & 0.324849979290881 \tabularnewline
23 & 7.5 & 7.34143846502085 & 0.158561534979146 \tabularnewline
24 & 7.6 & 7.30772690933259 & 0.292273090667411 \tabularnewline
25 & 7.7 & 7.27401535364432 & 0.425984646355677 \tabularnewline
26 & 7.9 & 7.24030379795606 & 0.659696202043942 \tabularnewline
27 & 7.8 & 7.2065922422678 & 0.593407757732207 \tabularnewline
28 & 7.5 & 7.17288068657953 & 0.327119313420472 \tabularnewline
29 & 7.5 & 7.13916913089126 & 0.360830869108737 \tabularnewline
30 & 7.1 & 7.105457575203 & -0.00545757520299779 \tabularnewline
31 & 7.5 & 7.07174601951473 & 0.428253980485268 \tabularnewline
32 & 7.5 & 7.59599719157796 & -0.0959971915779622 \tabularnewline
33 & 7.6 & 7.5622856358897 & 0.0377143641103026 \tabularnewline
34 & 7.7 & 7.52857408020143 & 0.171425919798568 \tabularnewline
35 & 7.7 & 7.49486252451317 & 0.205137475486833 \tabularnewline
36 & 7.9 & 7.4611509688249 & 0.438849031175099 \tabularnewline
37 & 8.1 & 7.42743941313664 & 0.672560586863363 \tabularnewline
38 & 8.2 & 7.39372785744837 & 0.806272142551628 \tabularnewline
39 & 8.2 & 7.3600163017601 & 0.839983698239893 \tabularnewline
40 & 8.1 & 7.32630474607184 & 0.773695253928159 \tabularnewline
41 & 7.9 & 7.29259319038358 & 0.607406809616425 \tabularnewline
42 & 7.3 & 7.25888163469531 & 0.0411183653046893 \tabularnewline
43 & 6.9 & 7.22517007900705 & -0.325170079007045 \tabularnewline
44 & 6.6 & 7.19145852331878 & -0.59145852331878 \tabularnewline
45 & 6.7 & 7.15774696763051 & -0.457746967630515 \tabularnewline
46 & 6.9 & 7.12403541194225 & -0.224035411942249 \tabularnewline
47 & 7 & 7.09032385625398 & -0.0903238562539847 \tabularnewline
48 & 7.1 & 7.05661230056572 & 0.0433876994342801 \tabularnewline
49 & 7.2 & 7.02290074487745 & 0.177099255122546 \tabularnewline
50 & 7.1 & 6.98918918918919 & 0.110810810810810 \tabularnewline
51 & 6.9 & 6.95547763350092 & -0.0554776335009237 \tabularnewline
52 & 7 & 6.92176607781266 & 0.0782339221873412 \tabularnewline
53 & 6.8 & 6.88805452212439 & -0.0880545221243938 \tabularnewline
54 & 6.4 & 6.85434296643613 & -0.454342966436128 \tabularnewline
55 & 6.7 & 6.82063141074786 & -0.120631410747863 \tabularnewline
56 & 6.7 & 6.7869198550596 & -0.086919855059598 \tabularnewline
57 & 6.4 & 6.75320829937133 & -0.353208299371333 \tabularnewline
58 & 6.3 & 6.71949674368307 & -0.419496743683068 \tabularnewline
59 & 6.2 & 6.6857851879948 & -0.485785187994802 \tabularnewline
60 & 6.5 & 6.65207363230654 & -0.152073632306537 \tabularnewline
61 & 6.8 & 6.61836207661827 & 0.181637923381727 \tabularnewline
62 & 6.8 & 6.58465052093 & 0.215349479069993 \tabularnewline
63 & 6.5 & 6.55093896524174 & -0.0509389652417421 \tabularnewline
64 & 6.3 & 6.51722740955348 & -0.217227409553477 \tabularnewline
65 & 5.9 & 6.48351585386521 & -0.583515853865211 \tabularnewline
66 & 5.9 & 6.44980429817695 & -0.549804298176946 \tabularnewline
67 & 6.4 & 6.41609274248868 & -0.0160927424886810 \tabularnewline
68 & 6.4 & 6.38238118680042 & 0.0176188131995841 \tabularnewline
\hline
\end{tabular}
%Source: https://freestatistics.org/blog/index.php?pk=25462&T=4

[TABLE]
[ROW][C]Multiple Linear Regression - Actuals, Interpolation, and Residuals[/C][/ROW]
[ROW][C]Time or Index[/C][C]Actuals[/C][C]InterpolationForecast[/C][C]ResidualsPrediction Error[/C][/ROW]
[ROW][C]1[/C][C]7.8[/C][C]8.08309269016268[/C][C]-0.283092690162677[/C][/ROW]
[ROW][C]2[/C][C]7.6[/C][C]8.04938113447442[/C][C]-0.449381134474422[/C][/ROW]
[ROW][C]3[/C][C]7.5[/C][C]8.01566957878616[/C][C]-0.515669578786158[/C][/ROW]
[ROW][C]4[/C][C]7.6[/C][C]7.98195802309789[/C][C]-0.381958023097892[/C][/ROW]
[ROW][C]5[/C][C]7.5[/C][C]7.94824646740963[/C][C]-0.448246467409627[/C][/ROW]
[ROW][C]6[/C][C]7.3[/C][C]7.91453491172136[/C][C]-0.614534911721362[/C][/ROW]
[ROW][C]7[/C][C]7.6[/C][C]7.8808233560331[/C][C]-0.280823356033097[/C][/ROW]
[ROW][C]8[/C][C]7.5[/C][C]7.84711180034483[/C][C]-0.347111800344831[/C][/ROW]
[ROW][C]9[/C][C]7.6[/C][C]7.81340024465657[/C][C]-0.213400244656566[/C][/ROW]
[ROW][C]10[/C][C]7.9[/C][C]7.7796886889683[/C][C]0.120311311031700[/C][/ROW]
[ROW][C]11[/C][C]7.9[/C][C]7.74597713328004[/C][C]0.154022866719965[/C][/ROW]
[ROW][C]12[/C][C]8.1[/C][C]7.71226557759177[/C][C]0.387734422408229[/C][/ROW]
[ROW][C]13[/C][C]8.2[/C][C]7.6785540219035[/C][C]0.521445978096494[/C][/ROW]
[ROW][C]14[/C][C]8[/C][C]7.64484246621524[/C][C]0.35515753378476[/C][/ROW]
[ROW][C]15[/C][C]7.5[/C][C]7.61113091052697[/C][C]-0.111130910526975[/C][/ROW]
[ROW][C]16[/C][C]6.8[/C][C]7.57741935483871[/C][C]-0.77741935483871[/C][/ROW]
[ROW][C]17[/C][C]6.5[/C][C]7.54370779915044[/C][C]-1.04370779915044[/C][/ROW]
[ROW][C]18[/C][C]6.6[/C][C]7.50999624346218[/C][C]-0.90999624346218[/C][/ROW]
[ROW][C]19[/C][C]7.6[/C][C]7.47628468777391[/C][C]0.123715312226085[/C][/ROW]
[ROW][C]20[/C][C]8[/C][C]7.44257313208565[/C][C]0.557426867914351[/C][/ROW]
[ROW][C]21[/C][C]8[/C][C]7.40886157639738[/C][C]0.591138423602616[/C][/ROW]
[ROW][C]22[/C][C]7.7[/C][C]7.37515002070912[/C][C]0.324849979290881[/C][/ROW]
[ROW][C]23[/C][C]7.5[/C][C]7.34143846502085[/C][C]0.158561534979146[/C][/ROW]
[ROW][C]24[/C][C]7.6[/C][C]7.30772690933259[/C][C]0.292273090667411[/C][/ROW]
[ROW][C]25[/C][C]7.7[/C][C]7.27401535364432[/C][C]0.425984646355677[/C][/ROW]
[ROW][C]26[/C][C]7.9[/C][C]7.24030379795606[/C][C]0.659696202043942[/C][/ROW]
[ROW][C]27[/C][C]7.8[/C][C]7.2065922422678[/C][C]0.593407757732207[/C][/ROW]
[ROW][C]28[/C][C]7.5[/C][C]7.17288068657953[/C][C]0.327119313420472[/C][/ROW]
[ROW][C]29[/C][C]7.5[/C][C]7.13916913089126[/C][C]0.360830869108737[/C][/ROW]
[ROW][C]30[/C][C]7.1[/C][C]7.105457575203[/C][C]-0.00545757520299779[/C][/ROW]
[ROW][C]31[/C][C]7.5[/C][C]7.07174601951473[/C][C]0.428253980485268[/C][/ROW]
[ROW][C]32[/C][C]7.5[/C][C]7.59599719157796[/C][C]-0.0959971915779622[/C][/ROW]
[ROW][C]33[/C][C]7.6[/C][C]7.5622856358897[/C][C]0.0377143641103026[/C][/ROW]
[ROW][C]34[/C][C]7.7[/C][C]7.52857408020143[/C][C]0.171425919798568[/C][/ROW]
[ROW][C]35[/C][C]7.7[/C][C]7.49486252451317[/C][C]0.205137475486833[/C][/ROW]
[ROW][C]36[/C][C]7.9[/C][C]7.4611509688249[/C][C]0.438849031175099[/C][/ROW]
[ROW][C]37[/C][C]8.1[/C][C]7.42743941313664[/C][C]0.672560586863363[/C][/ROW]
[ROW][C]38[/C][C]8.2[/C][C]7.39372785744837[/C][C]0.806272142551628[/C][/ROW]
[ROW][C]39[/C][C]8.2[/C][C]7.3600163017601[/C][C]0.839983698239893[/C][/ROW]
[ROW][C]40[/C][C]8.1[/C][C]7.32630474607184[/C][C]0.773695253928159[/C][/ROW]
[ROW][C]41[/C][C]7.9[/C][C]7.29259319038358[/C][C]0.607406809616425[/C][/ROW]
[ROW][C]42[/C][C]7.3[/C][C]7.25888163469531[/C][C]0.0411183653046893[/C][/ROW]
[ROW][C]43[/C][C]6.9[/C][C]7.22517007900705[/C][C]-0.325170079007045[/C][/ROW]
[ROW][C]44[/C][C]6.6[/C][C]7.19145852331878[/C][C]-0.59145852331878[/C][/ROW]
[ROW][C]45[/C][C]6.7[/C][C]7.15774696763051[/C][C]-0.457746967630515[/C][/ROW]
[ROW][C]46[/C][C]6.9[/C][C]7.12403541194225[/C][C]-0.224035411942249[/C][/ROW]
[ROW][C]47[/C][C]7[/C][C]7.09032385625398[/C][C]-0.0903238562539847[/C][/ROW]
[ROW][C]48[/C][C]7.1[/C][C]7.05661230056572[/C][C]0.0433876994342801[/C][/ROW]
[ROW][C]49[/C][C]7.2[/C][C]7.02290074487745[/C][C]0.177099255122546[/C][/ROW]
[ROW][C]50[/C][C]7.1[/C][C]6.98918918918919[/C][C]0.110810810810810[/C][/ROW]
[ROW][C]51[/C][C]6.9[/C][C]6.95547763350092[/C][C]-0.0554776335009237[/C][/ROW]
[ROW][C]52[/C][C]7[/C][C]6.92176607781266[/C][C]0.0782339221873412[/C][/ROW]
[ROW][C]53[/C][C]6.8[/C][C]6.88805452212439[/C][C]-0.0880545221243938[/C][/ROW]
[ROW][C]54[/C][C]6.4[/C][C]6.85434296643613[/C][C]-0.454342966436128[/C][/ROW]
[ROW][C]55[/C][C]6.7[/C][C]6.82063141074786[/C][C]-0.120631410747863[/C][/ROW]
[ROW][C]56[/C][C]6.7[/C][C]6.7869198550596[/C][C]-0.086919855059598[/C][/ROW]
[ROW][C]57[/C][C]6.4[/C][C]6.75320829937133[/C][C]-0.353208299371333[/C][/ROW]
[ROW][C]58[/C][C]6.3[/C][C]6.71949674368307[/C][C]-0.419496743683068[/C][/ROW]
[ROW][C]59[/C][C]6.2[/C][C]6.6857851879948[/C][C]-0.485785187994802[/C][/ROW]
[ROW][C]60[/C][C]6.5[/C][C]6.65207363230654[/C][C]-0.152073632306537[/C][/ROW]
[ROW][C]61[/C][C]6.8[/C][C]6.61836207661827[/C][C]0.181637923381727[/C][/ROW]
[ROW][C]62[/C][C]6.8[/C][C]6.58465052093[/C][C]0.215349479069993[/C][/ROW]
[ROW][C]63[/C][C]6.5[/C][C]6.55093896524174[/C][C]-0.0509389652417421[/C][/ROW]
[ROW][C]64[/C][C]6.3[/C][C]6.51722740955348[/C][C]-0.217227409553477[/C][/ROW]
[ROW][C]65[/C][C]5.9[/C][C]6.48351585386521[/C][C]-0.583515853865211[/C][/ROW]
[ROW][C]66[/C][C]5.9[/C][C]6.44980429817695[/C][C]-0.549804298176946[/C][/ROW]
[ROW][C]67[/C][C]6.4[/C][C]6.41609274248868[/C][C]-0.0160927424886810[/C][/ROW]
[ROW][C]68[/C][C]6.4[/C][C]6.38238118680042[/C][C]0.0176188131995841[/C][/ROW]
[/TABLE]
Source: https://freestatistics.org/blog/index.php?pk=25462&T=4

Globally Unique Identifier (entire table): ba.freestatistics.org/blog/index.php?pk=25462&T=4

As an alternative you can also use a QR Code:  

The GUIDs for individual cells are displayed in the table below:

Multiple Linear Regression - Actuals, Interpolation, and Residuals
Time or IndexActualsInterpolationForecastResidualsPrediction Error
17.88.08309269016268-0.283092690162677
27.68.04938113447442-0.449381134474422
37.58.01566957878616-0.515669578786158
47.67.98195802309789-0.381958023097892
57.57.94824646740963-0.448246467409627
67.37.91453491172136-0.614534911721362
77.67.8808233560331-0.280823356033097
87.57.84711180034483-0.347111800344831
97.67.81340024465657-0.213400244656566
107.97.77968868896830.120311311031700
117.97.745977133280040.154022866719965
128.17.712265577591770.387734422408229
138.27.67855402190350.521445978096494
1487.644842466215240.35515753378476
157.57.61113091052697-0.111130910526975
166.87.57741935483871-0.77741935483871
176.57.54370779915044-1.04370779915044
186.67.50999624346218-0.90999624346218
197.67.476284687773910.123715312226085
2087.442573132085650.557426867914351
2187.408861576397380.591138423602616
227.77.375150020709120.324849979290881
237.57.341438465020850.158561534979146
247.67.307726909332590.292273090667411
257.77.274015353644320.425984646355677
267.97.240303797956060.659696202043942
277.87.20659224226780.593407757732207
287.57.172880686579530.327119313420472
297.57.139169130891260.360830869108737
307.17.105457575203-0.00545757520299779
317.57.071746019514730.428253980485268
327.57.59599719157796-0.0959971915779622
337.67.56228563588970.0377143641103026
347.77.528574080201430.171425919798568
357.77.494862524513170.205137475486833
367.97.46115096882490.438849031175099
378.17.427439413136640.672560586863363
388.27.393727857448370.806272142551628
398.27.36001630176010.839983698239893
408.17.326304746071840.773695253928159
417.97.292593190383580.607406809616425
427.37.258881634695310.0411183653046893
436.97.22517007900705-0.325170079007045
446.67.19145852331878-0.59145852331878
456.77.15774696763051-0.457746967630515
466.97.12403541194225-0.224035411942249
4777.09032385625398-0.0903238562539847
487.17.056612300565720.0433876994342801
497.27.022900744877450.177099255122546
507.16.989189189189190.110810810810810
516.96.95547763350092-0.0554776335009237
5276.921766077812660.0782339221873412
536.86.88805452212439-0.0880545221243938
546.46.85434296643613-0.454342966436128
556.76.82063141074786-0.120631410747863
566.76.7869198550596-0.086919855059598
576.46.75320829937133-0.353208299371333
586.36.71949674368307-0.419496743683068
596.26.6857851879948-0.485785187994802
606.56.65207363230654-0.152073632306537
616.86.618362076618270.181637923381727
626.86.584650520930.215349479069993
636.56.55093896524174-0.0509389652417421
646.36.51722740955348-0.217227409553477
655.96.48351585386521-0.583515853865211
665.96.44980429817695-0.549804298176946
676.46.41609274248868-0.0160927424886810
686.46.382381186800420.0176188131995841


Parameters (Session):
par1 = 0 ; par2 = Do not include Seasonal Dummies ; par3 = Linear Trend ;
Parameters (R input):
par1 = 0 ; par2 = Do not include Seasonal Dummies ; par3 = Linear Trend ;
R code (references can be found in the software module):
library(lattice)
par1 <- as.numeric(par1)
x <- t(y)
k <- length(x[1,])
n <- length(x[,1])
x1 <- cbind(x[,par1], x[,1:k!=par1])
mycolnames <- c(colnames(x)[par1], colnames(x)[1:k!=par1])
colnames(x1) <- mycolnames #colnames(x)[par1]
x <- x1
if (par3 == 'First Differences'){
x2 <- array(0, dim=c(n-1,k), dimnames=list(1:(n-1), paste('(1-B)',colnames(x),sep='')))
for (i in 1:n-1) {
for (j in 1:k) {
x2[i,j] <- x[i+1,j] - x[i,j]
}
}
x <- x2
}
if (par2 == 'Include Monthly Dummies'){
x2 <- array(0, dim=c(n,11), dimnames=list(1:n, paste('M', seq(1:11), sep ='')))
for (i in 1:11){
x2[seq(i,n,12),i] <- 1
}
x <- cbind(x, x2)
}
if (par2 == 'Include Quarterly Dummies'){
x2 <- array(0, dim=c(n,3), dimnames=list(1:n, paste('Q', seq(1:3), sep ='')))
for (i in 1:3){
x2[seq(i,n,4),i] <- 1
}
x <- cbind(x, x2)
}
k <- length(x[1,])
if (par3 == 'Linear Trend'){
x <- cbind(x, c(1:n))
colnames(x)[k+1] <- 't'
}
x
k <- length(x[1,])
df <- as.data.frame(x)
(mylm <- lm(df))
(mysum <- summary(mylm))
bitmap(file='test0.png')
plot(x[,1], type='l', main='Actuals and Interpolation', ylab='value of Actuals and Interpolation (dots)', xlab='time or index')
points(x[,1]-mysum$resid)
grid()
dev.off()
bitmap(file='test1.png')
plot(mysum$resid, type='b', pch=19, main='Residuals', ylab='value of Residuals', xlab='time or index')
grid()
dev.off()
bitmap(file='test2.png')
hist(mysum$resid, main='Residual Histogram', xlab='values of Residuals')
grid()
dev.off()
bitmap(file='test3.png')
densityplot(~mysum$resid,col='black',main='Residual Density Plot', xlab='values of Residuals')
dev.off()
bitmap(file='test4.png')
qqnorm(mysum$resid, main='Residual Normal Q-Q Plot')
grid()
dev.off()
(myerror <- as.ts(mysum$resid))
bitmap(file='test5.png')
dum <- cbind(lag(myerror,k=1),myerror)
dum
dum1 <- dum[2:length(myerror),]
dum1
z <- as.data.frame(dum1)
z
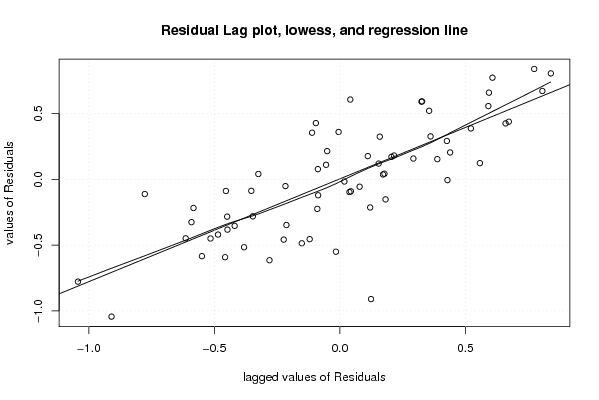
plot(z,main=paste('Residual Lag plot, lowess, and regression line'), ylab='values of Residuals', xlab='lagged values of Residuals')
lines(lowess(z))
abline(lm(z))
grid()
dev.off()
bitmap(file='test6.png')
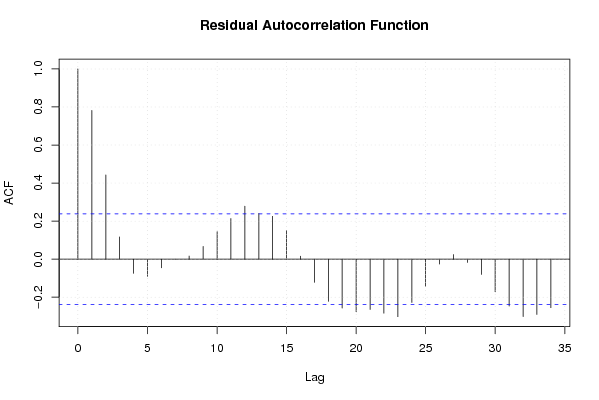
acf(mysum$resid, lag.max=length(mysum$resid)/2, main='Residual Autocorrelation Function')
grid()
dev.off()
bitmap(file='test7.png')
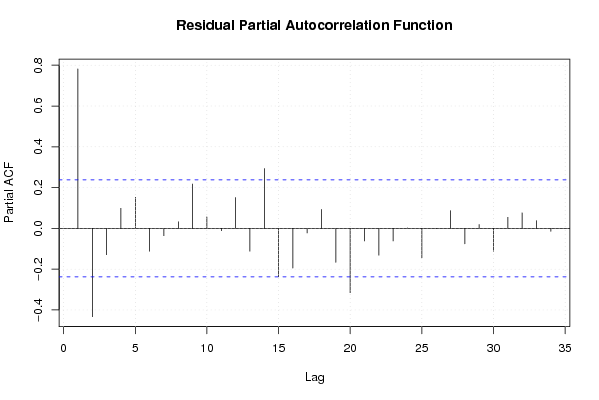
pacf(mysum$resid, lag.max=length(mysum$resid)/2, main='Residual Partial Autocorrelation Function')
grid()
dev.off()
bitmap(file='test8.png')
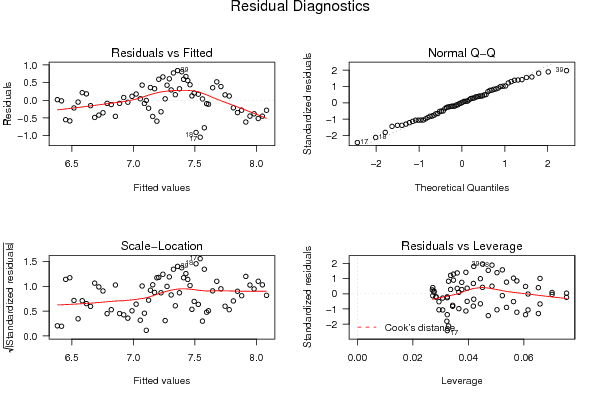
opar <- par(mfrow = c(2,2), oma = c(0, 0, 1.1, 0))
plot(mylm, las = 1, sub='Residual Diagnostics')
par(opar)
dev.off()
load(file='createtable')
a<-table.start()
a<-table.row.start(a)
a<-table.element(a, 'Multiple Linear Regression - Estimated Regression Equation', 1, TRUE)
a<-table.row.end(a)
myeq <- colnames(x)[1]
myeq <- paste(myeq, '[t] = ', sep='')
for (i in 1:k){
if (mysum$coefficients[i,1] > 0) myeq <- paste(myeq, '+', '')
myeq <- paste(myeq, mysum$coefficients[i,1], sep=' ')
if (rownames(mysum$coefficients)[i] != '(Intercept)') {
myeq <- paste(myeq, rownames(mysum$coefficients)[i], sep='')
if (rownames(mysum$coefficients)[i] != 't') myeq <- paste(myeq, '[t]', sep='')
}
}
myeq <- paste(myeq, ' + e[t]')
a<-table.row.start(a)
a<-table.element(a, myeq)
a<-table.row.end(a)
a<-table.end(a)
table.save(a,file='mytable1.tab')
a<-table.start()
a<-table.row.start(a)
a<-table.element(a,hyperlink('ols1.htm','Multiple Linear Regression - Ordinary Least Squares',''), 6, TRUE)
a<-table.row.end(a)
a<-table.row.start(a)
a<-table.element(a,'Variable',header=TRUE)
a<-table.element(a,'Parameter',header=TRUE)
a<-table.element(a,'S.D.',header=TRUE)
a<-table.element(a,'T-STAT
H0: parameter = 0',header=TRUE)
a<-table.element(a,'2-tail p-value',header=TRUE)
a<-table.element(a,'1-tail p-value',header=TRUE)
a<-table.row.end(a)
for (i in 1:k){
a<-table.row.start(a)
a<-table.element(a,rownames(mysum$coefficients)[i],header=TRUE)
a<-table.element(a,mysum$coefficients[i,1])
a<-table.element(a, round(mysum$coefficients[i,2],6))
a<-table.element(a, round(mysum$coefficients[i,3],4))
a<-table.element(a, round(mysum$coefficients[i,4],6))
a<-table.element(a, round(mysum$coefficients[i,4]/2,6))
a<-table.row.end(a)
}
a<-table.end(a)
table.save(a,file='mytable2.tab')
a<-table.start()
a<-table.row.start(a)
a<-table.element(a, 'Multiple Linear Regression - Regression Statistics', 2, TRUE)
a<-table.row.end(a)
a<-table.row.start(a)
a<-table.element(a, 'Multiple R',1,TRUE)
a<-table.element(a, sqrt(mysum$r.squared))
a<-table.row.end(a)
a<-table.row.start(a)
a<-table.element(a, 'R-squared',1,TRUE)
a<-table.element(a, mysum$r.squared)
a<-table.row.end(a)
a<-table.row.start(a)
a<-table.element(a, 'Adjusted R-squared',1,TRUE)
a<-table.element(a, mysum$adj.r.squared)
a<-table.row.end(a)
a<-table.row.start(a)
a<-table.element(a, 'F-TEST (value)',1,TRUE)
a<-table.element(a, mysum$fstatistic[1])
a<-table.row.end(a)
a<-table.row.start(a)
a<-table.element(a, 'F-TEST (DF numerator)',1,TRUE)
a<-table.element(a, mysum$fstatistic[2])
a<-table.row.end(a)
a<-table.row.start(a)
a<-table.element(a, 'F-TEST (DF denominator)',1,TRUE)
a<-table.element(a, mysum$fstatistic[3])
a<-table.row.end(a)
a<-table.row.start(a)
a<-table.element(a, 'p-value',1,TRUE)
a<-table.element(a, 1-pf(mysum$fstatistic[1],mysum$fstatistic[2],mysum$fstatistic[3]))
a<-table.row.end(a)
a<-table.row.start(a)
a<-table.element(a, 'Multiple Linear Regression - Residual Statistics', 2, TRUE)
a<-table.row.end(a)
a<-table.row.start(a)
a<-table.element(a, 'Residual Standard Deviation',1,TRUE)
a<-table.element(a, mysum$sigma)
a<-table.row.end(a)
a<-table.row.start(a)
a<-table.element(a, 'Sum Squared Residuals',1,TRUE)
a<-table.element(a, sum(myerror*myerror))
a<-table.row.end(a)
a<-table.end(a)
table.save(a,file='mytable3.tab')
a<-table.start()
a<-table.row.start(a)
a<-table.element(a, 'Multiple Linear Regression - Actuals, Interpolation, and Residuals', 4, TRUE)
a<-table.row.end(a)
a<-table.row.start(a)
a<-table.element(a, 'Time or Index', 1, TRUE)
a<-table.element(a, 'Actuals', 1, TRUE)
a<-table.element(a, 'Interpolation
Forecast', 1, TRUE)
a<-table.element(a, 'Residuals
Prediction Error', 1, TRUE)
a<-table.row.end(a)
for (i in 1:n) {
a<-table.row.start(a)
a<-table.element(a,i, 1, TRUE)
a<-table.element(a,x[i])
a<-table.element(a,x[i]-mysum$resid[i])
a<-table.element(a,mysum$resid[i])
a<-table.row.end(a)
}
a<-table.end(a)
table.save(a,file='mytable4.tab')