Free Statistics

of Irreproducible Research!

Author's title

Author*The author of this computation has been verified*
R Software Modulerwasp_multipleregression.wasp
Title produced by softwareMultiple Regression
Date of computationMon, 24 Nov 2008 09:55:22 -0700
Cite this page as followsStatistical Computations at FreeStatistics.org, Office for Research Development and Education, URL https://freestatistics.org/blog/index.php?v=date/2008/Nov/24/t1227545841cfw1rpry8kmsolz.htm/, Retrieved Mon, 13 May 2024 23:48:14 +0000
Statistical Computations at FreeStatistics.org, Office for Research Development and Education, URL https://freestatistics.org/blog/index.php?pk=25458, Retrieved Mon, 13 May 2024 23:48:14 +0000
QR Codes:

Original text written by user:
IsPrivate?No (this computation is public)
User-defined keywords
Estimated Impact141
Family? (F = Feedback message, R = changed R code, M = changed R Module, P = changed Parameters, D = changed Data)
-     [Multiple Regression] [] [2007-11-19 19:32:02] [67b13204f89b924d7c99654a63d4e682]
F    D    [Multiple Regression] [seatbelt] [2008-11-24 16:55:22] [3ebad5d90a5c8606f133189c73066208] [Current]
Feedback Forum
2008-11-27 16:14:04 [Matthieu Blondeau] [reply
Men kan hier zeggen dat de parameters niet significant kleiner of verschillend zijn van 0. De T-STAT zijn altijd kleiner dan de absolute waarde van 2. De p-waarden zijn ook telkens groter dan 5%.

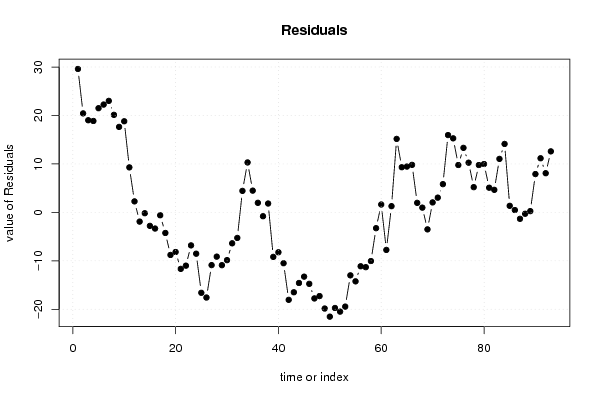
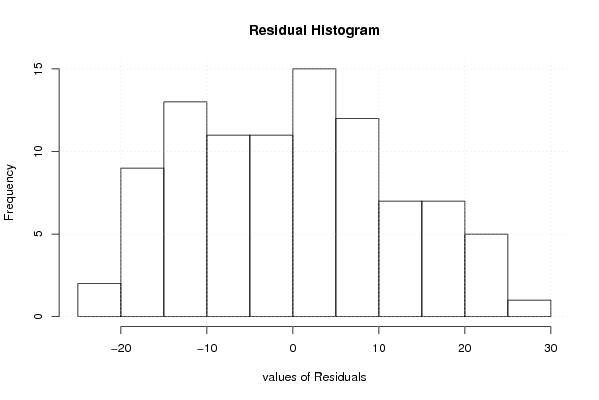
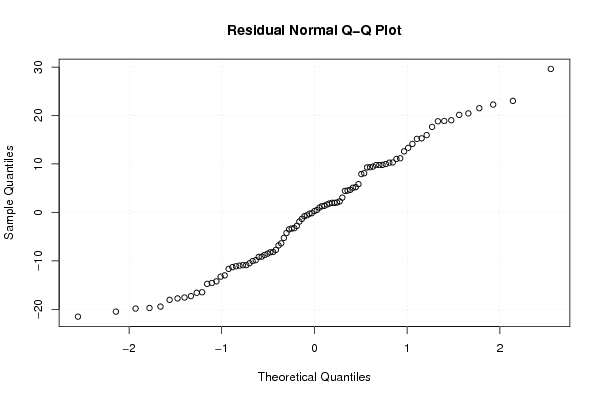
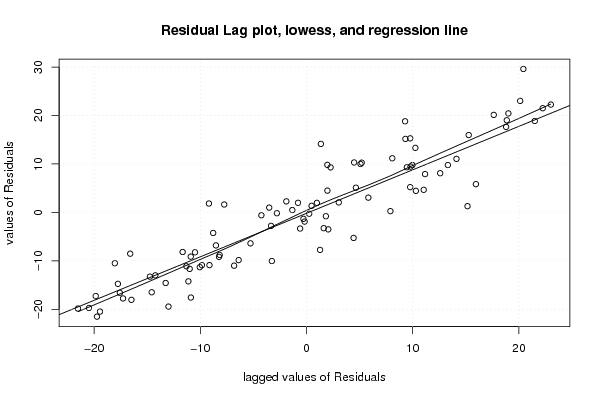
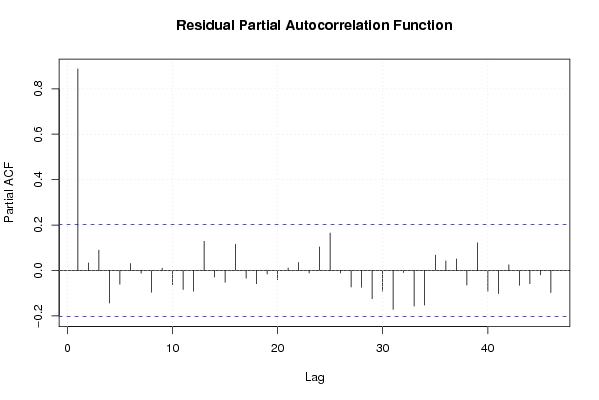
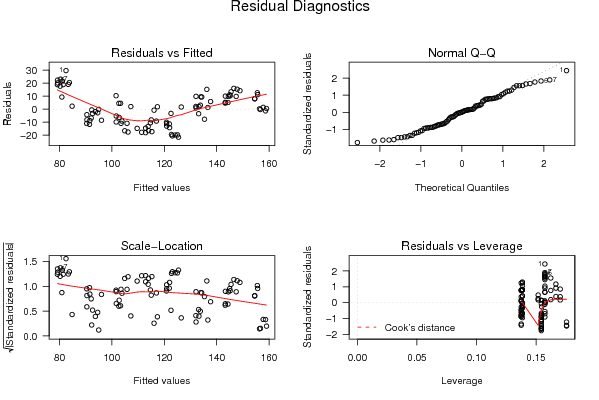
De residuals komen ook niet samen met de 0-lijn, dus het gemiddelde is niet gelijk aan 0. Er is sprake van autocorrelatie, er is evenwel geen patroon terug te vinden maar correlatie is aanwezig. De histogram en de density plot vertonen geen normale verdeling.

Dit model is dus niet geslaagd.
2008-11-30 15:41:19 [Evelyn Ongena] [reply
de student heeft een analyse proberen te maken betreffende de wijziging in het verbuik van grondstoffen. En eerlijk gezegd heeft de student wel een goed punt aangehaald betreffende dit onderwerp. Ook het toeval is veel te groot om tot een goed model te leiden. De student vergeet echter wel een conclusie te formuleren over de voorwaarden waaraan moet voldaan worden. Zo is er geen autocorrelatie terug te vinden maar is het gemiddelde niet constant en niet gelijk aan nul. Bijgevolg kunnen we hier niet over een goed model spreken.
2008-12-01 22:52:23 [Martjin De Swert] [reply
Ik kan mij niet anders dan aanssluiten bij al het vorige. Het gehanteerde model is niet geldig. Er is geen autocorrelatie aanwezig, geen gemiddelde dat gelijk is aan 0 en de grafieken duiden niet op een normale verdeling.

Post a new message
Dataseries X:
112,1	0
104,2	0
102,4	0
100,3	0
102,6	0
101,5	0
103,4	0
99,4	0
97,9	0
98	0
90,2	0
87,1	0
91,8	0
94,8	0
91,8	0
89,3	0
91,7	0
86,2	0
82,8	0
82,3	0
79,8	0
79,4	0
85,3	0
87,5	0
88,3	0
88,6	0
94,9	0
94,7	0
92,6	0
91,8	0
96,4	0
96,4	0
107,1	0
111,9	0
107,8	0
109,2	0
115,3	0
119,2	0
107,8	0
106,8	0
104,2	0
94,8	0
97,5	0
98,3	0
100,6	0
94,9	1
93,6	1
98	1
104,3	1
103,9	1
105,3	1
102,6	1
103,3	1
107,9	1
107,8	1
109,8	1
110,6	1
110,8	1
119,3	1
128,1	1
127,6	1
137,9	1
151,4	1
143,6	1
143,4	1
141,9	1
135,2	1
133,1	1
129,6	1
134,1	1
136,8	1
143,5	1
162,5	1
163,1	1
157,2	1
158,8	1
155,4	1
148,5	1
154,2	1
153,3	1
149,4	1
147,9	1
156	1
163	1
159,1	1
159,5	1
157,3	1
156,4	1
156,6	1
162,4	1
166,8	1
162,6	1
168,1	1


Summary of computational transaction
Raw Inputview raw input (R code)
Raw Outputview raw output of R engine
Computing time3 seconds
R Server'George Udny Yule' @ 72.249.76.132

\begin{tabular}{lllllllll}
\hline
Summary of computational transaction \tabularnewline
Raw Input & view raw input (R code)  \tabularnewline
Raw Output & view raw output of R engine  \tabularnewline
Computing time & 3 seconds \tabularnewline
R Server & 'George Udny Yule' @ 72.249.76.132 \tabularnewline
\hline
\end{tabular}
%Source: https://freestatistics.org/blog/index.php?pk=25458&T=0

[TABLE]
[ROW][C]Summary of computational transaction[/C][/ROW]
[ROW][C]Raw Input[/C][C]view raw input (R code) [/C][/ROW]
[ROW][C]Raw Output[/C][C]view raw output of R engine [/C][/ROW]
[ROW][C]Computing time[/C][C]3 seconds[/C][/ROW]
[ROW][C]R Server[/C][C]'George Udny Yule' @ 72.249.76.132[/C][/ROW]
[/TABLE]
Source: https://freestatistics.org/blog/index.php?pk=25458&T=0

Globally Unique Identifier (entire table): ba.freestatistics.org/blog/index.php?pk=25458&T=0

As an alternative you can also use a QR Code:  

The GUIDs for individual cells are displayed in the table below:

Summary of computational transaction
Raw Inputview raw input (R code)
Raw Outputview raw output of R engine
Computing time3 seconds
R Server'George Udny Yule' @ 72.249.76.132


Multiple Linear Regression - Estimated Regression Equation
genotsmiddelen[t] = + 73.6306878306878 -3.15231481481482uitvoersubsidie[t] + 7.93784722222222M1[t] + 8.27953042328043M2[t] + 6.95871362433864M3[t] + 4.07539682539685M4[t] + 2.80458002645505M5[t] + 0.0212632275132471M6[t] + 0.225446428571446M7[t] -1.82037037037036M8[t] -1.76618716931215M9[t] -3.76193783068781M10[t] -2.98096891534390M11[t] + 0.9333167989418t + e[t]

\begin{tabular}{lllllllll}
\hline
Multiple Linear Regression - Estimated Regression Equation \tabularnewline
genotsmiddelen[t] =  +  73.6306878306878 -3.15231481481482uitvoersubsidie[t] +  7.93784722222222M1[t] +  8.27953042328043M2[t] +  6.95871362433864M3[t] +  4.07539682539685M4[t] +  2.80458002645505M5[t] +  0.0212632275132471M6[t] +  0.225446428571446M7[t] -1.82037037037036M8[t] -1.76618716931215M9[t] -3.76193783068781M10[t] -2.98096891534390M11[t] +  0.9333167989418t  + e[t] \tabularnewline
\hline
\end{tabular}
%Source: https://freestatistics.org/blog/index.php?pk=25458&T=1

[TABLE]
[ROW][C]Multiple Linear Regression - Estimated Regression Equation[/C][/ROW]
[ROW][C]genotsmiddelen[t] =  +  73.6306878306878 -3.15231481481482uitvoersubsidie[t] +  7.93784722222222M1[t] +  8.27953042328043M2[t] +  6.95871362433864M3[t] +  4.07539682539685M4[t] +  2.80458002645505M5[t] +  0.0212632275132471M6[t] +  0.225446428571446M7[t] -1.82037037037036M8[t] -1.76618716931215M9[t] -3.76193783068781M10[t] -2.98096891534390M11[t] +  0.9333167989418t  + e[t][/C][/ROW]
[/TABLE]
Source: https://freestatistics.org/blog/index.php?pk=25458&T=1

Globally Unique Identifier (entire table): ba.freestatistics.org/blog/index.php?pk=25458&T=1

As an alternative you can also use a QR Code:  

The GUIDs for individual cells are displayed in the table below:

Multiple Linear Regression - Estimated Regression Equation
genotsmiddelen[t] = + 73.6306878306878 -3.15231481481482uitvoersubsidie[t] + 7.93784722222222M1[t] + 8.27953042328043M2[t] + 6.95871362433864M3[t] + 4.07539682539685M4[t] + 2.80458002645505M5[t] + 0.0212632275132471M6[t] + 0.225446428571446M7[t] -1.82037037037036M8[t] -1.76618716931215M9[t] -3.76193783068781M10[t] -2.98096891534390M11[t] + 0.9333167989418t + e[t]


Multiple Linear Regression - Ordinary Least Squares
VariableParameterS.D.T-STATH0: parameter = 02-tail p-value1-tail p-value
(Intercept)73.63068783068785.68879312.943100
uitvoersubsidie-3.152314814814825.581109-0.56480.5737970.286899
M17.937847222222226.8467861.15940.2498040.124902
M28.279530423280436.844941.20960.2300460.115023
M36.958713624338646.8446761.01670.3124180.156209
M44.075396825396856.8459950.59530.5533470.276673
M52.804580026455056.8488960.40950.6832860.341643
M60.02126322751324716.8533770.00310.9975320.498766
M70.2254464285714466.8594350.03290.9738640.486932
M8-1.820370370370366.867066-0.26510.7916330.395816
M9-1.766187169312156.876265-0.25690.797960.39898
M10-3.761937830687817.069219-0.53220.596110.298055
M11-2.980968915343907.06692-0.42180.6743020.337151
t0.93331679894180.1040948.966100

\begin{tabular}{lllllllll}
\hline
Multiple Linear Regression - Ordinary Least Squares \tabularnewline
Variable & Parameter & S.D. & T-STATH0: parameter = 0 & 2-tail p-value & 1-tail p-value \tabularnewline
(Intercept) & 73.6306878306878 & 5.688793 & 12.9431 & 0 & 0 \tabularnewline
uitvoersubsidie & -3.15231481481482 & 5.581109 & -0.5648 & 0.573797 & 0.286899 \tabularnewline
M1 & 7.93784722222222 & 6.846786 & 1.1594 & 0.249804 & 0.124902 \tabularnewline
M2 & 8.27953042328043 & 6.84494 & 1.2096 & 0.230046 & 0.115023 \tabularnewline
M3 & 6.95871362433864 & 6.844676 & 1.0167 & 0.312418 & 0.156209 \tabularnewline
M4 & 4.07539682539685 & 6.845995 & 0.5953 & 0.553347 & 0.276673 \tabularnewline
M5 & 2.80458002645505 & 6.848896 & 0.4095 & 0.683286 & 0.341643 \tabularnewline
M6 & 0.0212632275132471 & 6.853377 & 0.0031 & 0.997532 & 0.498766 \tabularnewline
M7 & 0.225446428571446 & 6.859435 & 0.0329 & 0.973864 & 0.486932 \tabularnewline
M8 & -1.82037037037036 & 6.867066 & -0.2651 & 0.791633 & 0.395816 \tabularnewline
M9 & -1.76618716931215 & 6.876265 & -0.2569 & 0.79796 & 0.39898 \tabularnewline
M10 & -3.76193783068781 & 7.069219 & -0.5322 & 0.59611 & 0.298055 \tabularnewline
M11 & -2.98096891534390 & 7.06692 & -0.4218 & 0.674302 & 0.337151 \tabularnewline
t & 0.9333167989418 & 0.104094 & 8.9661 & 0 & 0 \tabularnewline
\hline
\end{tabular}
%Source: https://freestatistics.org/blog/index.php?pk=25458&T=2

[TABLE]
[ROW][C]Multiple Linear Regression - Ordinary Least Squares[/C][/ROW]
[ROW][C]Variable[/C][C]Parameter[/C][C]S.D.[/C][C]T-STATH0: parameter = 0[/C][C]2-tail p-value[/C][C]1-tail p-value[/C][/ROW]
[ROW][C](Intercept)[/C][C]73.6306878306878[/C][C]5.688793[/C][C]12.9431[/C][C]0[/C][C]0[/C][/ROW]
[ROW][C]uitvoersubsidie[/C][C]-3.15231481481482[/C][C]5.581109[/C][C]-0.5648[/C][C]0.573797[/C][C]0.286899[/C][/ROW]
[ROW][C]M1[/C][C]7.93784722222222[/C][C]6.846786[/C][C]1.1594[/C][C]0.249804[/C][C]0.124902[/C][/ROW]
[ROW][C]M2[/C][C]8.27953042328043[/C][C]6.84494[/C][C]1.2096[/C][C]0.230046[/C][C]0.115023[/C][/ROW]
[ROW][C]M3[/C][C]6.95871362433864[/C][C]6.844676[/C][C]1.0167[/C][C]0.312418[/C][C]0.156209[/C][/ROW]
[ROW][C]M4[/C][C]4.07539682539685[/C][C]6.845995[/C][C]0.5953[/C][C]0.553347[/C][C]0.276673[/C][/ROW]
[ROW][C]M5[/C][C]2.80458002645505[/C][C]6.848896[/C][C]0.4095[/C][C]0.683286[/C][C]0.341643[/C][/ROW]
[ROW][C]M6[/C][C]0.0212632275132471[/C][C]6.853377[/C][C]0.0031[/C][C]0.997532[/C][C]0.498766[/C][/ROW]
[ROW][C]M7[/C][C]0.225446428571446[/C][C]6.859435[/C][C]0.0329[/C][C]0.973864[/C][C]0.486932[/C][/ROW]
[ROW][C]M8[/C][C]-1.82037037037036[/C][C]6.867066[/C][C]-0.2651[/C][C]0.791633[/C][C]0.395816[/C][/ROW]
[ROW][C]M9[/C][C]-1.76618716931215[/C][C]6.876265[/C][C]-0.2569[/C][C]0.79796[/C][C]0.39898[/C][/ROW]
[ROW][C]M10[/C][C]-3.76193783068781[/C][C]7.069219[/C][C]-0.5322[/C][C]0.59611[/C][C]0.298055[/C][/ROW]
[ROW][C]M11[/C][C]-2.98096891534390[/C][C]7.06692[/C][C]-0.4218[/C][C]0.674302[/C][C]0.337151[/C][/ROW]
[ROW][C]t[/C][C]0.9333167989418[/C][C]0.104094[/C][C]8.9661[/C][C]0[/C][C]0[/C][/ROW]
[/TABLE]
Source: https://freestatistics.org/blog/index.php?pk=25458&T=2

Globally Unique Identifier (entire table): ba.freestatistics.org/blog/index.php?pk=25458&T=2

As an alternative you can also use a QR Code:  

The GUIDs for individual cells are displayed in the table below:

Multiple Linear Regression - Ordinary Least Squares
VariableParameterS.D.T-STATH0: parameter = 02-tail p-value1-tail p-value
(Intercept)73.63068783068785.68879312.943100
uitvoersubsidie-3.152314814814825.581109-0.56480.5737970.286899
M17.937847222222226.8467861.15940.2498040.124902
M28.279530423280436.844941.20960.2300460.115023
M36.958713624338646.8446761.01670.3124180.156209
M44.075396825396856.8459950.59530.5533470.276673
M52.804580026455056.8488960.40950.6832860.341643
M60.02126322751324716.8533770.00310.9975320.498766
M70.2254464285714466.8594350.03290.9738640.486932
M8-1.820370370370366.867066-0.26510.7916330.395816
M9-1.766187169312156.876265-0.25690.797960.39898
M10-3.761937830687817.069219-0.53220.596110.298055
M11-2.980968915343907.06692-0.42180.6743020.337151
t0.93331679894180.1040948.966100


Multiple Linear Regression - Regression Statistics
Multiple R0.890002599298968
R-squared0.79210462675892
Adjusted R-squared0.757893995719248
F-TEST (value)23.1537566740694
F-TEST (DF numerator)13
F-TEST (DF denominator)79
p-value0
Multiple Linear Regression - Residual Statistics
Residual Standard Deviation13.2195614704814
Sum Squared Residuals13805.7876322751

\begin{tabular}{lllllllll}
\hline
Multiple Linear Regression - Regression Statistics \tabularnewline
Multiple R & 0.890002599298968 \tabularnewline
R-squared & 0.79210462675892 \tabularnewline
Adjusted R-squared & 0.757893995719248 \tabularnewline
F-TEST (value) & 23.1537566740694 \tabularnewline
F-TEST (DF numerator) & 13 \tabularnewline
F-TEST (DF denominator) & 79 \tabularnewline
p-value & 0 \tabularnewline
Multiple Linear Regression - Residual Statistics \tabularnewline
Residual Standard Deviation & 13.2195614704814 \tabularnewline
Sum Squared Residuals & 13805.7876322751 \tabularnewline
\hline
\end{tabular}
%Source: https://freestatistics.org/blog/index.php?pk=25458&T=3

[TABLE]
[ROW][C]Multiple Linear Regression - Regression Statistics[/C][/ROW]
[ROW][C]Multiple R[/C][C]0.890002599298968[/C][/ROW]
[ROW][C]R-squared[/C][C]0.79210462675892[/C][/ROW]
[ROW][C]Adjusted R-squared[/C][C]0.757893995719248[/C][/ROW]
[ROW][C]F-TEST (value)[/C][C]23.1537566740694[/C][/ROW]
[ROW][C]F-TEST (DF numerator)[/C][C]13[/C][/ROW]
[ROW][C]F-TEST (DF denominator)[/C][C]79[/C][/ROW]
[ROW][C]p-value[/C][C]0[/C][/ROW]
[ROW][C]Multiple Linear Regression - Residual Statistics[/C][/ROW]
[ROW][C]Residual Standard Deviation[/C][C]13.2195614704814[/C][/ROW]
[ROW][C]Sum Squared Residuals[/C][C]13805.7876322751[/C][/ROW]
[/TABLE]
Source: https://freestatistics.org/blog/index.php?pk=25458&T=3

Globally Unique Identifier (entire table): ba.freestatistics.org/blog/index.php?pk=25458&T=3

As an alternative you can also use a QR Code:  

The GUIDs for individual cells are displayed in the table below:

Multiple Linear Regression - Regression Statistics
Multiple R0.890002599298968
R-squared0.79210462675892
Adjusted R-squared0.757893995719248
F-TEST (value)23.1537566740694
F-TEST (DF numerator)13
F-TEST (DF denominator)79
p-value0
Multiple Linear Regression - Residual Statistics
Residual Standard Deviation13.2195614704814
Sum Squared Residuals13805.7876322751


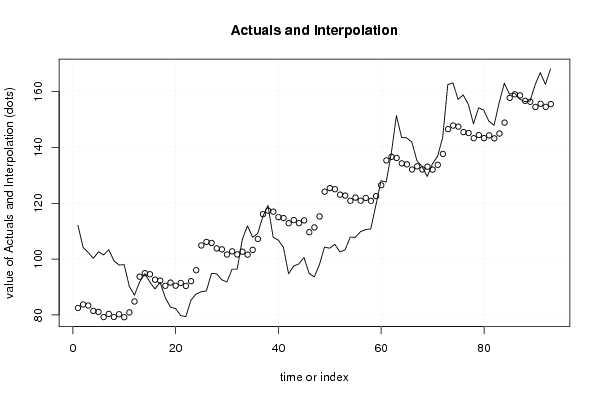
Multiple Linear Regression - Actuals, Interpolation, and Residuals
Time or IndexActualsInterpolationForecastResidualsPrediction Error
1112.182.50185185185229.598148148148
2104.283.776851851851820.4231481481482
3102.483.389351851851919.0106481481481
4100.381.439351851851818.8606481481482
5102.681.101851851851821.4981481481481
6101.579.251851851851822.2481481481482
7103.480.389351851851823.0106481481482
899.479.276851851851820.1231481481482
997.980.264351851851917.6356481481482
109879.20191798941818.7980820105820
1190.280.91620370370379.2837962962963
1287.184.83048941798942.26951058201060
1391.893.7016534391534-1.90165343915343
1494.894.9766534391534-0.176653439153407
1591.894.5891534391534-2.78915343915344
1689.392.6391534391534-3.33915343915345
1791.792.3016534391534-0.601653439153434
1886.290.4516534391534-4.25165343915343
1982.891.5891534391534-8.78915343915343
2082.390.4766534391534-8.17665343915343
2179.891.4641534391534-11.6641534391534
2279.490.4017195767196-11.0017195767196
2385.392.1160052910053-6.8160052910053
2487.596.030291005291-8.53029100529098
2588.3104.901455026455-16.601455026455
2688.6106.176455026455-17.5764550264550
2794.9105.788955026455-10.8889550264550
2894.7103.838955026455-9.13895502645503
2992.6103.501455026455-10.9014550264550
3091.8101.651455026455-9.85145502645503
3196.4102.788955026455-6.38895502645502
3296.4101.676455026455-5.27645502645502
33107.1102.6639550264554.43604497354497
34111.9101.60152116402110.2984788359788
35107.8103.3158068783074.48419312169312
36109.2107.2300925925931.96990740740743
37115.3116.101256613757-0.801256613756592
38119.2117.3762566137571.82374338624339
39107.8116.988756613757-9.18875661375662
40106.8115.038756613757-8.23875661375663
41104.2114.701256613757-10.5012566137566
4294.8112.851256613757-18.0512566137566
4397.5113.988756613757-16.4887566137566
4498.3112.876256613757-14.5762566137566
45100.6113.863756613757-13.2637566137566
4694.9109.649007936508-14.7490079365079
4793.6111.363293650794-17.7632936507936
4898115.277579365079-17.2775793650793
49104.3124.148743386243-19.8487433862434
50103.9125.423743386243-21.5237433862434
51105.3125.036243386243-19.7362433862434
52102.6123.086243386243-20.4862433862434
53103.3122.748743386243-19.4487433862434
54107.9120.898743386243-12.9987433862434
55107.8122.036243386243-14.2362433862434
56109.8120.923743386243-11.1237433862434
57110.6121.911243386243-11.3112433862434
58110.8120.848809523810-10.0488095238095
59119.3122.563095238095-3.26309523809524
60128.1126.4773809523811.62261904761906
61127.6135.348544973545-7.74854497354495
62137.9136.6235449735451.27645502645504
63151.4136.23604497354515.1639550264550
64143.6134.2860449735459.31395502645501
65143.4133.9485449735459.45145502645503
66141.9132.0985449735459.80145502645503
67135.2133.2360449735451.96395502645501
68133.1132.1235449735450.976455026455022
69129.6133.111044973545-3.51104497354498
70134.1132.0486111111112.05138888888887
71136.8133.7628968253973.03710317460318
72143.5137.6771825396835.82281746031748
73162.5146.54834656084715.9516534391535
74163.1147.82334656084715.2766534391534
75157.2147.4358465608479.76415343915342
76158.8145.48584656084713.3141534391534
77155.4145.14834656084710.2516534391534
78148.5143.2983465608475.20165343915343
79154.2144.4358465608479.76415343915342
80153.3143.3233465608479.97665343915345
81149.4144.3108465608475.08915343915345
82147.9143.2484126984134.65158730158729
83156144.96269841269811.0373015873016
84163148.87698412698414.1230158730159
85159.1157.7481481481481.35185185185187
86159.5159.0231481481480.476851851851852
87157.3158.635648148148-1.33564814814815
88156.4156.685648148148-0.285648148148153
89156.6156.3481481481480.251851851851833
90162.4154.4981481481487.90185185185185
91166.8155.63564814814811.1643518518519
92162.6154.5231481481488.07685185185185
93168.1155.51064814814812.5893518518518

\begin{tabular}{lllllllll}
\hline
Multiple Linear Regression - Actuals, Interpolation, and Residuals \tabularnewline
Time or Index & Actuals & InterpolationForecast & ResidualsPrediction Error \tabularnewline
1 & 112.1 & 82.501851851852 & 29.598148148148 \tabularnewline
2 & 104.2 & 83.7768518518518 & 20.4231481481482 \tabularnewline
3 & 102.4 & 83.3893518518519 & 19.0106481481481 \tabularnewline
4 & 100.3 & 81.4393518518518 & 18.8606481481482 \tabularnewline
5 & 102.6 & 81.1018518518518 & 21.4981481481481 \tabularnewline
6 & 101.5 & 79.2518518518518 & 22.2481481481482 \tabularnewline
7 & 103.4 & 80.3893518518518 & 23.0106481481482 \tabularnewline
8 & 99.4 & 79.2768518518518 & 20.1231481481482 \tabularnewline
9 & 97.9 & 80.2643518518519 & 17.6356481481482 \tabularnewline
10 & 98 & 79.201917989418 & 18.7980820105820 \tabularnewline
11 & 90.2 & 80.9162037037037 & 9.2837962962963 \tabularnewline
12 & 87.1 & 84.8304894179894 & 2.26951058201060 \tabularnewline
13 & 91.8 & 93.7016534391534 & -1.90165343915343 \tabularnewline
14 & 94.8 & 94.9766534391534 & -0.176653439153407 \tabularnewline
15 & 91.8 & 94.5891534391534 & -2.78915343915344 \tabularnewline
16 & 89.3 & 92.6391534391534 & -3.33915343915345 \tabularnewline
17 & 91.7 & 92.3016534391534 & -0.601653439153434 \tabularnewline
18 & 86.2 & 90.4516534391534 & -4.25165343915343 \tabularnewline
19 & 82.8 & 91.5891534391534 & -8.78915343915343 \tabularnewline
20 & 82.3 & 90.4766534391534 & -8.17665343915343 \tabularnewline
21 & 79.8 & 91.4641534391534 & -11.6641534391534 \tabularnewline
22 & 79.4 & 90.4017195767196 & -11.0017195767196 \tabularnewline
23 & 85.3 & 92.1160052910053 & -6.8160052910053 \tabularnewline
24 & 87.5 & 96.030291005291 & -8.53029100529098 \tabularnewline
25 & 88.3 & 104.901455026455 & -16.601455026455 \tabularnewline
26 & 88.6 & 106.176455026455 & -17.5764550264550 \tabularnewline
27 & 94.9 & 105.788955026455 & -10.8889550264550 \tabularnewline
28 & 94.7 & 103.838955026455 & -9.13895502645503 \tabularnewline
29 & 92.6 & 103.501455026455 & -10.9014550264550 \tabularnewline
30 & 91.8 & 101.651455026455 & -9.85145502645503 \tabularnewline
31 & 96.4 & 102.788955026455 & -6.38895502645502 \tabularnewline
32 & 96.4 & 101.676455026455 & -5.27645502645502 \tabularnewline
33 & 107.1 & 102.663955026455 & 4.43604497354497 \tabularnewline
34 & 111.9 & 101.601521164021 & 10.2984788359788 \tabularnewline
35 & 107.8 & 103.315806878307 & 4.48419312169312 \tabularnewline
36 & 109.2 & 107.230092592593 & 1.96990740740743 \tabularnewline
37 & 115.3 & 116.101256613757 & -0.801256613756592 \tabularnewline
38 & 119.2 & 117.376256613757 & 1.82374338624339 \tabularnewline
39 & 107.8 & 116.988756613757 & -9.18875661375662 \tabularnewline
40 & 106.8 & 115.038756613757 & -8.23875661375663 \tabularnewline
41 & 104.2 & 114.701256613757 & -10.5012566137566 \tabularnewline
42 & 94.8 & 112.851256613757 & -18.0512566137566 \tabularnewline
43 & 97.5 & 113.988756613757 & -16.4887566137566 \tabularnewline
44 & 98.3 & 112.876256613757 & -14.5762566137566 \tabularnewline
45 & 100.6 & 113.863756613757 & -13.2637566137566 \tabularnewline
46 & 94.9 & 109.649007936508 & -14.7490079365079 \tabularnewline
47 & 93.6 & 111.363293650794 & -17.7632936507936 \tabularnewline
48 & 98 & 115.277579365079 & -17.2775793650793 \tabularnewline
49 & 104.3 & 124.148743386243 & -19.8487433862434 \tabularnewline
50 & 103.9 & 125.423743386243 & -21.5237433862434 \tabularnewline
51 & 105.3 & 125.036243386243 & -19.7362433862434 \tabularnewline
52 & 102.6 & 123.086243386243 & -20.4862433862434 \tabularnewline
53 & 103.3 & 122.748743386243 & -19.4487433862434 \tabularnewline
54 & 107.9 & 120.898743386243 & -12.9987433862434 \tabularnewline
55 & 107.8 & 122.036243386243 & -14.2362433862434 \tabularnewline
56 & 109.8 & 120.923743386243 & -11.1237433862434 \tabularnewline
57 & 110.6 & 121.911243386243 & -11.3112433862434 \tabularnewline
58 & 110.8 & 120.848809523810 & -10.0488095238095 \tabularnewline
59 & 119.3 & 122.563095238095 & -3.26309523809524 \tabularnewline
60 & 128.1 & 126.477380952381 & 1.62261904761906 \tabularnewline
61 & 127.6 & 135.348544973545 & -7.74854497354495 \tabularnewline
62 & 137.9 & 136.623544973545 & 1.27645502645504 \tabularnewline
63 & 151.4 & 136.236044973545 & 15.1639550264550 \tabularnewline
64 & 143.6 & 134.286044973545 & 9.31395502645501 \tabularnewline
65 & 143.4 & 133.948544973545 & 9.45145502645503 \tabularnewline
66 & 141.9 & 132.098544973545 & 9.80145502645503 \tabularnewline
67 & 135.2 & 133.236044973545 & 1.96395502645501 \tabularnewline
68 & 133.1 & 132.123544973545 & 0.976455026455022 \tabularnewline
69 & 129.6 & 133.111044973545 & -3.51104497354498 \tabularnewline
70 & 134.1 & 132.048611111111 & 2.05138888888887 \tabularnewline
71 & 136.8 & 133.762896825397 & 3.03710317460318 \tabularnewline
72 & 143.5 & 137.677182539683 & 5.82281746031748 \tabularnewline
73 & 162.5 & 146.548346560847 & 15.9516534391535 \tabularnewline
74 & 163.1 & 147.823346560847 & 15.2766534391534 \tabularnewline
75 & 157.2 & 147.435846560847 & 9.76415343915342 \tabularnewline
76 & 158.8 & 145.485846560847 & 13.3141534391534 \tabularnewline
77 & 155.4 & 145.148346560847 & 10.2516534391534 \tabularnewline
78 & 148.5 & 143.298346560847 & 5.20165343915343 \tabularnewline
79 & 154.2 & 144.435846560847 & 9.76415343915342 \tabularnewline
80 & 153.3 & 143.323346560847 & 9.97665343915345 \tabularnewline
81 & 149.4 & 144.310846560847 & 5.08915343915345 \tabularnewline
82 & 147.9 & 143.248412698413 & 4.65158730158729 \tabularnewline
83 & 156 & 144.962698412698 & 11.0373015873016 \tabularnewline
84 & 163 & 148.876984126984 & 14.1230158730159 \tabularnewline
85 & 159.1 & 157.748148148148 & 1.35185185185187 \tabularnewline
86 & 159.5 & 159.023148148148 & 0.476851851851852 \tabularnewline
87 & 157.3 & 158.635648148148 & -1.33564814814815 \tabularnewline
88 & 156.4 & 156.685648148148 & -0.285648148148153 \tabularnewline
89 & 156.6 & 156.348148148148 & 0.251851851851833 \tabularnewline
90 & 162.4 & 154.498148148148 & 7.90185185185185 \tabularnewline
91 & 166.8 & 155.635648148148 & 11.1643518518519 \tabularnewline
92 & 162.6 & 154.523148148148 & 8.07685185185185 \tabularnewline
93 & 168.1 & 155.510648148148 & 12.5893518518518 \tabularnewline
\hline
\end{tabular}
%Source: https://freestatistics.org/blog/index.php?pk=25458&T=4

[TABLE]
[ROW][C]Multiple Linear Regression - Actuals, Interpolation, and Residuals[/C][/ROW]
[ROW][C]Time or Index[/C][C]Actuals[/C][C]InterpolationForecast[/C][C]ResidualsPrediction Error[/C][/ROW]
[ROW][C]1[/C][C]112.1[/C][C]82.501851851852[/C][C]29.598148148148[/C][/ROW]
[ROW][C]2[/C][C]104.2[/C][C]83.7768518518518[/C][C]20.4231481481482[/C][/ROW]
[ROW][C]3[/C][C]102.4[/C][C]83.3893518518519[/C][C]19.0106481481481[/C][/ROW]
[ROW][C]4[/C][C]100.3[/C][C]81.4393518518518[/C][C]18.8606481481482[/C][/ROW]
[ROW][C]5[/C][C]102.6[/C][C]81.1018518518518[/C][C]21.4981481481481[/C][/ROW]
[ROW][C]6[/C][C]101.5[/C][C]79.2518518518518[/C][C]22.2481481481482[/C][/ROW]
[ROW][C]7[/C][C]103.4[/C][C]80.3893518518518[/C][C]23.0106481481482[/C][/ROW]
[ROW][C]8[/C][C]99.4[/C][C]79.2768518518518[/C][C]20.1231481481482[/C][/ROW]
[ROW][C]9[/C][C]97.9[/C][C]80.2643518518519[/C][C]17.6356481481482[/C][/ROW]
[ROW][C]10[/C][C]98[/C][C]79.201917989418[/C][C]18.7980820105820[/C][/ROW]
[ROW][C]11[/C][C]90.2[/C][C]80.9162037037037[/C][C]9.2837962962963[/C][/ROW]
[ROW][C]12[/C][C]87.1[/C][C]84.8304894179894[/C][C]2.26951058201060[/C][/ROW]
[ROW][C]13[/C][C]91.8[/C][C]93.7016534391534[/C][C]-1.90165343915343[/C][/ROW]
[ROW][C]14[/C][C]94.8[/C][C]94.9766534391534[/C][C]-0.176653439153407[/C][/ROW]
[ROW][C]15[/C][C]91.8[/C][C]94.5891534391534[/C][C]-2.78915343915344[/C][/ROW]
[ROW][C]16[/C][C]89.3[/C][C]92.6391534391534[/C][C]-3.33915343915345[/C][/ROW]
[ROW][C]17[/C][C]91.7[/C][C]92.3016534391534[/C][C]-0.601653439153434[/C][/ROW]
[ROW][C]18[/C][C]86.2[/C][C]90.4516534391534[/C][C]-4.25165343915343[/C][/ROW]
[ROW][C]19[/C][C]82.8[/C][C]91.5891534391534[/C][C]-8.78915343915343[/C][/ROW]
[ROW][C]20[/C][C]82.3[/C][C]90.4766534391534[/C][C]-8.17665343915343[/C][/ROW]
[ROW][C]21[/C][C]79.8[/C][C]91.4641534391534[/C][C]-11.6641534391534[/C][/ROW]
[ROW][C]22[/C][C]79.4[/C][C]90.4017195767196[/C][C]-11.0017195767196[/C][/ROW]
[ROW][C]23[/C][C]85.3[/C][C]92.1160052910053[/C][C]-6.8160052910053[/C][/ROW]
[ROW][C]24[/C][C]87.5[/C][C]96.030291005291[/C][C]-8.53029100529098[/C][/ROW]
[ROW][C]25[/C][C]88.3[/C][C]104.901455026455[/C][C]-16.601455026455[/C][/ROW]
[ROW][C]26[/C][C]88.6[/C][C]106.176455026455[/C][C]-17.5764550264550[/C][/ROW]
[ROW][C]27[/C][C]94.9[/C][C]105.788955026455[/C][C]-10.8889550264550[/C][/ROW]
[ROW][C]28[/C][C]94.7[/C][C]103.838955026455[/C][C]-9.13895502645503[/C][/ROW]
[ROW][C]29[/C][C]92.6[/C][C]103.501455026455[/C][C]-10.9014550264550[/C][/ROW]
[ROW][C]30[/C][C]91.8[/C][C]101.651455026455[/C][C]-9.85145502645503[/C][/ROW]
[ROW][C]31[/C][C]96.4[/C][C]102.788955026455[/C][C]-6.38895502645502[/C][/ROW]
[ROW][C]32[/C][C]96.4[/C][C]101.676455026455[/C][C]-5.27645502645502[/C][/ROW]
[ROW][C]33[/C][C]107.1[/C][C]102.663955026455[/C][C]4.43604497354497[/C][/ROW]
[ROW][C]34[/C][C]111.9[/C][C]101.601521164021[/C][C]10.2984788359788[/C][/ROW]
[ROW][C]35[/C][C]107.8[/C][C]103.315806878307[/C][C]4.48419312169312[/C][/ROW]
[ROW][C]36[/C][C]109.2[/C][C]107.230092592593[/C][C]1.96990740740743[/C][/ROW]
[ROW][C]37[/C][C]115.3[/C][C]116.101256613757[/C][C]-0.801256613756592[/C][/ROW]
[ROW][C]38[/C][C]119.2[/C][C]117.376256613757[/C][C]1.82374338624339[/C][/ROW]
[ROW][C]39[/C][C]107.8[/C][C]116.988756613757[/C][C]-9.18875661375662[/C][/ROW]
[ROW][C]40[/C][C]106.8[/C][C]115.038756613757[/C][C]-8.23875661375663[/C][/ROW]
[ROW][C]41[/C][C]104.2[/C][C]114.701256613757[/C][C]-10.5012566137566[/C][/ROW]
[ROW][C]42[/C][C]94.8[/C][C]112.851256613757[/C][C]-18.0512566137566[/C][/ROW]
[ROW][C]43[/C][C]97.5[/C][C]113.988756613757[/C][C]-16.4887566137566[/C][/ROW]
[ROW][C]44[/C][C]98.3[/C][C]112.876256613757[/C][C]-14.5762566137566[/C][/ROW]
[ROW][C]45[/C][C]100.6[/C][C]113.863756613757[/C][C]-13.2637566137566[/C][/ROW]
[ROW][C]46[/C][C]94.9[/C][C]109.649007936508[/C][C]-14.7490079365079[/C][/ROW]
[ROW][C]47[/C][C]93.6[/C][C]111.363293650794[/C][C]-17.7632936507936[/C][/ROW]
[ROW][C]48[/C][C]98[/C][C]115.277579365079[/C][C]-17.2775793650793[/C][/ROW]
[ROW][C]49[/C][C]104.3[/C][C]124.148743386243[/C][C]-19.8487433862434[/C][/ROW]
[ROW][C]50[/C][C]103.9[/C][C]125.423743386243[/C][C]-21.5237433862434[/C][/ROW]
[ROW][C]51[/C][C]105.3[/C][C]125.036243386243[/C][C]-19.7362433862434[/C][/ROW]
[ROW][C]52[/C][C]102.6[/C][C]123.086243386243[/C][C]-20.4862433862434[/C][/ROW]
[ROW][C]53[/C][C]103.3[/C][C]122.748743386243[/C][C]-19.4487433862434[/C][/ROW]
[ROW][C]54[/C][C]107.9[/C][C]120.898743386243[/C][C]-12.9987433862434[/C][/ROW]
[ROW][C]55[/C][C]107.8[/C][C]122.036243386243[/C][C]-14.2362433862434[/C][/ROW]
[ROW][C]56[/C][C]109.8[/C][C]120.923743386243[/C][C]-11.1237433862434[/C][/ROW]
[ROW][C]57[/C][C]110.6[/C][C]121.911243386243[/C][C]-11.3112433862434[/C][/ROW]
[ROW][C]58[/C][C]110.8[/C][C]120.848809523810[/C][C]-10.0488095238095[/C][/ROW]
[ROW][C]59[/C][C]119.3[/C][C]122.563095238095[/C][C]-3.26309523809524[/C][/ROW]
[ROW][C]60[/C][C]128.1[/C][C]126.477380952381[/C][C]1.62261904761906[/C][/ROW]
[ROW][C]61[/C][C]127.6[/C][C]135.348544973545[/C][C]-7.74854497354495[/C][/ROW]
[ROW][C]62[/C][C]137.9[/C][C]136.623544973545[/C][C]1.27645502645504[/C][/ROW]
[ROW][C]63[/C][C]151.4[/C][C]136.236044973545[/C][C]15.1639550264550[/C][/ROW]
[ROW][C]64[/C][C]143.6[/C][C]134.286044973545[/C][C]9.31395502645501[/C][/ROW]
[ROW][C]65[/C][C]143.4[/C][C]133.948544973545[/C][C]9.45145502645503[/C][/ROW]
[ROW][C]66[/C][C]141.9[/C][C]132.098544973545[/C][C]9.80145502645503[/C][/ROW]
[ROW][C]67[/C][C]135.2[/C][C]133.236044973545[/C][C]1.96395502645501[/C][/ROW]
[ROW][C]68[/C][C]133.1[/C][C]132.123544973545[/C][C]0.976455026455022[/C][/ROW]
[ROW][C]69[/C][C]129.6[/C][C]133.111044973545[/C][C]-3.51104497354498[/C][/ROW]
[ROW][C]70[/C][C]134.1[/C][C]132.048611111111[/C][C]2.05138888888887[/C][/ROW]
[ROW][C]71[/C][C]136.8[/C][C]133.762896825397[/C][C]3.03710317460318[/C][/ROW]
[ROW][C]72[/C][C]143.5[/C][C]137.677182539683[/C][C]5.82281746031748[/C][/ROW]
[ROW][C]73[/C][C]162.5[/C][C]146.548346560847[/C][C]15.9516534391535[/C][/ROW]
[ROW][C]74[/C][C]163.1[/C][C]147.823346560847[/C][C]15.2766534391534[/C][/ROW]
[ROW][C]75[/C][C]157.2[/C][C]147.435846560847[/C][C]9.76415343915342[/C][/ROW]
[ROW][C]76[/C][C]158.8[/C][C]145.485846560847[/C][C]13.3141534391534[/C][/ROW]
[ROW][C]77[/C][C]155.4[/C][C]145.148346560847[/C][C]10.2516534391534[/C][/ROW]
[ROW][C]78[/C][C]148.5[/C][C]143.298346560847[/C][C]5.20165343915343[/C][/ROW]
[ROW][C]79[/C][C]154.2[/C][C]144.435846560847[/C][C]9.76415343915342[/C][/ROW]
[ROW][C]80[/C][C]153.3[/C][C]143.323346560847[/C][C]9.97665343915345[/C][/ROW]
[ROW][C]81[/C][C]149.4[/C][C]144.310846560847[/C][C]5.08915343915345[/C][/ROW]
[ROW][C]82[/C][C]147.9[/C][C]143.248412698413[/C][C]4.65158730158729[/C][/ROW]
[ROW][C]83[/C][C]156[/C][C]144.962698412698[/C][C]11.0373015873016[/C][/ROW]
[ROW][C]84[/C][C]163[/C][C]148.876984126984[/C][C]14.1230158730159[/C][/ROW]
[ROW][C]85[/C][C]159.1[/C][C]157.748148148148[/C][C]1.35185185185187[/C][/ROW]
[ROW][C]86[/C][C]159.5[/C][C]159.023148148148[/C][C]0.476851851851852[/C][/ROW]
[ROW][C]87[/C][C]157.3[/C][C]158.635648148148[/C][C]-1.33564814814815[/C][/ROW]
[ROW][C]88[/C][C]156.4[/C][C]156.685648148148[/C][C]-0.285648148148153[/C][/ROW]
[ROW][C]89[/C][C]156.6[/C][C]156.348148148148[/C][C]0.251851851851833[/C][/ROW]
[ROW][C]90[/C][C]162.4[/C][C]154.498148148148[/C][C]7.90185185185185[/C][/ROW]
[ROW][C]91[/C][C]166.8[/C][C]155.635648148148[/C][C]11.1643518518519[/C][/ROW]
[ROW][C]92[/C][C]162.6[/C][C]154.523148148148[/C][C]8.07685185185185[/C][/ROW]
[ROW][C]93[/C][C]168.1[/C][C]155.510648148148[/C][C]12.5893518518518[/C][/ROW]
[/TABLE]
Source: https://freestatistics.org/blog/index.php?pk=25458&T=4

Globally Unique Identifier (entire table): ba.freestatistics.org/blog/index.php?pk=25458&T=4

As an alternative you can also use a QR Code:  

The GUIDs for individual cells are displayed in the table below:

Multiple Linear Regression - Actuals, Interpolation, and Residuals
Time or IndexActualsInterpolationForecastResidualsPrediction Error
1112.182.50185185185229.598148148148
2104.283.776851851851820.4231481481482
3102.483.389351851851919.0106481481481
4100.381.439351851851818.8606481481482
5102.681.101851851851821.4981481481481
6101.579.251851851851822.2481481481482
7103.480.389351851851823.0106481481482
899.479.276851851851820.1231481481482
997.980.264351851851917.6356481481482
109879.20191798941818.7980820105820
1190.280.91620370370379.2837962962963
1287.184.83048941798942.26951058201060
1391.893.7016534391534-1.90165343915343
1494.894.9766534391534-0.176653439153407
1591.894.5891534391534-2.78915343915344
1689.392.6391534391534-3.33915343915345
1791.792.3016534391534-0.601653439153434
1886.290.4516534391534-4.25165343915343
1982.891.5891534391534-8.78915343915343
2082.390.4766534391534-8.17665343915343
2179.891.4641534391534-11.6641534391534
2279.490.4017195767196-11.0017195767196
2385.392.1160052910053-6.8160052910053
2487.596.030291005291-8.53029100529098
2588.3104.901455026455-16.601455026455
2688.6106.176455026455-17.5764550264550
2794.9105.788955026455-10.8889550264550
2894.7103.838955026455-9.13895502645503
2992.6103.501455026455-10.9014550264550
3091.8101.651455026455-9.85145502645503
3196.4102.788955026455-6.38895502645502
3296.4101.676455026455-5.27645502645502
33107.1102.6639550264554.43604497354497
34111.9101.60152116402110.2984788359788
35107.8103.3158068783074.48419312169312
36109.2107.2300925925931.96990740740743
37115.3116.101256613757-0.801256613756592
38119.2117.3762566137571.82374338624339
39107.8116.988756613757-9.18875661375662
40106.8115.038756613757-8.23875661375663
41104.2114.701256613757-10.5012566137566
4294.8112.851256613757-18.0512566137566
4397.5113.988756613757-16.4887566137566
4498.3112.876256613757-14.5762566137566
45100.6113.863756613757-13.2637566137566
4694.9109.649007936508-14.7490079365079
4793.6111.363293650794-17.7632936507936
4898115.277579365079-17.2775793650793
49104.3124.148743386243-19.8487433862434
50103.9125.423743386243-21.5237433862434
51105.3125.036243386243-19.7362433862434
52102.6123.086243386243-20.4862433862434
53103.3122.748743386243-19.4487433862434
54107.9120.898743386243-12.9987433862434
55107.8122.036243386243-14.2362433862434
56109.8120.923743386243-11.1237433862434
57110.6121.911243386243-11.3112433862434
58110.8120.848809523810-10.0488095238095
59119.3122.563095238095-3.26309523809524
60128.1126.4773809523811.62261904761906
61127.6135.348544973545-7.74854497354495
62137.9136.6235449735451.27645502645504
63151.4136.23604497354515.1639550264550
64143.6134.2860449735459.31395502645501
65143.4133.9485449735459.45145502645503
66141.9132.0985449735459.80145502645503
67135.2133.2360449735451.96395502645501
68133.1132.1235449735450.976455026455022
69129.6133.111044973545-3.51104497354498
70134.1132.0486111111112.05138888888887
71136.8133.7628968253973.03710317460318
72143.5137.6771825396835.82281746031748
73162.5146.54834656084715.9516534391535
74163.1147.82334656084715.2766534391534
75157.2147.4358465608479.76415343915342
76158.8145.48584656084713.3141534391534
77155.4145.14834656084710.2516534391534
78148.5143.2983465608475.20165343915343
79154.2144.4358465608479.76415343915342
80153.3143.3233465608479.97665343915345
81149.4144.3108465608475.08915343915345
82147.9143.2484126984134.65158730158729
83156144.96269841269811.0373015873016
84163148.87698412698414.1230158730159
85159.1157.7481481481481.35185185185187
86159.5159.0231481481480.476851851851852
87157.3158.635648148148-1.33564814814815
88156.4156.685648148148-0.285648148148153
89156.6156.3481481481480.251851851851833
90162.4154.4981481481487.90185185185185
91166.8155.63564814814811.1643518518519
92162.6154.5231481481488.07685185185185
93168.1155.51064814814812.5893518518518


Parameters (Session):
par1 = 1 ; par2 = Include Monthly Dummies ; par3 = Linear Trend ;
Parameters (R input):
par1 = 1 ; par2 = Include Monthly Dummies ; par3 = Linear Trend ; par4 = ; par5 = ; par6 = ; par7 = ; par8 = ; par9 = ; par10 = ; par11 = ; par12 = ; par13 = ; par14 = ; par15 = ; par16 = ; par17 = ; par18 = ; par19 = ; par20 = ;
R code (references can be found in the software module):
library(lattice)
par1 <- as.numeric(par1)
x <- t(y)
k <- length(x[1,])
n <- length(x[,1])
x1 <- cbind(x[,par1], x[,1:k!=par1])
mycolnames <- c(colnames(x)[par1], colnames(x)[1:k!=par1])
colnames(x1) <- mycolnames #colnames(x)[par1]
x <- x1
if (par3 == 'First Differences'){
x2 <- array(0, dim=c(n-1,k), dimnames=list(1:(n-1), paste('(1-B)',colnames(x),sep='')))
for (i in 1:n-1) {
for (j in 1:k) {
x2[i,j] <- x[i+1,j] - x[i,j]
}
}
x <- x2
}
if (par2 == 'Include Monthly Dummies'){
x2 <- array(0, dim=c(n,11), dimnames=list(1:n, paste('M', seq(1:11), sep ='')))
for (i in 1:11){
x2[seq(i,n,12),i] <- 1
}
x <- cbind(x, x2)
}
if (par2 == 'Include Quarterly Dummies'){
x2 <- array(0, dim=c(n,3), dimnames=list(1:n, paste('Q', seq(1:3), sep ='')))
for (i in 1:3){
x2[seq(i,n,4),i] <- 1
}
x <- cbind(x, x2)
}
k <- length(x[1,])
if (par3 == 'Linear Trend'){
x <- cbind(x, c(1:n))
colnames(x)[k+1] <- 't'
}
x
k <- length(x[1,])
df <- as.data.frame(x)
(mylm <- lm(df))
(mysum <- summary(mylm))
bitmap(file='test0.png')
plot(x[,1], type='l', main='Actuals and Interpolation', ylab='value of Actuals and Interpolation (dots)', xlab='time or index')
points(x[,1]-mysum$resid)
grid()
dev.off()
bitmap(file='test1.png')
plot(mysum$resid, type='b', pch=19, main='Residuals', ylab='value of Residuals', xlab='time or index')
grid()
dev.off()
bitmap(file='test2.png')
hist(mysum$resid, main='Residual Histogram', xlab='values of Residuals')
grid()
dev.off()
bitmap(file='test3.png')
densityplot(~mysum$resid,col='black',main='Residual Density Plot', xlab='values of Residuals')
dev.off()
bitmap(file='test4.png')
qqnorm(mysum$resid, main='Residual Normal Q-Q Plot')
grid()
dev.off()
(myerror <- as.ts(mysum$resid))
bitmap(file='test5.png')
dum <- cbind(lag(myerror,k=1),myerror)
dum
dum1 <- dum[2:length(myerror),]
dum1
z <- as.data.frame(dum1)
z
plot(z,main=paste('Residual Lag plot, lowess, and regression line'), ylab='values of Residuals', xlab='lagged values of Residuals')
lines(lowess(z))
abline(lm(z))
grid()
dev.off()
bitmap(file='test6.png')
acf(mysum$resid, lag.max=length(mysum$resid)/2, main='Residual Autocorrelation Function')
grid()
dev.off()
bitmap(file='test7.png')
pacf(mysum$resid, lag.max=length(mysum$resid)/2, main='Residual Partial Autocorrelation Function')
grid()
dev.off()
bitmap(file='test8.png')
opar <- par(mfrow = c(2,2), oma = c(0, 0, 1.1, 0))
plot(mylm, las = 1, sub='Residual Diagnostics')
par(opar)
dev.off()
load(file='createtable')
a<-table.start()
a<-table.row.start(a)
a<-table.element(a, 'Multiple Linear Regression - Estimated Regression Equation', 1, TRUE)
a<-table.row.end(a)
myeq <- colnames(x)[1]
myeq <- paste(myeq, '[t] = ', sep='')
for (i in 1:k){
if (mysum$coefficients[i,1] > 0) myeq <- paste(myeq, '+', '')
myeq <- paste(myeq, mysum$coefficients[i,1], sep=' ')
if (rownames(mysum$coefficients)[i] != '(Intercept)') {
myeq <- paste(myeq, rownames(mysum$coefficients)[i], sep='')
if (rownames(mysum$coefficients)[i] != 't') myeq <- paste(myeq, '[t]', sep='')
}
}
myeq <- paste(myeq, ' + e[t]')
a<-table.row.start(a)
a<-table.element(a, myeq)
a<-table.row.end(a)
a<-table.end(a)
table.save(a,file='mytable1.tab')
a<-table.start()
a<-table.row.start(a)
a<-table.element(a,hyperlink('ols1.htm','Multiple Linear Regression - Ordinary Least Squares',''), 6, TRUE)
a<-table.row.end(a)
a<-table.row.start(a)
a<-table.element(a,'Variable',header=TRUE)
a<-table.element(a,'Parameter',header=TRUE)
a<-table.element(a,'S.D.',header=TRUE)
a<-table.element(a,'T-STAT
H0: parameter = 0',header=TRUE)
a<-table.element(a,'2-tail p-value',header=TRUE)
a<-table.element(a,'1-tail p-value',header=TRUE)
a<-table.row.end(a)
for (i in 1:k){
a<-table.row.start(a)
a<-table.element(a,rownames(mysum$coefficients)[i],header=TRUE)
a<-table.element(a,mysum$coefficients[i,1])
a<-table.element(a, round(mysum$coefficients[i,2],6))
a<-table.element(a, round(mysum$coefficients[i,3],4))
a<-table.element(a, round(mysum$coefficients[i,4],6))
a<-table.element(a, round(mysum$coefficients[i,4]/2,6))
a<-table.row.end(a)
}
a<-table.end(a)
table.save(a,file='mytable2.tab')
a<-table.start()
a<-table.row.start(a)
a<-table.element(a, 'Multiple Linear Regression - Regression Statistics', 2, TRUE)
a<-table.row.end(a)
a<-table.row.start(a)
a<-table.element(a, 'Multiple R',1,TRUE)
a<-table.element(a, sqrt(mysum$r.squared))
a<-table.row.end(a)
a<-table.row.start(a)
a<-table.element(a, 'R-squared',1,TRUE)
a<-table.element(a, mysum$r.squared)
a<-table.row.end(a)
a<-table.row.start(a)
a<-table.element(a, 'Adjusted R-squared',1,TRUE)
a<-table.element(a, mysum$adj.r.squared)
a<-table.row.end(a)
a<-table.row.start(a)
a<-table.element(a, 'F-TEST (value)',1,TRUE)
a<-table.element(a, mysum$fstatistic[1])
a<-table.row.end(a)
a<-table.row.start(a)
a<-table.element(a, 'F-TEST (DF numerator)',1,TRUE)
a<-table.element(a, mysum$fstatistic[2])
a<-table.row.end(a)
a<-table.row.start(a)
a<-table.element(a, 'F-TEST (DF denominator)',1,TRUE)
a<-table.element(a, mysum$fstatistic[3])
a<-table.row.end(a)
a<-table.row.start(a)
a<-table.element(a, 'p-value',1,TRUE)
a<-table.element(a, 1-pf(mysum$fstatistic[1],mysum$fstatistic[2],mysum$fstatistic[3]))
a<-table.row.end(a)
a<-table.row.start(a)
a<-table.element(a, 'Multiple Linear Regression - Residual Statistics', 2, TRUE)
a<-table.row.end(a)
a<-table.row.start(a)
a<-table.element(a, 'Residual Standard Deviation',1,TRUE)
a<-table.element(a, mysum$sigma)
a<-table.row.end(a)
a<-table.row.start(a)
a<-table.element(a, 'Sum Squared Residuals',1,TRUE)
a<-table.element(a, sum(myerror*myerror))
a<-table.row.end(a)
a<-table.end(a)
table.save(a,file='mytable3.tab')
a<-table.start()
a<-table.row.start(a)
a<-table.element(a, 'Multiple Linear Regression - Actuals, Interpolation, and Residuals', 4, TRUE)
a<-table.row.end(a)
a<-table.row.start(a)
a<-table.element(a, 'Time or Index', 1, TRUE)
a<-table.element(a, 'Actuals', 1, TRUE)
a<-table.element(a, 'Interpolation
Forecast', 1, TRUE)
a<-table.element(a, 'Residuals
Prediction Error', 1, TRUE)
a<-table.row.end(a)
for (i in 1:n) {
a<-table.row.start(a)
a<-table.element(a,i, 1, TRUE)
a<-table.element(a,x[i])
a<-table.element(a,x[i]-mysum$resid[i])
a<-table.element(a,mysum$resid[i])
a<-table.row.end(a)
}
a<-table.end(a)
table.save(a,file='mytable4.tab')