Free Statistics

of Irreproducible Research!

Author's title

Author*The author of this computation has been verified*
R Software Modulerwasp_multipleregression.wasp
Title produced by softwareMultiple Regression
Date of computationMon, 24 Nov 2008 09:41:42 -0700
Cite this page as followsStatistical Computations at FreeStatistics.org, Office for Research Development and Education, URL https://freestatistics.org/blog/index.php?v=date/2008/Nov/24/t1227544952ltapuchwwdrdgj7.htm/, Retrieved Mon, 13 May 2024 23:21:04 +0000
Statistical Computations at FreeStatistics.org, Office for Research Development and Education, URL https://freestatistics.org/blog/index.php?pk=25453, Retrieved Mon, 13 May 2024 23:21:04 +0000
QR Codes:

Original text written by user:
IsPrivate?No (this computation is public)
User-defined keywords
Estimated Impact163
Family? (F = Feedback message, R = changed R code, M = changed R Module, P = changed Parameters, D = changed Data)
F     [Multiple Regression] [] [2007-11-19 19:55:31] [b731da8b544846036771bbf9bf2f34ce]
F    D    [Multiple Regression] [The Seatbelt Law ...] [2008-11-24 16:41:42] [dafd615cb3e0decc017580d68ecea30a] [Current]
Feedback Forum
2008-12-01 16:46:14 [Jeroen Michel] [reply
Ook hier verwijs ik ten zeerste naar de feedback die ik zelf heb gegeven bij Q1 en Q2:

Statistical Computations at FreeStatistics.org, Office for Research Development and Education, URL http://www.freestatistics.org/blog/date/2008/Nov/24/t1227544369l4gtmawv89d3idr.htm
, Retrieved Mon, 24 Nov 2008 16:32:53 +0000


Voorts is hier een correcte output gegenereerd en zijn de resultaten correct geïnterpreteerd en toegelicht aan de hand van grafisch materiaal en tabellen.
Ook hier zijn de conclusies juist en zeer uitgebreid.
2008-12-01 22:28:07 [Katrien Bourdiaudhy] [reply
ik verwijs hierbij ook naar de verbetering voor Q1 en Q2 daar hier dezelfde interpretatiefouten worden gemaakt.
ik twijfel aan de correctheid van het invoeren van een dummy die niet is gebaseerd op een economische gebeurtenis. doch is het een goed alternatief om deze oefening alsnog op te lossen.
let wel op bij de interpretaties van de grafieken.
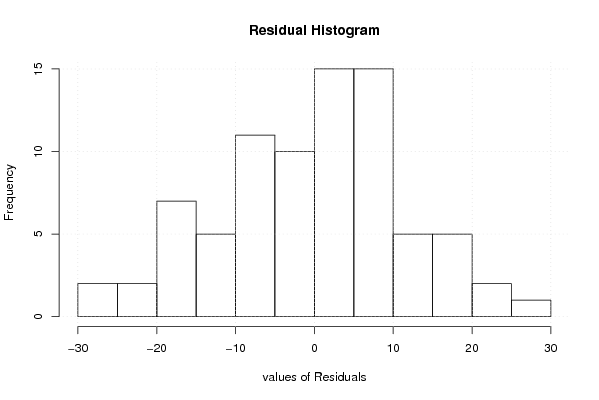
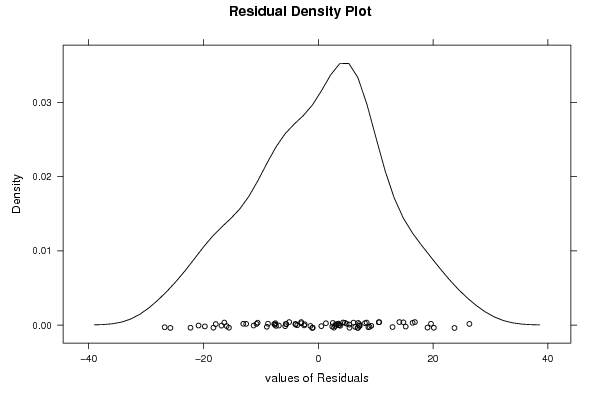
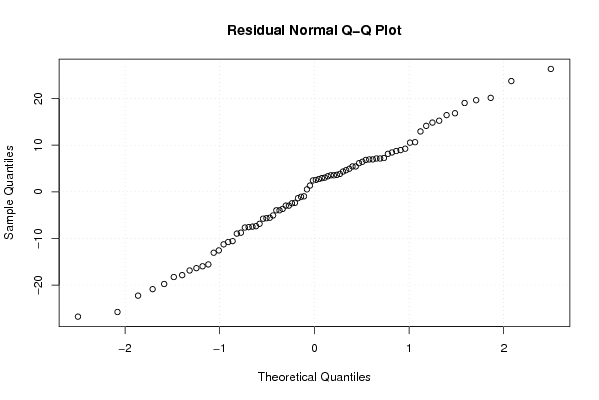
eerst vermeld je bij het histogram en de density plot van de residus dat er geen normaalverdeling is, maar verder in je werk zeg je bij de Q-Q plot van de residus dat je duidelijk een normaal verdeling ziet.
voor alle duidelijkheid, er is wel degelijk een normaal verdeling, de knik in de density plot en de uitloper in het histogram zijn verwaarloosbaar.

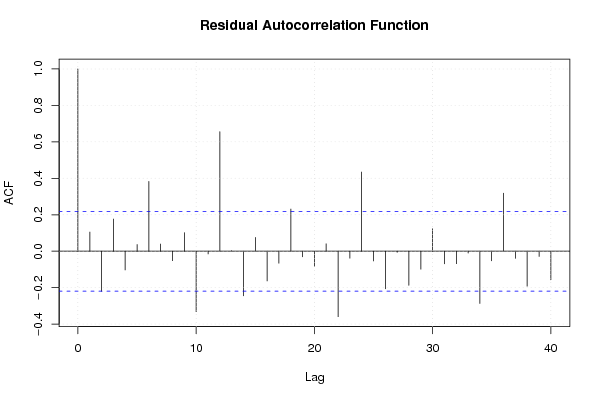
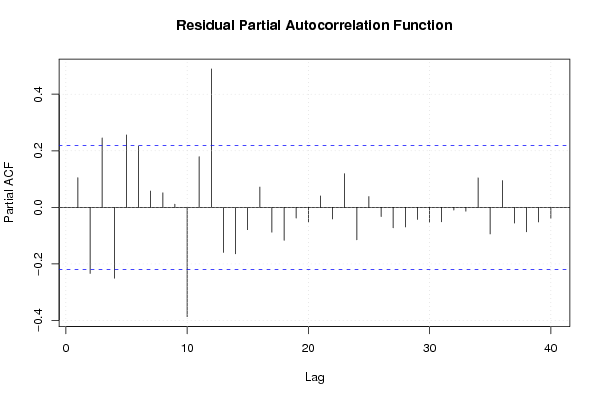
verder trek ik ook de gevonden correlatie in twijfel. de verticale lijntjes stijgen inderdaad uit boven het betrouwbaarheids interval maar slechts in beperkte mate. je zou dus moeten nagaan of deze correlatie wel significant is.

Post a new message
Dataseries X:
106.7	0
110.2	0
125.9	0
100.1	0
106.4	0
114.8	0
81.3	0
87	0
104.2	0
108	0
105	0
94.5	0
92	0
95.9	0
108.8	0
103.4	0
102.1	0
110.1	0
83.2	0
82.7	0
106.8	0
113.7	0
102.5	0
96.6	0
92.1	0
95.6	0
102.3	0
98.6	0
98.2	0
104.5	0
84	0
73.8	0
103.9	0
106	0
97.2	0
102.6	0
89	0
93.8	0
116.7	1
106.8	1
98.5	1
118.7	1
90	1
91.9	1
113.3	1
113.1	1
104.1	1
108.7	1
96.7	1
101	1
116.9	1
105.8	1
99	1
129.4	1
83	1
88.9	1
115.9	1
104.2	1
113.4	1
112.2	1
100.8	1
107.3	1
126.6	1
102.9	1
117.9	1
128.8	1
87.5	1
93.8	1
122.7	1
126.2	1
124.6	1
116.7	1
115.2	1
111.1	1
129.9	1
113.3	1
118.5	1
133.5	1
102.1	1
102.4	1


Summary of computational transaction
Raw Inputview raw input (R code)
Raw Outputview raw output of R engine
Computing time2 seconds
R Server'George Udny Yule' @ 72.249.76.132

\begin{tabular}{lllllllll}
\hline
Summary of computational transaction \tabularnewline
Raw Input & view raw input (R code)  \tabularnewline
Raw Output & view raw output of R engine  \tabularnewline
Computing time & 2 seconds \tabularnewline
R Server & 'George Udny Yule' @ 72.249.76.132 \tabularnewline
\hline
\end{tabular}
%Source: https://freestatistics.org/blog/index.php?pk=25453&T=0

[TABLE]
[ROW][C]Summary of computational transaction[/C][/ROW]
[ROW][C]Raw Input[/C][C]view raw input (R code) [/C][/ROW]
[ROW][C]Raw Output[/C][C]view raw output of R engine [/C][/ROW]
[ROW][C]Computing time[/C][C]2 seconds[/C][/ROW]
[ROW][C]R Server[/C][C]'George Udny Yule' @ 72.249.76.132[/C][/ROW]
[/TABLE]
Source: https://freestatistics.org/blog/index.php?pk=25453&T=0

Globally Unique Identifier (entire table): ba.freestatistics.org/blog/index.php?pk=25453&T=0

As an alternative you can also use a QR Code:  

The GUIDs for individual cells are displayed in the table below:

Summary of computational transaction
Raw Inputview raw input (R code)
Raw Outputview raw output of R engine
Computing time2 seconds
R Server'George Udny Yule' @ 72.249.76.132


Multiple Linear Regression - Estimated Regression Equation
y[t] = + 99.5657894736842 + 10.1961152882206x[t] + e[t]

\begin{tabular}{lllllllll}
\hline
Multiple Linear Regression - Estimated Regression Equation \tabularnewline
y[t] =  +  99.5657894736842 +  10.1961152882206x[t]  + e[t] \tabularnewline
\hline
\end{tabular}
%Source: https://freestatistics.org/blog/index.php?pk=25453&T=1

[TABLE]
[ROW][C]Multiple Linear Regression - Estimated Regression Equation[/C][/ROW]
[ROW][C]y[t] =  +  99.5657894736842 +  10.1961152882206x[t]  + e[t][/C][/ROW]
[/TABLE]
Source: https://freestatistics.org/blog/index.php?pk=25453&T=1

Globally Unique Identifier (entire table): ba.freestatistics.org/blog/index.php?pk=25453&T=1

As an alternative you can also use a QR Code:  

The GUIDs for individual cells are displayed in the table below:

Multiple Linear Regression - Estimated Regression Equation
y[t] = + 99.5657894736842 + 10.1961152882206x[t] + e[t]


Multiple Linear Regression - Ordinary Least Squares
VariableParameterS.D.T-STATH0: parameter = 02-tail p-value1-tail p-value
(Intercept)99.56578947368421.90059752.386600
x10.19611528822062.6230733.88710.0002120.000106

\begin{tabular}{lllllllll}
\hline
Multiple Linear Regression - Ordinary Least Squares \tabularnewline
Variable & Parameter & S.D. & T-STATH0: parameter = 0 & 2-tail p-value & 1-tail p-value \tabularnewline
(Intercept) & 99.5657894736842 & 1.900597 & 52.3866 & 0 & 0 \tabularnewline
x & 10.1961152882206 & 2.623073 & 3.8871 & 0.000212 & 0.000106 \tabularnewline
\hline
\end{tabular}
%Source: https://freestatistics.org/blog/index.php?pk=25453&T=2

[TABLE]
[ROW][C]Multiple Linear Regression - Ordinary Least Squares[/C][/ROW]
[ROW][C]Variable[/C][C]Parameter[/C][C]S.D.[/C][C]T-STATH0: parameter = 0[/C][C]2-tail p-value[/C][C]1-tail p-value[/C][/ROW]
[ROW][C](Intercept)[/C][C]99.5657894736842[/C][C]1.900597[/C][C]52.3866[/C][C]0[/C][C]0[/C][/ROW]
[ROW][C]x[/C][C]10.1961152882206[/C][C]2.623073[/C][C]3.8871[/C][C]0.000212[/C][C]0.000106[/C][/ROW]
[/TABLE]
Source: https://freestatistics.org/blog/index.php?pk=25453&T=2

Globally Unique Identifier (entire table): ba.freestatistics.org/blog/index.php?pk=25453&T=2

As an alternative you can also use a QR Code:  

The GUIDs for individual cells are displayed in the table below:

Multiple Linear Regression - Ordinary Least Squares
VariableParameterS.D.T-STATH0: parameter = 02-tail p-value1-tail p-value
(Intercept)99.56578947368421.90059752.386600
x10.19611528822062.6230733.88710.0002120.000106


Multiple Linear Regression - Regression Statistics
Multiple R0.40283525888397
R-squared0.162276245800115
Adjusted R-squared0.151536197669348
F-TEST (value)15.1094523808726
F-TEST (DF numerator)1
F-TEST (DF denominator)78
p-value0.000211700505996726
Multiple Linear Regression - Residual Statistics
Residual Standard Deviation11.7160664254836
Sum Squared Residuals10706.7645739348

\begin{tabular}{lllllllll}
\hline
Multiple Linear Regression - Regression Statistics \tabularnewline
Multiple R & 0.40283525888397 \tabularnewline
R-squared & 0.162276245800115 \tabularnewline
Adjusted R-squared & 0.151536197669348 \tabularnewline
F-TEST (value) & 15.1094523808726 \tabularnewline
F-TEST (DF numerator) & 1 \tabularnewline
F-TEST (DF denominator) & 78 \tabularnewline
p-value & 0.000211700505996726 \tabularnewline
Multiple Linear Regression - Residual Statistics \tabularnewline
Residual Standard Deviation & 11.7160664254836 \tabularnewline
Sum Squared Residuals & 10706.7645739348 \tabularnewline
\hline
\end{tabular}
%Source: https://freestatistics.org/blog/index.php?pk=25453&T=3

[TABLE]
[ROW][C]Multiple Linear Regression - Regression Statistics[/C][/ROW]
[ROW][C]Multiple R[/C][C]0.40283525888397[/C][/ROW]
[ROW][C]R-squared[/C][C]0.162276245800115[/C][/ROW]
[ROW][C]Adjusted R-squared[/C][C]0.151536197669348[/C][/ROW]
[ROW][C]F-TEST (value)[/C][C]15.1094523808726[/C][/ROW]
[ROW][C]F-TEST (DF numerator)[/C][C]1[/C][/ROW]
[ROW][C]F-TEST (DF denominator)[/C][C]78[/C][/ROW]
[ROW][C]p-value[/C][C]0.000211700505996726[/C][/ROW]
[ROW][C]Multiple Linear Regression - Residual Statistics[/C][/ROW]
[ROW][C]Residual Standard Deviation[/C][C]11.7160664254836[/C][/ROW]
[ROW][C]Sum Squared Residuals[/C][C]10706.7645739348[/C][/ROW]
[/TABLE]
Source: https://freestatistics.org/blog/index.php?pk=25453&T=3

Globally Unique Identifier (entire table): ba.freestatistics.org/blog/index.php?pk=25453&T=3

As an alternative you can also use a QR Code:  

The GUIDs for individual cells are displayed in the table below:

Multiple Linear Regression - Regression Statistics
Multiple R0.40283525888397
R-squared0.162276245800115
Adjusted R-squared0.151536197669348
F-TEST (value)15.1094523808726
F-TEST (DF numerator)1
F-TEST (DF denominator)78
p-value0.000211700505996726
Multiple Linear Regression - Residual Statistics
Residual Standard Deviation11.7160664254836
Sum Squared Residuals10706.7645739348


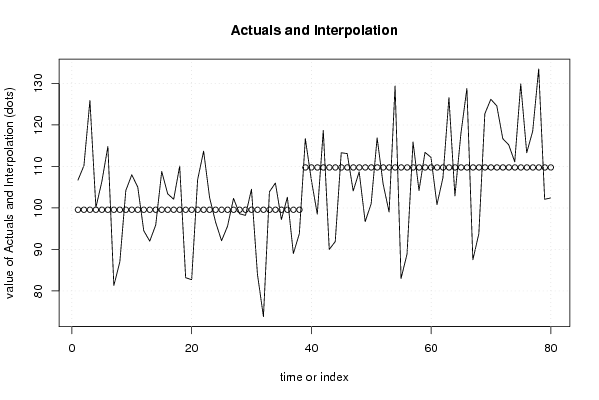
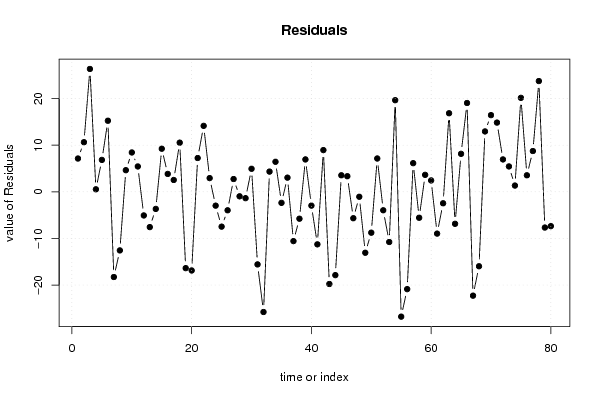
Multiple Linear Regression - Actuals, Interpolation, and Residuals
Time or IndexActualsInterpolationForecastResidualsPrediction Error
1106.799.56578947368467.13421052631544
2110.299.565789473684210.6342105263158
3125.999.565789473684226.3342105263158
4100.199.56578947368420.534210526315793
5106.499.56578947368426.8342105263158
6114.899.565789473684215.2342105263158
781.399.5657894736842-18.2657894736842
88799.5657894736842-12.5657894736842
9104.299.56578947368424.6342105263158
1010899.56578947368428.4342105263158
1110599.56578947368425.4342105263158
1294.599.5657894736842-5.0657894736842
139299.5657894736842-7.5657894736842
1495.999.5657894736842-3.66578947368420
15108.899.56578947368429.2342105263158
16103.499.56578947368423.83421052631580
17102.199.56578947368422.53421052631579
18110.199.565789473684210.5342105263158
1983.299.5657894736842-16.3657894736842
2082.799.5657894736842-16.8657894736842
21106.899.56578947368427.2342105263158
22113.799.565789473684214.1342105263158
23102.599.56578947368422.9342105263158
2496.699.5657894736842-2.96578947368421
2592.199.5657894736842-7.4657894736842
2695.699.5657894736842-3.96578947368421
27102.399.56578947368422.73421052631580
2898.699.5657894736842-0.965789473684207
2998.299.5657894736842-1.36578947368420
30104.599.56578947368424.9342105263158
318499.5657894736842-15.5657894736842
3273.899.5657894736842-25.7657894736842
33103.999.56578947368424.33421052631580
3410699.56578947368426.4342105263158
3597.299.5657894736842-2.3657894736842
36102.699.56578947368423.03421052631579
378999.5657894736842-10.5657894736842
3893.899.5657894736842-5.7657894736842
39116.7109.7619047619056.93809523809524
40106.8109.761904761905-2.96190476190477
4198.5109.761904761905-11.2619047619048
42118.7109.7619047619058.93809523809524
4390109.761904761905-19.7619047619048
4491.9109.761904761905-17.8619047619048
45113.3109.7619047619053.53809523809523
46113.1109.7619047619053.33809523809523
47104.1109.761904761905-5.66190476190477
48108.7109.761904761905-1.06190476190476
4996.7109.761904761905-13.0619047619048
50101109.761904761905-8.76190476190476
51116.9109.7619047619057.13809523809524
52105.8109.761904761905-3.96190476190477
5399109.761904761905-10.7619047619048
54129.4109.76190476190519.6380952380952
5583109.761904761905-26.7619047619048
5688.9109.761904761905-20.8619047619048
57115.9109.7619047619056.13809523809524
58104.2109.761904761905-5.56190476190476
59113.4109.7619047619053.63809523809524
60112.2109.7619047619052.43809523809524
61100.8109.761904761905-8.96190476190477
62107.3109.761904761905-2.46190476190477
63126.6109.76190476190516.8380952380952
64102.9109.761904761905-6.86190476190476
65117.9109.7619047619058.13809523809524
66128.8109.76190476190519.0380952380952
6787.5109.761904761905-22.2619047619048
6893.8109.761904761905-15.9619047619048
69122.7109.76190476190512.9380952380952
70126.2109.76190476190516.4380952380952
71124.6109.76190476190514.8380952380952
72116.7109.7619047619056.93809523809524
73115.2109.7619047619055.43809523809524
74111.1109.7619047619051.33809523809523
75129.9109.76190476190520.1380952380952
76113.3109.7619047619053.53809523809523
77118.5109.7619047619058.73809523809524
78133.5109.76190476190523.7380952380952
79102.1109.761904761905-7.66190476190477
80102.4109.761904761905-7.36190476190476

\begin{tabular}{lllllllll}
\hline
Multiple Linear Regression - Actuals, Interpolation, and Residuals \tabularnewline
Time or Index & Actuals & InterpolationForecast & ResidualsPrediction Error \tabularnewline
1 & 106.7 & 99.5657894736846 & 7.13421052631544 \tabularnewline
2 & 110.2 & 99.5657894736842 & 10.6342105263158 \tabularnewline
3 & 125.9 & 99.5657894736842 & 26.3342105263158 \tabularnewline
4 & 100.1 & 99.5657894736842 & 0.534210526315793 \tabularnewline
5 & 106.4 & 99.5657894736842 & 6.8342105263158 \tabularnewline
6 & 114.8 & 99.5657894736842 & 15.2342105263158 \tabularnewline
7 & 81.3 & 99.5657894736842 & -18.2657894736842 \tabularnewline
8 & 87 & 99.5657894736842 & -12.5657894736842 \tabularnewline
9 & 104.2 & 99.5657894736842 & 4.6342105263158 \tabularnewline
10 & 108 & 99.5657894736842 & 8.4342105263158 \tabularnewline
11 & 105 & 99.5657894736842 & 5.4342105263158 \tabularnewline
12 & 94.5 & 99.5657894736842 & -5.0657894736842 \tabularnewline
13 & 92 & 99.5657894736842 & -7.5657894736842 \tabularnewline
14 & 95.9 & 99.5657894736842 & -3.66578947368420 \tabularnewline
15 & 108.8 & 99.5657894736842 & 9.2342105263158 \tabularnewline
16 & 103.4 & 99.5657894736842 & 3.83421052631580 \tabularnewline
17 & 102.1 & 99.5657894736842 & 2.53421052631579 \tabularnewline
18 & 110.1 & 99.5657894736842 & 10.5342105263158 \tabularnewline
19 & 83.2 & 99.5657894736842 & -16.3657894736842 \tabularnewline
20 & 82.7 & 99.5657894736842 & -16.8657894736842 \tabularnewline
21 & 106.8 & 99.5657894736842 & 7.2342105263158 \tabularnewline
22 & 113.7 & 99.5657894736842 & 14.1342105263158 \tabularnewline
23 & 102.5 & 99.5657894736842 & 2.9342105263158 \tabularnewline
24 & 96.6 & 99.5657894736842 & -2.96578947368421 \tabularnewline
25 & 92.1 & 99.5657894736842 & -7.4657894736842 \tabularnewline
26 & 95.6 & 99.5657894736842 & -3.96578947368421 \tabularnewline
27 & 102.3 & 99.5657894736842 & 2.73421052631580 \tabularnewline
28 & 98.6 & 99.5657894736842 & -0.965789473684207 \tabularnewline
29 & 98.2 & 99.5657894736842 & -1.36578947368420 \tabularnewline
30 & 104.5 & 99.5657894736842 & 4.9342105263158 \tabularnewline
31 & 84 & 99.5657894736842 & -15.5657894736842 \tabularnewline
32 & 73.8 & 99.5657894736842 & -25.7657894736842 \tabularnewline
33 & 103.9 & 99.5657894736842 & 4.33421052631580 \tabularnewline
34 & 106 & 99.5657894736842 & 6.4342105263158 \tabularnewline
35 & 97.2 & 99.5657894736842 & -2.3657894736842 \tabularnewline
36 & 102.6 & 99.5657894736842 & 3.03421052631579 \tabularnewline
37 & 89 & 99.5657894736842 & -10.5657894736842 \tabularnewline
38 & 93.8 & 99.5657894736842 & -5.7657894736842 \tabularnewline
39 & 116.7 & 109.761904761905 & 6.93809523809524 \tabularnewline
40 & 106.8 & 109.761904761905 & -2.96190476190477 \tabularnewline
41 & 98.5 & 109.761904761905 & -11.2619047619048 \tabularnewline
42 & 118.7 & 109.761904761905 & 8.93809523809524 \tabularnewline
43 & 90 & 109.761904761905 & -19.7619047619048 \tabularnewline
44 & 91.9 & 109.761904761905 & -17.8619047619048 \tabularnewline
45 & 113.3 & 109.761904761905 & 3.53809523809523 \tabularnewline
46 & 113.1 & 109.761904761905 & 3.33809523809523 \tabularnewline
47 & 104.1 & 109.761904761905 & -5.66190476190477 \tabularnewline
48 & 108.7 & 109.761904761905 & -1.06190476190476 \tabularnewline
49 & 96.7 & 109.761904761905 & -13.0619047619048 \tabularnewline
50 & 101 & 109.761904761905 & -8.76190476190476 \tabularnewline
51 & 116.9 & 109.761904761905 & 7.13809523809524 \tabularnewline
52 & 105.8 & 109.761904761905 & -3.96190476190477 \tabularnewline
53 & 99 & 109.761904761905 & -10.7619047619048 \tabularnewline
54 & 129.4 & 109.761904761905 & 19.6380952380952 \tabularnewline
55 & 83 & 109.761904761905 & -26.7619047619048 \tabularnewline
56 & 88.9 & 109.761904761905 & -20.8619047619048 \tabularnewline
57 & 115.9 & 109.761904761905 & 6.13809523809524 \tabularnewline
58 & 104.2 & 109.761904761905 & -5.56190476190476 \tabularnewline
59 & 113.4 & 109.761904761905 & 3.63809523809524 \tabularnewline
60 & 112.2 & 109.761904761905 & 2.43809523809524 \tabularnewline
61 & 100.8 & 109.761904761905 & -8.96190476190477 \tabularnewline
62 & 107.3 & 109.761904761905 & -2.46190476190477 \tabularnewline
63 & 126.6 & 109.761904761905 & 16.8380952380952 \tabularnewline
64 & 102.9 & 109.761904761905 & -6.86190476190476 \tabularnewline
65 & 117.9 & 109.761904761905 & 8.13809523809524 \tabularnewline
66 & 128.8 & 109.761904761905 & 19.0380952380952 \tabularnewline
67 & 87.5 & 109.761904761905 & -22.2619047619048 \tabularnewline
68 & 93.8 & 109.761904761905 & -15.9619047619048 \tabularnewline
69 & 122.7 & 109.761904761905 & 12.9380952380952 \tabularnewline
70 & 126.2 & 109.761904761905 & 16.4380952380952 \tabularnewline
71 & 124.6 & 109.761904761905 & 14.8380952380952 \tabularnewline
72 & 116.7 & 109.761904761905 & 6.93809523809524 \tabularnewline
73 & 115.2 & 109.761904761905 & 5.43809523809524 \tabularnewline
74 & 111.1 & 109.761904761905 & 1.33809523809523 \tabularnewline
75 & 129.9 & 109.761904761905 & 20.1380952380952 \tabularnewline
76 & 113.3 & 109.761904761905 & 3.53809523809523 \tabularnewline
77 & 118.5 & 109.761904761905 & 8.73809523809524 \tabularnewline
78 & 133.5 & 109.761904761905 & 23.7380952380952 \tabularnewline
79 & 102.1 & 109.761904761905 & -7.66190476190477 \tabularnewline
80 & 102.4 & 109.761904761905 & -7.36190476190476 \tabularnewline
\hline
\end{tabular}
%Source: https://freestatistics.org/blog/index.php?pk=25453&T=4

[TABLE]
[ROW][C]Multiple Linear Regression - Actuals, Interpolation, and Residuals[/C][/ROW]
[ROW][C]Time or Index[/C][C]Actuals[/C][C]InterpolationForecast[/C][C]ResidualsPrediction Error[/C][/ROW]
[ROW][C]1[/C][C]106.7[/C][C]99.5657894736846[/C][C]7.13421052631544[/C][/ROW]
[ROW][C]2[/C][C]110.2[/C][C]99.5657894736842[/C][C]10.6342105263158[/C][/ROW]
[ROW][C]3[/C][C]125.9[/C][C]99.5657894736842[/C][C]26.3342105263158[/C][/ROW]
[ROW][C]4[/C][C]100.1[/C][C]99.5657894736842[/C][C]0.534210526315793[/C][/ROW]
[ROW][C]5[/C][C]106.4[/C][C]99.5657894736842[/C][C]6.8342105263158[/C][/ROW]
[ROW][C]6[/C][C]114.8[/C][C]99.5657894736842[/C][C]15.2342105263158[/C][/ROW]
[ROW][C]7[/C][C]81.3[/C][C]99.5657894736842[/C][C]-18.2657894736842[/C][/ROW]
[ROW][C]8[/C][C]87[/C][C]99.5657894736842[/C][C]-12.5657894736842[/C][/ROW]
[ROW][C]9[/C][C]104.2[/C][C]99.5657894736842[/C][C]4.6342105263158[/C][/ROW]
[ROW][C]10[/C][C]108[/C][C]99.5657894736842[/C][C]8.4342105263158[/C][/ROW]
[ROW][C]11[/C][C]105[/C][C]99.5657894736842[/C][C]5.4342105263158[/C][/ROW]
[ROW][C]12[/C][C]94.5[/C][C]99.5657894736842[/C][C]-5.0657894736842[/C][/ROW]
[ROW][C]13[/C][C]92[/C][C]99.5657894736842[/C][C]-7.5657894736842[/C][/ROW]
[ROW][C]14[/C][C]95.9[/C][C]99.5657894736842[/C][C]-3.66578947368420[/C][/ROW]
[ROW][C]15[/C][C]108.8[/C][C]99.5657894736842[/C][C]9.2342105263158[/C][/ROW]
[ROW][C]16[/C][C]103.4[/C][C]99.5657894736842[/C][C]3.83421052631580[/C][/ROW]
[ROW][C]17[/C][C]102.1[/C][C]99.5657894736842[/C][C]2.53421052631579[/C][/ROW]
[ROW][C]18[/C][C]110.1[/C][C]99.5657894736842[/C][C]10.5342105263158[/C][/ROW]
[ROW][C]19[/C][C]83.2[/C][C]99.5657894736842[/C][C]-16.3657894736842[/C][/ROW]
[ROW][C]20[/C][C]82.7[/C][C]99.5657894736842[/C][C]-16.8657894736842[/C][/ROW]
[ROW][C]21[/C][C]106.8[/C][C]99.5657894736842[/C][C]7.2342105263158[/C][/ROW]
[ROW][C]22[/C][C]113.7[/C][C]99.5657894736842[/C][C]14.1342105263158[/C][/ROW]
[ROW][C]23[/C][C]102.5[/C][C]99.5657894736842[/C][C]2.9342105263158[/C][/ROW]
[ROW][C]24[/C][C]96.6[/C][C]99.5657894736842[/C][C]-2.96578947368421[/C][/ROW]
[ROW][C]25[/C][C]92.1[/C][C]99.5657894736842[/C][C]-7.4657894736842[/C][/ROW]
[ROW][C]26[/C][C]95.6[/C][C]99.5657894736842[/C][C]-3.96578947368421[/C][/ROW]
[ROW][C]27[/C][C]102.3[/C][C]99.5657894736842[/C][C]2.73421052631580[/C][/ROW]
[ROW][C]28[/C][C]98.6[/C][C]99.5657894736842[/C][C]-0.965789473684207[/C][/ROW]
[ROW][C]29[/C][C]98.2[/C][C]99.5657894736842[/C][C]-1.36578947368420[/C][/ROW]
[ROW][C]30[/C][C]104.5[/C][C]99.5657894736842[/C][C]4.9342105263158[/C][/ROW]
[ROW][C]31[/C][C]84[/C][C]99.5657894736842[/C][C]-15.5657894736842[/C][/ROW]
[ROW][C]32[/C][C]73.8[/C][C]99.5657894736842[/C][C]-25.7657894736842[/C][/ROW]
[ROW][C]33[/C][C]103.9[/C][C]99.5657894736842[/C][C]4.33421052631580[/C][/ROW]
[ROW][C]34[/C][C]106[/C][C]99.5657894736842[/C][C]6.4342105263158[/C][/ROW]
[ROW][C]35[/C][C]97.2[/C][C]99.5657894736842[/C][C]-2.3657894736842[/C][/ROW]
[ROW][C]36[/C][C]102.6[/C][C]99.5657894736842[/C][C]3.03421052631579[/C][/ROW]
[ROW][C]37[/C][C]89[/C][C]99.5657894736842[/C][C]-10.5657894736842[/C][/ROW]
[ROW][C]38[/C][C]93.8[/C][C]99.5657894736842[/C][C]-5.7657894736842[/C][/ROW]
[ROW][C]39[/C][C]116.7[/C][C]109.761904761905[/C][C]6.93809523809524[/C][/ROW]
[ROW][C]40[/C][C]106.8[/C][C]109.761904761905[/C][C]-2.96190476190477[/C][/ROW]
[ROW][C]41[/C][C]98.5[/C][C]109.761904761905[/C][C]-11.2619047619048[/C][/ROW]
[ROW][C]42[/C][C]118.7[/C][C]109.761904761905[/C][C]8.93809523809524[/C][/ROW]
[ROW][C]43[/C][C]90[/C][C]109.761904761905[/C][C]-19.7619047619048[/C][/ROW]
[ROW][C]44[/C][C]91.9[/C][C]109.761904761905[/C][C]-17.8619047619048[/C][/ROW]
[ROW][C]45[/C][C]113.3[/C][C]109.761904761905[/C][C]3.53809523809523[/C][/ROW]
[ROW][C]46[/C][C]113.1[/C][C]109.761904761905[/C][C]3.33809523809523[/C][/ROW]
[ROW][C]47[/C][C]104.1[/C][C]109.761904761905[/C][C]-5.66190476190477[/C][/ROW]
[ROW][C]48[/C][C]108.7[/C][C]109.761904761905[/C][C]-1.06190476190476[/C][/ROW]
[ROW][C]49[/C][C]96.7[/C][C]109.761904761905[/C][C]-13.0619047619048[/C][/ROW]
[ROW][C]50[/C][C]101[/C][C]109.761904761905[/C][C]-8.76190476190476[/C][/ROW]
[ROW][C]51[/C][C]116.9[/C][C]109.761904761905[/C][C]7.13809523809524[/C][/ROW]
[ROW][C]52[/C][C]105.8[/C][C]109.761904761905[/C][C]-3.96190476190477[/C][/ROW]
[ROW][C]53[/C][C]99[/C][C]109.761904761905[/C][C]-10.7619047619048[/C][/ROW]
[ROW][C]54[/C][C]129.4[/C][C]109.761904761905[/C][C]19.6380952380952[/C][/ROW]
[ROW][C]55[/C][C]83[/C][C]109.761904761905[/C][C]-26.7619047619048[/C][/ROW]
[ROW][C]56[/C][C]88.9[/C][C]109.761904761905[/C][C]-20.8619047619048[/C][/ROW]
[ROW][C]57[/C][C]115.9[/C][C]109.761904761905[/C][C]6.13809523809524[/C][/ROW]
[ROW][C]58[/C][C]104.2[/C][C]109.761904761905[/C][C]-5.56190476190476[/C][/ROW]
[ROW][C]59[/C][C]113.4[/C][C]109.761904761905[/C][C]3.63809523809524[/C][/ROW]
[ROW][C]60[/C][C]112.2[/C][C]109.761904761905[/C][C]2.43809523809524[/C][/ROW]
[ROW][C]61[/C][C]100.8[/C][C]109.761904761905[/C][C]-8.96190476190477[/C][/ROW]
[ROW][C]62[/C][C]107.3[/C][C]109.761904761905[/C][C]-2.46190476190477[/C][/ROW]
[ROW][C]63[/C][C]126.6[/C][C]109.761904761905[/C][C]16.8380952380952[/C][/ROW]
[ROW][C]64[/C][C]102.9[/C][C]109.761904761905[/C][C]-6.86190476190476[/C][/ROW]
[ROW][C]65[/C][C]117.9[/C][C]109.761904761905[/C][C]8.13809523809524[/C][/ROW]
[ROW][C]66[/C][C]128.8[/C][C]109.761904761905[/C][C]19.0380952380952[/C][/ROW]
[ROW][C]67[/C][C]87.5[/C][C]109.761904761905[/C][C]-22.2619047619048[/C][/ROW]
[ROW][C]68[/C][C]93.8[/C][C]109.761904761905[/C][C]-15.9619047619048[/C][/ROW]
[ROW][C]69[/C][C]122.7[/C][C]109.761904761905[/C][C]12.9380952380952[/C][/ROW]
[ROW][C]70[/C][C]126.2[/C][C]109.761904761905[/C][C]16.4380952380952[/C][/ROW]
[ROW][C]71[/C][C]124.6[/C][C]109.761904761905[/C][C]14.8380952380952[/C][/ROW]
[ROW][C]72[/C][C]116.7[/C][C]109.761904761905[/C][C]6.93809523809524[/C][/ROW]
[ROW][C]73[/C][C]115.2[/C][C]109.761904761905[/C][C]5.43809523809524[/C][/ROW]
[ROW][C]74[/C][C]111.1[/C][C]109.761904761905[/C][C]1.33809523809523[/C][/ROW]
[ROW][C]75[/C][C]129.9[/C][C]109.761904761905[/C][C]20.1380952380952[/C][/ROW]
[ROW][C]76[/C][C]113.3[/C][C]109.761904761905[/C][C]3.53809523809523[/C][/ROW]
[ROW][C]77[/C][C]118.5[/C][C]109.761904761905[/C][C]8.73809523809524[/C][/ROW]
[ROW][C]78[/C][C]133.5[/C][C]109.761904761905[/C][C]23.7380952380952[/C][/ROW]
[ROW][C]79[/C][C]102.1[/C][C]109.761904761905[/C][C]-7.66190476190477[/C][/ROW]
[ROW][C]80[/C][C]102.4[/C][C]109.761904761905[/C][C]-7.36190476190476[/C][/ROW]
[/TABLE]
Source: https://freestatistics.org/blog/index.php?pk=25453&T=4

Globally Unique Identifier (entire table): ba.freestatistics.org/blog/index.php?pk=25453&T=4

As an alternative you can also use a QR Code:  

The GUIDs for individual cells are displayed in the table below:

Multiple Linear Regression - Actuals, Interpolation, and Residuals
Time or IndexActualsInterpolationForecastResidualsPrediction Error
1106.799.56578947368467.13421052631544
2110.299.565789473684210.6342105263158
3125.999.565789473684226.3342105263158
4100.199.56578947368420.534210526315793
5106.499.56578947368426.8342105263158
6114.899.565789473684215.2342105263158
781.399.5657894736842-18.2657894736842
88799.5657894736842-12.5657894736842
9104.299.56578947368424.6342105263158
1010899.56578947368428.4342105263158
1110599.56578947368425.4342105263158
1294.599.5657894736842-5.0657894736842
139299.5657894736842-7.5657894736842
1495.999.5657894736842-3.66578947368420
15108.899.56578947368429.2342105263158
16103.499.56578947368423.83421052631580
17102.199.56578947368422.53421052631579
18110.199.565789473684210.5342105263158
1983.299.5657894736842-16.3657894736842
2082.799.5657894736842-16.8657894736842
21106.899.56578947368427.2342105263158
22113.799.565789473684214.1342105263158
23102.599.56578947368422.9342105263158
2496.699.5657894736842-2.96578947368421
2592.199.5657894736842-7.4657894736842
2695.699.5657894736842-3.96578947368421
27102.399.56578947368422.73421052631580
2898.699.5657894736842-0.965789473684207
2998.299.5657894736842-1.36578947368420
30104.599.56578947368424.9342105263158
318499.5657894736842-15.5657894736842
3273.899.5657894736842-25.7657894736842
33103.999.56578947368424.33421052631580
3410699.56578947368426.4342105263158
3597.299.5657894736842-2.3657894736842
36102.699.56578947368423.03421052631579
378999.5657894736842-10.5657894736842
3893.899.5657894736842-5.7657894736842
39116.7109.7619047619056.93809523809524
40106.8109.761904761905-2.96190476190477
4198.5109.761904761905-11.2619047619048
42118.7109.7619047619058.93809523809524
4390109.761904761905-19.7619047619048
4491.9109.761904761905-17.8619047619048
45113.3109.7619047619053.53809523809523
46113.1109.7619047619053.33809523809523
47104.1109.761904761905-5.66190476190477
48108.7109.761904761905-1.06190476190476
4996.7109.761904761905-13.0619047619048
50101109.761904761905-8.76190476190476
51116.9109.7619047619057.13809523809524
52105.8109.761904761905-3.96190476190477
5399109.761904761905-10.7619047619048
54129.4109.76190476190519.6380952380952
5583109.761904761905-26.7619047619048
5688.9109.761904761905-20.8619047619048
57115.9109.7619047619056.13809523809524
58104.2109.761904761905-5.56190476190476
59113.4109.7619047619053.63809523809524
60112.2109.7619047619052.43809523809524
61100.8109.761904761905-8.96190476190477
62107.3109.761904761905-2.46190476190477
63126.6109.76190476190516.8380952380952
64102.9109.761904761905-6.86190476190476
65117.9109.7619047619058.13809523809524
66128.8109.76190476190519.0380952380952
6787.5109.761904761905-22.2619047619048
6893.8109.761904761905-15.9619047619048
69122.7109.76190476190512.9380952380952
70126.2109.76190476190516.4380952380952
71124.6109.76190476190514.8380952380952
72116.7109.7619047619056.93809523809524
73115.2109.7619047619055.43809523809524
74111.1109.7619047619051.33809523809523
75129.9109.76190476190520.1380952380952
76113.3109.7619047619053.53809523809523
77118.5109.7619047619058.73809523809524
78133.5109.76190476190523.7380952380952
79102.1109.761904761905-7.66190476190477
80102.4109.761904761905-7.36190476190476


Parameters (Session):
par1 = 1 ; par2 = Do not include Seasonal Dummies ; par3 = No Linear Trend ;
Parameters (R input):
par1 = 1 ; par2 = Do not include Seasonal Dummies ; par3 = No Linear Trend ;
R code (references can be found in the software module):
library(lattice)
par1 <- as.numeric(par1)
x <- t(y)
k <- length(x[1,])
n <- length(x[,1])
x1 <- cbind(x[,par1], x[,1:k!=par1])
mycolnames <- c(colnames(x)[par1], colnames(x)[1:k!=par1])
colnames(x1) <- mycolnames #colnames(x)[par1]
x <- x1
if (par3 == 'First Differences'){
x2 <- array(0, dim=c(n-1,k), dimnames=list(1:(n-1), paste('(1-B)',colnames(x),sep='')))
for (i in 1:n-1) {
for (j in 1:k) {
x2[i,j] <- x[i+1,j] - x[i,j]
}
}
x <- x2
}
if (par2 == 'Include Monthly Dummies'){
x2 <- array(0, dim=c(n,11), dimnames=list(1:n, paste('M', seq(1:11), sep ='')))
for (i in 1:11){
x2[seq(i,n,12),i] <- 1
}
x <- cbind(x, x2)
}
if (par2 == 'Include Quarterly Dummies'){
x2 <- array(0, dim=c(n,3), dimnames=list(1:n, paste('Q', seq(1:3), sep ='')))
for (i in 1:3){
x2[seq(i,n,4),i] <- 1
}
x <- cbind(x, x2)
}
k <- length(x[1,])
if (par3 == 'Linear Trend'){
x <- cbind(x, c(1:n))
colnames(x)[k+1] <- 't'
}
x
k <- length(x[1,])
df <- as.data.frame(x)
(mylm <- lm(df))
(mysum <- summary(mylm))
bitmap(file='test0.png')
plot(x[,1], type='l', main='Actuals and Interpolation', ylab='value of Actuals and Interpolation (dots)', xlab='time or index')
points(x[,1]-mysum$resid)
grid()
dev.off()
bitmap(file='test1.png')
plot(mysum$resid, type='b', pch=19, main='Residuals', ylab='value of Residuals', xlab='time or index')
grid()
dev.off()
bitmap(file='test2.png')
hist(mysum$resid, main='Residual Histogram', xlab='values of Residuals')
grid()
dev.off()
bitmap(file='test3.png')
densityplot(~mysum$resid,col='black',main='Residual Density Plot', xlab='values of Residuals')
dev.off()
bitmap(file='test4.png')
qqnorm(mysum$resid, main='Residual Normal Q-Q Plot')
grid()
dev.off()
(myerror <- as.ts(mysum$resid))
bitmap(file='test5.png')
dum <- cbind(lag(myerror,k=1),myerror)
dum
dum1 <- dum[2:length(myerror),]
dum1
z <- as.data.frame(dum1)
z
plot(z,main=paste('Residual Lag plot, lowess, and regression line'), ylab='values of Residuals', xlab='lagged values of Residuals')
lines(lowess(z))
abline(lm(z))
grid()
dev.off()
bitmap(file='test6.png')
acf(mysum$resid, lag.max=length(mysum$resid)/2, main='Residual Autocorrelation Function')
grid()
dev.off()
bitmap(file='test7.png')
pacf(mysum$resid, lag.max=length(mysum$resid)/2, main='Residual Partial Autocorrelation Function')
grid()
dev.off()
bitmap(file='test8.png')
opar <- par(mfrow = c(2,2), oma = c(0, 0, 1.1, 0))
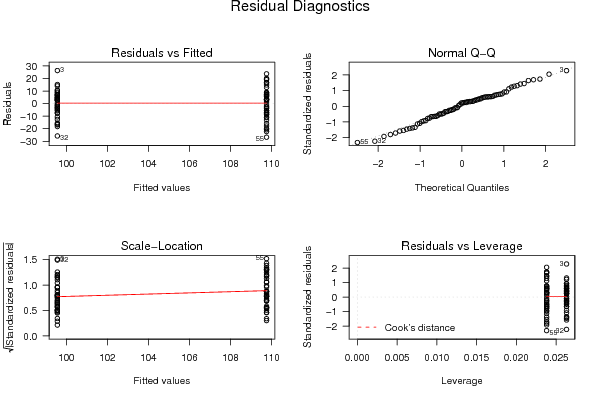
plot(mylm, las = 1, sub='Residual Diagnostics')
par(opar)
dev.off()
load(file='createtable')
a<-table.start()
a<-table.row.start(a)
a<-table.element(a, 'Multiple Linear Regression - Estimated Regression Equation', 1, TRUE)
a<-table.row.end(a)
myeq <- colnames(x)[1]
myeq <- paste(myeq, '[t] = ', sep='')
for (i in 1:k){
if (mysum$coefficients[i,1] > 0) myeq <- paste(myeq, '+', '')
myeq <- paste(myeq, mysum$coefficients[i,1], sep=' ')
if (rownames(mysum$coefficients)[i] != '(Intercept)') {
myeq <- paste(myeq, rownames(mysum$coefficients)[i], sep='')
if (rownames(mysum$coefficients)[i] != 't') myeq <- paste(myeq, '[t]', sep='')
}
}
myeq <- paste(myeq, ' + e[t]')
a<-table.row.start(a)
a<-table.element(a, myeq)
a<-table.row.end(a)
a<-table.end(a)
table.save(a,file='mytable1.tab')
a<-table.start()
a<-table.row.start(a)
a<-table.element(a,hyperlink('ols1.htm','Multiple Linear Regression - Ordinary Least Squares',''), 6, TRUE)
a<-table.row.end(a)
a<-table.row.start(a)
a<-table.element(a,'Variable',header=TRUE)
a<-table.element(a,'Parameter',header=TRUE)
a<-table.element(a,'S.D.',header=TRUE)
a<-table.element(a,'T-STAT
H0: parameter = 0',header=TRUE)
a<-table.element(a,'2-tail p-value',header=TRUE)
a<-table.element(a,'1-tail p-value',header=TRUE)
a<-table.row.end(a)
for (i in 1:k){
a<-table.row.start(a)
a<-table.element(a,rownames(mysum$coefficients)[i],header=TRUE)
a<-table.element(a,mysum$coefficients[i,1])
a<-table.element(a, round(mysum$coefficients[i,2],6))
a<-table.element(a, round(mysum$coefficients[i,3],4))
a<-table.element(a, round(mysum$coefficients[i,4],6))
a<-table.element(a, round(mysum$coefficients[i,4]/2,6))
a<-table.row.end(a)
}
a<-table.end(a)
table.save(a,file='mytable2.tab')
a<-table.start()
a<-table.row.start(a)
a<-table.element(a, 'Multiple Linear Regression - Regression Statistics', 2, TRUE)
a<-table.row.end(a)
a<-table.row.start(a)
a<-table.element(a, 'Multiple R',1,TRUE)
a<-table.element(a, sqrt(mysum$r.squared))
a<-table.row.end(a)
a<-table.row.start(a)
a<-table.element(a, 'R-squared',1,TRUE)
a<-table.element(a, mysum$r.squared)
a<-table.row.end(a)
a<-table.row.start(a)
a<-table.element(a, 'Adjusted R-squared',1,TRUE)
a<-table.element(a, mysum$adj.r.squared)
a<-table.row.end(a)
a<-table.row.start(a)
a<-table.element(a, 'F-TEST (value)',1,TRUE)
a<-table.element(a, mysum$fstatistic[1])
a<-table.row.end(a)
a<-table.row.start(a)
a<-table.element(a, 'F-TEST (DF numerator)',1,TRUE)
a<-table.element(a, mysum$fstatistic[2])
a<-table.row.end(a)
a<-table.row.start(a)
a<-table.element(a, 'F-TEST (DF denominator)',1,TRUE)
a<-table.element(a, mysum$fstatistic[3])
a<-table.row.end(a)
a<-table.row.start(a)
a<-table.element(a, 'p-value',1,TRUE)
a<-table.element(a, 1-pf(mysum$fstatistic[1],mysum$fstatistic[2],mysum$fstatistic[3]))
a<-table.row.end(a)
a<-table.row.start(a)
a<-table.element(a, 'Multiple Linear Regression - Residual Statistics', 2, TRUE)
a<-table.row.end(a)
a<-table.row.start(a)
a<-table.element(a, 'Residual Standard Deviation',1,TRUE)
a<-table.element(a, mysum$sigma)
a<-table.row.end(a)
a<-table.row.start(a)
a<-table.element(a, 'Sum Squared Residuals',1,TRUE)
a<-table.element(a, sum(myerror*myerror))
a<-table.row.end(a)
a<-table.end(a)
table.save(a,file='mytable3.tab')
a<-table.start()
a<-table.row.start(a)
a<-table.element(a, 'Multiple Linear Regression - Actuals, Interpolation, and Residuals', 4, TRUE)
a<-table.row.end(a)
a<-table.row.start(a)
a<-table.element(a, 'Time or Index', 1, TRUE)
a<-table.element(a, 'Actuals', 1, TRUE)
a<-table.element(a, 'Interpolation
Forecast', 1, TRUE)
a<-table.element(a, 'Residuals
Prediction Error', 1, TRUE)
a<-table.row.end(a)
for (i in 1:n) {
a<-table.row.start(a)
a<-table.element(a,i, 1, TRUE)
a<-table.element(a,x[i])
a<-table.element(a,x[i]-mysum$resid[i])
a<-table.element(a,mysum$resid[i])
a<-table.row.end(a)
}
a<-table.end(a)
table.save(a,file='mytable4.tab')