Free Statistics

of Irreproducible Research!

Author's title

Author*Unverified author*
R Software Modulerwasp_multipleregression.wasp
Title produced by softwareMultiple Regression
Date of computationMon, 24 Nov 2008 08:38:53 -0700
Cite this page as followsStatistical Computations at FreeStatistics.org, Office for Research Development and Education, URL https://freestatistics.org/blog/index.php?v=date/2008/Nov/24/t1227541163im80vke773an81l.htm/, Retrieved Tue, 14 May 2024 10:36:54 +0000
Statistical Computations at FreeStatistics.org, Office for Research Development and Education, URL https://freestatistics.org/blog/index.php?pk=25444, Retrieved Tue, 14 May 2024 10:36:54 +0000
QR Codes:

Original text written by user:
IsPrivate?No (this computation is public)
User-defined keywords
Estimated Impact194
Family? (F = Feedback message, R = changed R code, M = changed R Module, P = changed Parameters, D = changed Data)
F     [Multiple Regression] [] [2007-11-19 20:22:41] [3a1956effdcb54c39e5044435310d6c8]
F R  D    [Multiple Regression] [Q3] [2008-11-24 15:38:53] [ee28d11f695cd3bc1f8bbd77ba77987a] [Current]
Feedback Forum
2008-11-30 10:26:04 [An De Koninck] [reply
De student heeft deze opdracht vrij goed uitgevoerd.
Hij heeft de correcte gegevens ingevoerd en eerst en vooral alle parameters uitgelegd.
De grafieken die de student besproken heeft lijken me juist te zijn.
Het valt me wel op dat de conclusies nogal sterk gebaseerd zijn op de conclusies van het voorbeeld, maar dan gebaseerd op de tijdsreeksen van de student.

Het is correct dat er sprake is van een positieve stijging. Ik denk dat dit vrij logisch is aangezien een index over het algemeen stijgend verloopt.
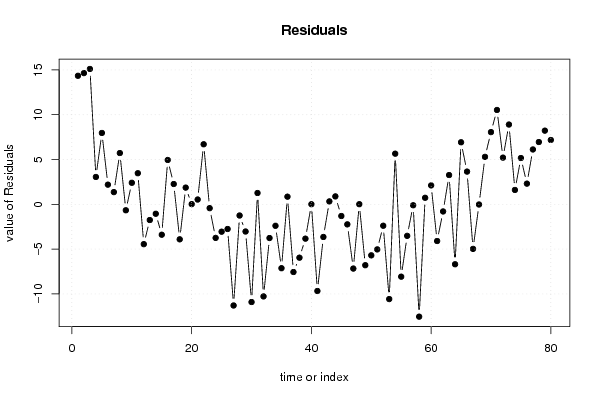
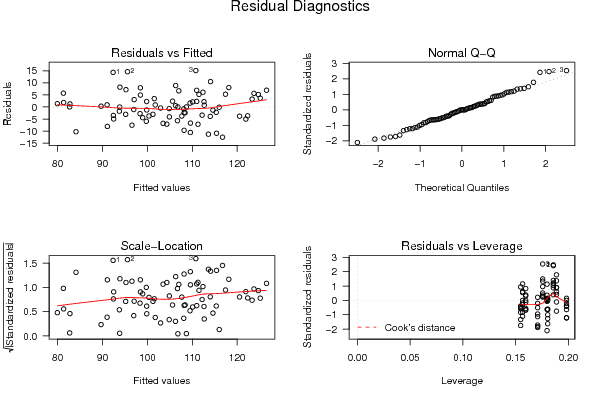
De voorspellingsfouten zijn inderdaad helemaal niet gelijk aan 0, er zijn veel pieken (zowel stijgende als dalende) te bekennen.
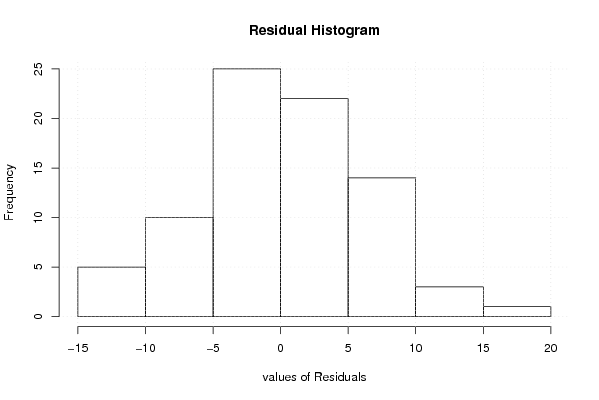
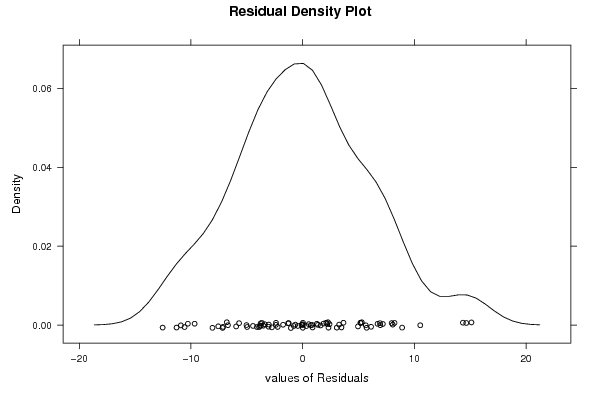
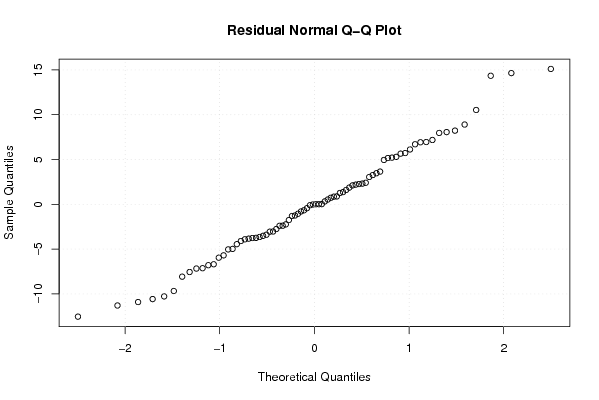
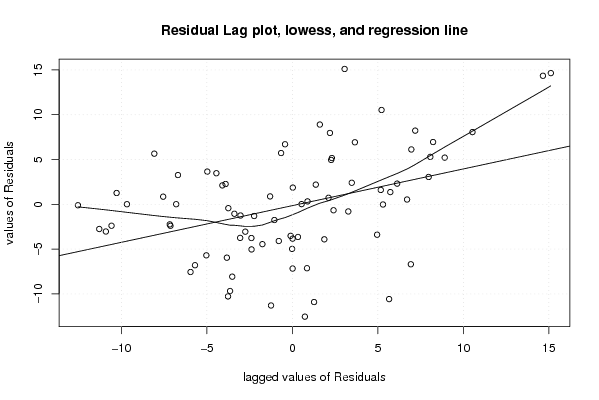
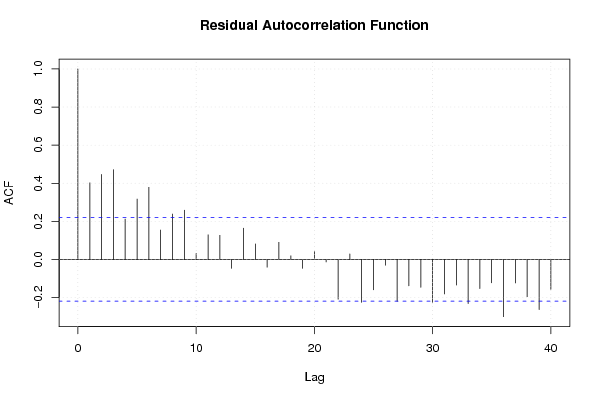
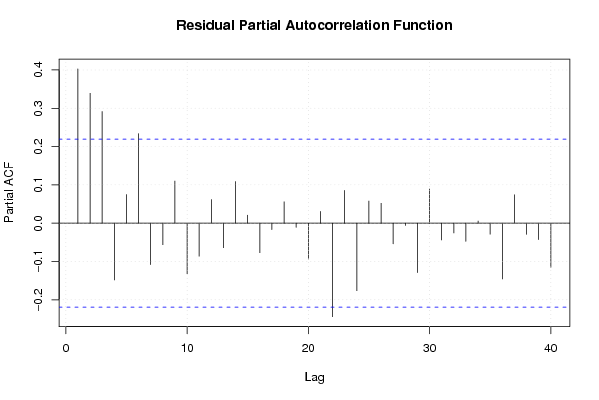
De normaalverdeling van de voorspellingsfouten zijn vrij normaal verdeeld, behalve dat er aan de staarten wat outliers te bekennen zijn. De correlatie is inderdaad klein tussen de voorspellingsfout nu en die van vorige maand.
2008-11-30 15:11:33 [Evelyn Ongena] [reply
Persoonlijk vind ik dat we hier kunnen zien in de actuals en interpolation dat er eerst een dalende trend is gevolg door een stijgende trend. Bovendien was het leuk geweest moest de creativiteit van de student naar boven zijn gekomen en een voorbeeld van een gebeurtenis hebben aangehaald. De conclusie van de student is inderdaad correct waardoor ik moet bekennen dat ze deze opdracht goed heeft uitgevoerd.
2008-11-30 17:50:25 [An De Koninck] [reply
Evelyn, ik zie toch niet eerst een dalende trend! De eerste rode lijn is horizontaal, zeker niet dalend. En als je het over het geheel bekijkt zie je duidelijk een stijgende trend!
2008-12-01 19:10:26 [Jeroen Aerts] [reply
Ik zou zeggen dat het zelfs nog straffer kan... Namelijk niet enkel de besluiten lijken sterk op die van het voorbeeld, ook de grafieken, de getallen enz... Dit is namelijk een print screen van het voorbeeld. Hierover een conclusie geven lijkt me dus zinloos.

Toch, om mijn verbeteringen te vervolledigen: Er is inderdaad een positieve stijging. De voorspellingsfouten zijn niet nul.
De voorspellingsfouten zijn bijna normaal verdeeld, op enkele outliers na.

Post a new message
Dataseries X:
106.7	0
110.2	0
125.9	0
100.1	0
106.4	0
114.8	0
81.3	0
87	0
104.2	0
108	0
105	0
94.5	0
92	0
95.9	0
108.8	0
103.4	0
102.1	0
110.1	0
83.2	0
82.7	0
106.8	0
113.7	0
102.5	0
96.6	0
92.1	0
95.6	0
102.3	0
98.6	0
98.2	0
104.5	0
84	0
73.8	0
103.9	0
106	0
97.2	0
102.6	0
89	0
93.8	0
116.7	1
106.8	1
98.5	1
118.7	1
90	1
91.9	1
113.3	1
113.1	1
104.1	1
108.7	1
96.7	1
101	1
116.9	1
105.8	1
99	1
129.4	1
83	1
88.9	1
115.9	1
104.2	1
113.4	1
112.2	1
100.8	1
107.3	1
126.6	1
102.9	1
117.9	1
128.8	1
87.5	1
93.8	1
122.7	1
126.2	1
124.6	1
116.7	1
115.2	1
111.1	1
129.9	1
113.3	1
118.5	1
133.5	1
102.1	1
102.4	1


Summary of computational transaction
Raw Inputview raw input (R code)
Raw Outputview raw output of R engine
Computing time6 seconds
R Server'Herman Ole Andreas Wold' @ 193.190.124.10:1001

\begin{tabular}{lllllllll}
\hline
Summary of computational transaction \tabularnewline
Raw Input & view raw input (R code)  \tabularnewline
Raw Output & view raw output of R engine  \tabularnewline
Computing time & 6 seconds \tabularnewline
R Server & 'Herman Ole Andreas Wold' @ 193.190.124.10:1001 \tabularnewline
\hline
\end{tabular}
%Source: https://freestatistics.org/blog/index.php?pk=25444&T=0

[TABLE]
[ROW][C]Summary of computational transaction[/C][/ROW]
[ROW][C]Raw Input[/C][C]view raw input (R code) [/C][/ROW]
[ROW][C]Raw Output[/C][C]view raw output of R engine [/C][/ROW]
[ROW][C]Computing time[/C][C]6 seconds[/C][/ROW]
[ROW][C]R Server[/C][C]'Herman Ole Andreas Wold' @ 193.190.124.10:1001[/C][/ROW]
[/TABLE]
Source: https://freestatistics.org/blog/index.php?pk=25444&T=0

Globally Unique Identifier (entire table): ba.freestatistics.org/blog/index.php?pk=25444&T=0

As an alternative you can also use a QR Code:  

The GUIDs for individual cells are displayed in the table below:

Summary of computational transaction
Raw Inputview raw input (R code)
Raw Outputview raw output of R engine
Computing time6 seconds
R Server'Herman Ole Andreas Wold' @ 193.190.124.10:1001


Multiple Linear Regression - Estimated Regression Equation
y[t] = + 97.545 + 5.53874999999999x[t] -5.30886408730161M1[t] -2.22558531746032M2[t] + 12.8950148809524M3[t] -0.964563492063495M4[t] + 0.30442956349206M5[t] + 14.3591369047619M6[t] -18.4290128968254M7[t] -17.2028769841270M8[t] + 6.26683035714286M9[t] + 6.88344246031746M10[t] + 2.70005456349206M11[t] + 0.116721230158730t + e[t]

\begin{tabular}{lllllllll}
\hline
Multiple Linear Regression - Estimated Regression Equation \tabularnewline
y[t] =  +  97.545 +  5.53874999999999x[t] -5.30886408730161M1[t] -2.22558531746032M2[t] +  12.8950148809524M3[t] -0.964563492063495M4[t] +  0.30442956349206M5[t] +  14.3591369047619M6[t] -18.4290128968254M7[t] -17.2028769841270M8[t] +  6.26683035714286M9[t] +  6.88344246031746M10[t] +  2.70005456349206M11[t] +  0.116721230158730t  + e[t] \tabularnewline
\hline
\end{tabular}
%Source: https://freestatistics.org/blog/index.php?pk=25444&T=1

[TABLE]
[ROW][C]Multiple Linear Regression - Estimated Regression Equation[/C][/ROW]
[ROW][C]y[t] =  +  97.545 +  5.53874999999999x[t] -5.30886408730161M1[t] -2.22558531746032M2[t] +  12.8950148809524M3[t] -0.964563492063495M4[t] +  0.30442956349206M5[t] +  14.3591369047619M6[t] -18.4290128968254M7[t] -17.2028769841270M8[t] +  6.26683035714286M9[t] +  6.88344246031746M10[t] +  2.70005456349206M11[t] +  0.116721230158730t  + e[t][/C][/ROW]
[/TABLE]
Source: https://freestatistics.org/blog/index.php?pk=25444&T=1

Globally Unique Identifier (entire table): ba.freestatistics.org/blog/index.php?pk=25444&T=1

As an alternative you can also use a QR Code:  

The GUIDs for individual cells are displayed in the table below:

Multiple Linear Regression - Estimated Regression Equation
y[t] = + 97.545 + 5.53874999999999x[t] -5.30886408730161M1[t] -2.22558531746032M2[t] + 12.8950148809524M3[t] -0.964563492063495M4[t] + 0.30442956349206M5[t] + 14.3591369047619M6[t] -18.4290128968254M7[t] -17.2028769841270M8[t] + 6.26683035714286M9[t] + 6.88344246031746M10[t] + 2.70005456349206M11[t] + 0.116721230158730t + e[t]


Multiple Linear Regression - Ordinary Least Squares
VariableParameterS.D.T-STATH0: parameter = 02-tail p-value1-tail p-value
(Intercept)97.5453.11727131.291800
x5.538749999999992.9694481.86520.0665930.033297
M1-5.308864087301613.660279-1.45040.1516830.075842
M2-2.225585317460323.658449-0.60830.5450490.272525
M312.89501488095243.6770183.50690.0008210.00041
M4-0.9645634920634953.671017-0.26280.7935610.39678
M50.304429563492063.6661270.0830.9340720.467036
M614.35913690476193.6623513.92070.0002130.000106
M7-18.42901289682543.659693-5.03574e-062e-06
M8-17.20287698412703.658156-4.70261.4e-057e-06
M96.266830357142863.7990891.64960.1037850.051892
M106.883442460317463.7963861.81320.0743550.037177
M112.700054563492063.7947630.71150.4792690.239634
t0.1167212301587300.0640781.82150.0730570.036529

\begin{tabular}{lllllllll}
\hline
Multiple Linear Regression - Ordinary Least Squares \tabularnewline
Variable & Parameter & S.D. & T-STATH0: parameter = 0 & 2-tail p-value & 1-tail p-value \tabularnewline
(Intercept) & 97.545 & 3.117271 & 31.2918 & 0 & 0 \tabularnewline
x & 5.53874999999999 & 2.969448 & 1.8652 & 0.066593 & 0.033297 \tabularnewline
M1 & -5.30886408730161 & 3.660279 & -1.4504 & 0.151683 & 0.075842 \tabularnewline
M2 & -2.22558531746032 & 3.658449 & -0.6083 & 0.545049 & 0.272525 \tabularnewline
M3 & 12.8950148809524 & 3.677018 & 3.5069 & 0.000821 & 0.00041 \tabularnewline
M4 & -0.964563492063495 & 3.671017 & -0.2628 & 0.793561 & 0.39678 \tabularnewline
M5 & 0.30442956349206 & 3.666127 & 0.083 & 0.934072 & 0.467036 \tabularnewline
M6 & 14.3591369047619 & 3.662351 & 3.9207 & 0.000213 & 0.000106 \tabularnewline
M7 & -18.4290128968254 & 3.659693 & -5.0357 & 4e-06 & 2e-06 \tabularnewline
M8 & -17.2028769841270 & 3.658156 & -4.7026 & 1.4e-05 & 7e-06 \tabularnewline
M9 & 6.26683035714286 & 3.799089 & 1.6496 & 0.103785 & 0.051892 \tabularnewline
M10 & 6.88344246031746 & 3.796386 & 1.8132 & 0.074355 & 0.037177 \tabularnewline
M11 & 2.70005456349206 & 3.794763 & 0.7115 & 0.479269 & 0.239634 \tabularnewline
t & 0.116721230158730 & 0.064078 & 1.8215 & 0.073057 & 0.036529 \tabularnewline
\hline
\end{tabular}
%Source: https://freestatistics.org/blog/index.php?pk=25444&T=2

[TABLE]
[ROW][C]Multiple Linear Regression - Ordinary Least Squares[/C][/ROW]
[ROW][C]Variable[/C][C]Parameter[/C][C]S.D.[/C][C]T-STATH0: parameter = 0[/C][C]2-tail p-value[/C][C]1-tail p-value[/C][/ROW]
[ROW][C](Intercept)[/C][C]97.545[/C][C]3.117271[/C][C]31.2918[/C][C]0[/C][C]0[/C][/ROW]
[ROW][C]x[/C][C]5.53874999999999[/C][C]2.969448[/C][C]1.8652[/C][C]0.066593[/C][C]0.033297[/C][/ROW]
[ROW][C]M1[/C][C]-5.30886408730161[/C][C]3.660279[/C][C]-1.4504[/C][C]0.151683[/C][C]0.075842[/C][/ROW]
[ROW][C]M2[/C][C]-2.22558531746032[/C][C]3.658449[/C][C]-0.6083[/C][C]0.545049[/C][C]0.272525[/C][/ROW]
[ROW][C]M3[/C][C]12.8950148809524[/C][C]3.677018[/C][C]3.5069[/C][C]0.000821[/C][C]0.00041[/C][/ROW]
[ROW][C]M4[/C][C]-0.964563492063495[/C][C]3.671017[/C][C]-0.2628[/C][C]0.793561[/C][C]0.39678[/C][/ROW]
[ROW][C]M5[/C][C]0.30442956349206[/C][C]3.666127[/C][C]0.083[/C][C]0.934072[/C][C]0.467036[/C][/ROW]
[ROW][C]M6[/C][C]14.3591369047619[/C][C]3.662351[/C][C]3.9207[/C][C]0.000213[/C][C]0.000106[/C][/ROW]
[ROW][C]M7[/C][C]-18.4290128968254[/C][C]3.659693[/C][C]-5.0357[/C][C]4e-06[/C][C]2e-06[/C][/ROW]
[ROW][C]M8[/C][C]-17.2028769841270[/C][C]3.658156[/C][C]-4.7026[/C][C]1.4e-05[/C][C]7e-06[/C][/ROW]
[ROW][C]M9[/C][C]6.26683035714286[/C][C]3.799089[/C][C]1.6496[/C][C]0.103785[/C][C]0.051892[/C][/ROW]
[ROW][C]M10[/C][C]6.88344246031746[/C][C]3.796386[/C][C]1.8132[/C][C]0.074355[/C][C]0.037177[/C][/ROW]
[ROW][C]M11[/C][C]2.70005456349206[/C][C]3.794763[/C][C]0.7115[/C][C]0.479269[/C][C]0.239634[/C][/ROW]
[ROW][C]t[/C][C]0.116721230158730[/C][C]0.064078[/C][C]1.8215[/C][C]0.073057[/C][C]0.036529[/C][/ROW]
[/TABLE]
Source: https://freestatistics.org/blog/index.php?pk=25444&T=2

Globally Unique Identifier (entire table): ba.freestatistics.org/blog/index.php?pk=25444&T=2

As an alternative you can also use a QR Code:  

The GUIDs for individual cells are displayed in the table below:

Multiple Linear Regression - Ordinary Least Squares
VariableParameterS.D.T-STATH0: parameter = 02-tail p-value1-tail p-value
(Intercept)97.5453.11727131.291800
x5.538749999999992.9694481.86520.0665930.033297
M1-5.308864087301613.660279-1.45040.1516830.075842
M2-2.225585317460323.658449-0.60830.5450490.272525
M312.89501488095243.6770183.50690.0008210.00041
M4-0.9645634920634953.671017-0.26280.7935610.39678
M50.304429563492063.6661270.0830.9340720.467036
M614.35913690476193.6623513.92070.0002130.000106
M7-18.42901289682543.659693-5.03574e-062e-06
M8-17.20287698412703.658156-4.70261.4e-057e-06
M96.266830357142863.7990891.64960.1037850.051892
M106.883442460317463.7963861.81320.0743550.037177
M112.700054563492063.7947630.71150.4792690.239634
t0.1167212301587300.0640781.82150.0730570.036529


Multiple Linear Regression - Regression Statistics
Multiple R0.881461940737189
R-squared0.776975152968171
Adjusted R-squared0.733046016431599
F-TEST (value)17.6870117244694
F-TEST (DF numerator)13
F-TEST (DF denominator)66
p-value1.11022302462516e-16
Multiple Linear Regression - Residual Statistics
Residual Standard Deviation6.57178533306779
Sum Squared Residuals2850.43192261904

\begin{tabular}{lllllllll}
\hline
Multiple Linear Regression - Regression Statistics \tabularnewline
Multiple R & 0.881461940737189 \tabularnewline
R-squared & 0.776975152968171 \tabularnewline
Adjusted R-squared & 0.733046016431599 \tabularnewline
F-TEST (value) & 17.6870117244694 \tabularnewline
F-TEST (DF numerator) & 13 \tabularnewline
F-TEST (DF denominator) & 66 \tabularnewline
p-value & 1.11022302462516e-16 \tabularnewline
Multiple Linear Regression - Residual Statistics \tabularnewline
Residual Standard Deviation & 6.57178533306779 \tabularnewline
Sum Squared Residuals & 2850.43192261904 \tabularnewline
\hline
\end{tabular}
%Source: https://freestatistics.org/blog/index.php?pk=25444&T=3

[TABLE]
[ROW][C]Multiple Linear Regression - Regression Statistics[/C][/ROW]
[ROW][C]Multiple R[/C][C]0.881461940737189[/C][/ROW]
[ROW][C]R-squared[/C][C]0.776975152968171[/C][/ROW]
[ROW][C]Adjusted R-squared[/C][C]0.733046016431599[/C][/ROW]
[ROW][C]F-TEST (value)[/C][C]17.6870117244694[/C][/ROW]
[ROW][C]F-TEST (DF numerator)[/C][C]13[/C][/ROW]
[ROW][C]F-TEST (DF denominator)[/C][C]66[/C][/ROW]
[ROW][C]p-value[/C][C]1.11022302462516e-16[/C][/ROW]
[ROW][C]Multiple Linear Regression - Residual Statistics[/C][/ROW]
[ROW][C]Residual Standard Deviation[/C][C]6.57178533306779[/C][/ROW]
[ROW][C]Sum Squared Residuals[/C][C]2850.43192261904[/C][/ROW]
[/TABLE]
Source: https://freestatistics.org/blog/index.php?pk=25444&T=3

Globally Unique Identifier (entire table): ba.freestatistics.org/blog/index.php?pk=25444&T=3

As an alternative you can also use a QR Code:  

The GUIDs for individual cells are displayed in the table below:

Multiple Linear Regression - Regression Statistics
Multiple R0.881461940737189
R-squared0.776975152968171
Adjusted R-squared0.733046016431599
F-TEST (value)17.6870117244694
F-TEST (DF numerator)13
F-TEST (DF denominator)66
p-value1.11022302462516e-16
Multiple Linear Regression - Residual Statistics
Residual Standard Deviation6.57178533306779
Sum Squared Residuals2850.43192261904


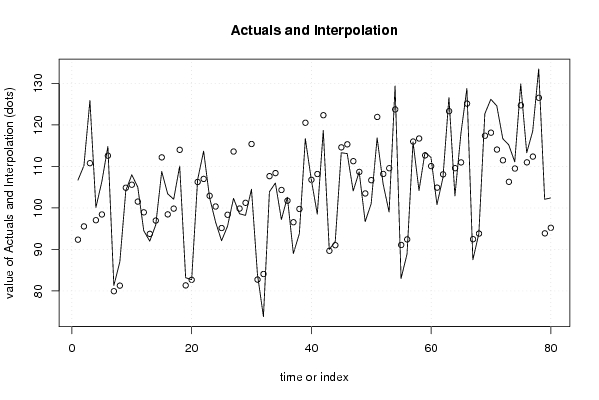
Multiple Linear Regression - Actuals, Interpolation, and Residuals
Time or IndexActualsInterpolationForecastResidualsPrediction Error
1106.792.352857142857314.3471428571427
2110.295.552857142857114.6471428571429
3125.9110.79017857142915.1098214285714
4100.197.04732142857143.05267857142857
5106.498.43303571428577.96696428571428
6114.8112.6044642857142.19553571428571
781.379.93303571428571.36696428571429
88781.27589285714295.72410714285714
9104.2104.862321428571-0.662321428571411
10108105.5956547619052.40434523809524
11105101.5289880952383.47101190476191
1294.598.9456547619048-4.44565476190476
139293.7535119047619-1.75351190476188
1495.996.9535119047619-1.05351190476189
15108.8112.190833333333-3.39083333333333
16103.498.44797619047624.95202380952382
17102.199.83369047619052.26630952380952
18110.1114.005119047619-3.90511904761905
1983.281.33369047619051.86630952380953
2082.782.67654761904760.0234523809523847
21106.8106.2629761904760.537023809523803
22113.7106.9963095238106.70369047619048
23102.5102.929642857143-0.429642857142855
2496.6100.346309523810-3.74630952380953
2592.195.1541666666666-3.05416666666665
2695.698.3541666666667-2.75416666666667
27102.3113.591488095238-11.2914880952381
2898.699.848630952381-1.24863095238096
2998.2101.234345238095-3.03434523809523
30104.5115.405773809524-10.9057738095238
318482.73434523809521.26565476190476
3273.884.0772023809524-10.2772023809524
33103.9107.663630952381-3.76363095238095
34106108.396964285714-2.39696428571429
3597.2104.330297619048-7.13029761904762
36102.6101.7469642857140.853035714285705
378996.5548214285714-7.55482142857141
3893.899.7548214285714-5.95482142857143
39116.7120.530892857143-3.83089285714285
40106.8106.7880357142860.0119642857142872
4198.5108.17375-9.67375
42118.7122.345178571429-3.64517857142857
439089.673750.326250000000006
4491.991.01660714285710.883392857142866
45113.3114.603035714286-1.30303571428572
46113.1115.336369047619-2.23636904761905
47104.1111.269702380952-7.16970238095238
48108.7108.6863690476190.0136309523809534
4996.7103.494226190476-6.79422619047616
50101106.694226190476-5.69422619047619
51116.9121.931547619048-5.03154761904762
52105.8108.188690476190-2.38869047619048
5399109.574404761905-10.5744047619048
54129.4123.7458333333335.65416666666667
558391.0744047619048-8.07440476190476
5688.992.4172619047619-3.5172619047619
57115.9116.003690476190-0.103690476190477
58104.2116.737023809524-12.5370238095238
59113.4112.6703571428570.729642857142862
60112.2110.0870238095242.11297619047619
61100.8104.894880952381-4.09488095238094
62107.3108.094880952381-0.794880952380958
63126.6123.3322023809523.26779761904761
64102.9109.589345238095-6.68934523809524
65117.9110.9750595238106.92494047619048
66128.8125.1464880952383.65351190476191
6787.592.4750595238095-4.97505952380952
6893.893.8179166666667-0.0179166666666755
69122.7117.4043452380955.29565476190476
70126.2118.1376785714298.06232142857143
71124.6114.07101190476210.5289880952381
72116.7111.4876785714295.21232142857143
73115.2106.2955357142868.90446428571431
74111.1109.4955357142861.60446428571427
75129.9124.7328571428575.16714285714286
76113.3110.992.30999999999999
77118.5112.3757142857146.12428571428571
78133.5126.5471428571436.95285714285714
79102.193.87571428571438.2242857142857
80102.495.21857142857147.18142857142857

\begin{tabular}{lllllllll}
\hline
Multiple Linear Regression - Actuals, Interpolation, and Residuals \tabularnewline
Time or Index & Actuals & InterpolationForecast & ResidualsPrediction Error \tabularnewline
1 & 106.7 & 92.3528571428573 & 14.3471428571427 \tabularnewline
2 & 110.2 & 95.5528571428571 & 14.6471428571429 \tabularnewline
3 & 125.9 & 110.790178571429 & 15.1098214285714 \tabularnewline
4 & 100.1 & 97.0473214285714 & 3.05267857142857 \tabularnewline
5 & 106.4 & 98.4330357142857 & 7.96696428571428 \tabularnewline
6 & 114.8 & 112.604464285714 & 2.19553571428571 \tabularnewline
7 & 81.3 & 79.9330357142857 & 1.36696428571429 \tabularnewline
8 & 87 & 81.2758928571429 & 5.72410714285714 \tabularnewline
9 & 104.2 & 104.862321428571 & -0.662321428571411 \tabularnewline
10 & 108 & 105.595654761905 & 2.40434523809524 \tabularnewline
11 & 105 & 101.528988095238 & 3.47101190476191 \tabularnewline
12 & 94.5 & 98.9456547619048 & -4.44565476190476 \tabularnewline
13 & 92 & 93.7535119047619 & -1.75351190476188 \tabularnewline
14 & 95.9 & 96.9535119047619 & -1.05351190476189 \tabularnewline
15 & 108.8 & 112.190833333333 & -3.39083333333333 \tabularnewline
16 & 103.4 & 98.4479761904762 & 4.95202380952382 \tabularnewline
17 & 102.1 & 99.8336904761905 & 2.26630952380952 \tabularnewline
18 & 110.1 & 114.005119047619 & -3.90511904761905 \tabularnewline
19 & 83.2 & 81.3336904761905 & 1.86630952380953 \tabularnewline
20 & 82.7 & 82.6765476190476 & 0.0234523809523847 \tabularnewline
21 & 106.8 & 106.262976190476 & 0.537023809523803 \tabularnewline
22 & 113.7 & 106.996309523810 & 6.70369047619048 \tabularnewline
23 & 102.5 & 102.929642857143 & -0.429642857142855 \tabularnewline
24 & 96.6 & 100.346309523810 & -3.74630952380953 \tabularnewline
25 & 92.1 & 95.1541666666666 & -3.05416666666665 \tabularnewline
26 & 95.6 & 98.3541666666667 & -2.75416666666667 \tabularnewline
27 & 102.3 & 113.591488095238 & -11.2914880952381 \tabularnewline
28 & 98.6 & 99.848630952381 & -1.24863095238096 \tabularnewline
29 & 98.2 & 101.234345238095 & -3.03434523809523 \tabularnewline
30 & 104.5 & 115.405773809524 & -10.9057738095238 \tabularnewline
31 & 84 & 82.7343452380952 & 1.26565476190476 \tabularnewline
32 & 73.8 & 84.0772023809524 & -10.2772023809524 \tabularnewline
33 & 103.9 & 107.663630952381 & -3.76363095238095 \tabularnewline
34 & 106 & 108.396964285714 & -2.39696428571429 \tabularnewline
35 & 97.2 & 104.330297619048 & -7.13029761904762 \tabularnewline
36 & 102.6 & 101.746964285714 & 0.853035714285705 \tabularnewline
37 & 89 & 96.5548214285714 & -7.55482142857141 \tabularnewline
38 & 93.8 & 99.7548214285714 & -5.95482142857143 \tabularnewline
39 & 116.7 & 120.530892857143 & -3.83089285714285 \tabularnewline
40 & 106.8 & 106.788035714286 & 0.0119642857142872 \tabularnewline
41 & 98.5 & 108.17375 & -9.67375 \tabularnewline
42 & 118.7 & 122.345178571429 & -3.64517857142857 \tabularnewline
43 & 90 & 89.67375 & 0.326250000000006 \tabularnewline
44 & 91.9 & 91.0166071428571 & 0.883392857142866 \tabularnewline
45 & 113.3 & 114.603035714286 & -1.30303571428572 \tabularnewline
46 & 113.1 & 115.336369047619 & -2.23636904761905 \tabularnewline
47 & 104.1 & 111.269702380952 & -7.16970238095238 \tabularnewline
48 & 108.7 & 108.686369047619 & 0.0136309523809534 \tabularnewline
49 & 96.7 & 103.494226190476 & -6.79422619047616 \tabularnewline
50 & 101 & 106.694226190476 & -5.69422619047619 \tabularnewline
51 & 116.9 & 121.931547619048 & -5.03154761904762 \tabularnewline
52 & 105.8 & 108.188690476190 & -2.38869047619048 \tabularnewline
53 & 99 & 109.574404761905 & -10.5744047619048 \tabularnewline
54 & 129.4 & 123.745833333333 & 5.65416666666667 \tabularnewline
55 & 83 & 91.0744047619048 & -8.07440476190476 \tabularnewline
56 & 88.9 & 92.4172619047619 & -3.5172619047619 \tabularnewline
57 & 115.9 & 116.003690476190 & -0.103690476190477 \tabularnewline
58 & 104.2 & 116.737023809524 & -12.5370238095238 \tabularnewline
59 & 113.4 & 112.670357142857 & 0.729642857142862 \tabularnewline
60 & 112.2 & 110.087023809524 & 2.11297619047619 \tabularnewline
61 & 100.8 & 104.894880952381 & -4.09488095238094 \tabularnewline
62 & 107.3 & 108.094880952381 & -0.794880952380958 \tabularnewline
63 & 126.6 & 123.332202380952 & 3.26779761904761 \tabularnewline
64 & 102.9 & 109.589345238095 & -6.68934523809524 \tabularnewline
65 & 117.9 & 110.975059523810 & 6.92494047619048 \tabularnewline
66 & 128.8 & 125.146488095238 & 3.65351190476191 \tabularnewline
67 & 87.5 & 92.4750595238095 & -4.97505952380952 \tabularnewline
68 & 93.8 & 93.8179166666667 & -0.0179166666666755 \tabularnewline
69 & 122.7 & 117.404345238095 & 5.29565476190476 \tabularnewline
70 & 126.2 & 118.137678571429 & 8.06232142857143 \tabularnewline
71 & 124.6 & 114.071011904762 & 10.5289880952381 \tabularnewline
72 & 116.7 & 111.487678571429 & 5.21232142857143 \tabularnewline
73 & 115.2 & 106.295535714286 & 8.90446428571431 \tabularnewline
74 & 111.1 & 109.495535714286 & 1.60446428571427 \tabularnewline
75 & 129.9 & 124.732857142857 & 5.16714285714286 \tabularnewline
76 & 113.3 & 110.99 & 2.30999999999999 \tabularnewline
77 & 118.5 & 112.375714285714 & 6.12428571428571 \tabularnewline
78 & 133.5 & 126.547142857143 & 6.95285714285714 \tabularnewline
79 & 102.1 & 93.8757142857143 & 8.2242857142857 \tabularnewline
80 & 102.4 & 95.2185714285714 & 7.18142857142857 \tabularnewline
\hline
\end{tabular}
%Source: https://freestatistics.org/blog/index.php?pk=25444&T=4

[TABLE]
[ROW][C]Multiple Linear Regression - Actuals, Interpolation, and Residuals[/C][/ROW]
[ROW][C]Time or Index[/C][C]Actuals[/C][C]InterpolationForecast[/C][C]ResidualsPrediction Error[/C][/ROW]
[ROW][C]1[/C][C]106.7[/C][C]92.3528571428573[/C][C]14.3471428571427[/C][/ROW]
[ROW][C]2[/C][C]110.2[/C][C]95.5528571428571[/C][C]14.6471428571429[/C][/ROW]
[ROW][C]3[/C][C]125.9[/C][C]110.790178571429[/C][C]15.1098214285714[/C][/ROW]
[ROW][C]4[/C][C]100.1[/C][C]97.0473214285714[/C][C]3.05267857142857[/C][/ROW]
[ROW][C]5[/C][C]106.4[/C][C]98.4330357142857[/C][C]7.96696428571428[/C][/ROW]
[ROW][C]6[/C][C]114.8[/C][C]112.604464285714[/C][C]2.19553571428571[/C][/ROW]
[ROW][C]7[/C][C]81.3[/C][C]79.9330357142857[/C][C]1.36696428571429[/C][/ROW]
[ROW][C]8[/C][C]87[/C][C]81.2758928571429[/C][C]5.72410714285714[/C][/ROW]
[ROW][C]9[/C][C]104.2[/C][C]104.862321428571[/C][C]-0.662321428571411[/C][/ROW]
[ROW][C]10[/C][C]108[/C][C]105.595654761905[/C][C]2.40434523809524[/C][/ROW]
[ROW][C]11[/C][C]105[/C][C]101.528988095238[/C][C]3.47101190476191[/C][/ROW]
[ROW][C]12[/C][C]94.5[/C][C]98.9456547619048[/C][C]-4.44565476190476[/C][/ROW]
[ROW][C]13[/C][C]92[/C][C]93.7535119047619[/C][C]-1.75351190476188[/C][/ROW]
[ROW][C]14[/C][C]95.9[/C][C]96.9535119047619[/C][C]-1.05351190476189[/C][/ROW]
[ROW][C]15[/C][C]108.8[/C][C]112.190833333333[/C][C]-3.39083333333333[/C][/ROW]
[ROW][C]16[/C][C]103.4[/C][C]98.4479761904762[/C][C]4.95202380952382[/C][/ROW]
[ROW][C]17[/C][C]102.1[/C][C]99.8336904761905[/C][C]2.26630952380952[/C][/ROW]
[ROW][C]18[/C][C]110.1[/C][C]114.005119047619[/C][C]-3.90511904761905[/C][/ROW]
[ROW][C]19[/C][C]83.2[/C][C]81.3336904761905[/C][C]1.86630952380953[/C][/ROW]
[ROW][C]20[/C][C]82.7[/C][C]82.6765476190476[/C][C]0.0234523809523847[/C][/ROW]
[ROW][C]21[/C][C]106.8[/C][C]106.262976190476[/C][C]0.537023809523803[/C][/ROW]
[ROW][C]22[/C][C]113.7[/C][C]106.996309523810[/C][C]6.70369047619048[/C][/ROW]
[ROW][C]23[/C][C]102.5[/C][C]102.929642857143[/C][C]-0.429642857142855[/C][/ROW]
[ROW][C]24[/C][C]96.6[/C][C]100.346309523810[/C][C]-3.74630952380953[/C][/ROW]
[ROW][C]25[/C][C]92.1[/C][C]95.1541666666666[/C][C]-3.05416666666665[/C][/ROW]
[ROW][C]26[/C][C]95.6[/C][C]98.3541666666667[/C][C]-2.75416666666667[/C][/ROW]
[ROW][C]27[/C][C]102.3[/C][C]113.591488095238[/C][C]-11.2914880952381[/C][/ROW]
[ROW][C]28[/C][C]98.6[/C][C]99.848630952381[/C][C]-1.24863095238096[/C][/ROW]
[ROW][C]29[/C][C]98.2[/C][C]101.234345238095[/C][C]-3.03434523809523[/C][/ROW]
[ROW][C]30[/C][C]104.5[/C][C]115.405773809524[/C][C]-10.9057738095238[/C][/ROW]
[ROW][C]31[/C][C]84[/C][C]82.7343452380952[/C][C]1.26565476190476[/C][/ROW]
[ROW][C]32[/C][C]73.8[/C][C]84.0772023809524[/C][C]-10.2772023809524[/C][/ROW]
[ROW][C]33[/C][C]103.9[/C][C]107.663630952381[/C][C]-3.76363095238095[/C][/ROW]
[ROW][C]34[/C][C]106[/C][C]108.396964285714[/C][C]-2.39696428571429[/C][/ROW]
[ROW][C]35[/C][C]97.2[/C][C]104.330297619048[/C][C]-7.13029761904762[/C][/ROW]
[ROW][C]36[/C][C]102.6[/C][C]101.746964285714[/C][C]0.853035714285705[/C][/ROW]
[ROW][C]37[/C][C]89[/C][C]96.5548214285714[/C][C]-7.55482142857141[/C][/ROW]
[ROW][C]38[/C][C]93.8[/C][C]99.7548214285714[/C][C]-5.95482142857143[/C][/ROW]
[ROW][C]39[/C][C]116.7[/C][C]120.530892857143[/C][C]-3.83089285714285[/C][/ROW]
[ROW][C]40[/C][C]106.8[/C][C]106.788035714286[/C][C]0.0119642857142872[/C][/ROW]
[ROW][C]41[/C][C]98.5[/C][C]108.17375[/C][C]-9.67375[/C][/ROW]
[ROW][C]42[/C][C]118.7[/C][C]122.345178571429[/C][C]-3.64517857142857[/C][/ROW]
[ROW][C]43[/C][C]90[/C][C]89.67375[/C][C]0.326250000000006[/C][/ROW]
[ROW][C]44[/C][C]91.9[/C][C]91.0166071428571[/C][C]0.883392857142866[/C][/ROW]
[ROW][C]45[/C][C]113.3[/C][C]114.603035714286[/C][C]-1.30303571428572[/C][/ROW]
[ROW][C]46[/C][C]113.1[/C][C]115.336369047619[/C][C]-2.23636904761905[/C][/ROW]
[ROW][C]47[/C][C]104.1[/C][C]111.269702380952[/C][C]-7.16970238095238[/C][/ROW]
[ROW][C]48[/C][C]108.7[/C][C]108.686369047619[/C][C]0.0136309523809534[/C][/ROW]
[ROW][C]49[/C][C]96.7[/C][C]103.494226190476[/C][C]-6.79422619047616[/C][/ROW]
[ROW][C]50[/C][C]101[/C][C]106.694226190476[/C][C]-5.69422619047619[/C][/ROW]
[ROW][C]51[/C][C]116.9[/C][C]121.931547619048[/C][C]-5.03154761904762[/C][/ROW]
[ROW][C]52[/C][C]105.8[/C][C]108.188690476190[/C][C]-2.38869047619048[/C][/ROW]
[ROW][C]53[/C][C]99[/C][C]109.574404761905[/C][C]-10.5744047619048[/C][/ROW]
[ROW][C]54[/C][C]129.4[/C][C]123.745833333333[/C][C]5.65416666666667[/C][/ROW]
[ROW][C]55[/C][C]83[/C][C]91.0744047619048[/C][C]-8.07440476190476[/C][/ROW]
[ROW][C]56[/C][C]88.9[/C][C]92.4172619047619[/C][C]-3.5172619047619[/C][/ROW]
[ROW][C]57[/C][C]115.9[/C][C]116.003690476190[/C][C]-0.103690476190477[/C][/ROW]
[ROW][C]58[/C][C]104.2[/C][C]116.737023809524[/C][C]-12.5370238095238[/C][/ROW]
[ROW][C]59[/C][C]113.4[/C][C]112.670357142857[/C][C]0.729642857142862[/C][/ROW]
[ROW][C]60[/C][C]112.2[/C][C]110.087023809524[/C][C]2.11297619047619[/C][/ROW]
[ROW][C]61[/C][C]100.8[/C][C]104.894880952381[/C][C]-4.09488095238094[/C][/ROW]
[ROW][C]62[/C][C]107.3[/C][C]108.094880952381[/C][C]-0.794880952380958[/C][/ROW]
[ROW][C]63[/C][C]126.6[/C][C]123.332202380952[/C][C]3.26779761904761[/C][/ROW]
[ROW][C]64[/C][C]102.9[/C][C]109.589345238095[/C][C]-6.68934523809524[/C][/ROW]
[ROW][C]65[/C][C]117.9[/C][C]110.975059523810[/C][C]6.92494047619048[/C][/ROW]
[ROW][C]66[/C][C]128.8[/C][C]125.146488095238[/C][C]3.65351190476191[/C][/ROW]
[ROW][C]67[/C][C]87.5[/C][C]92.4750595238095[/C][C]-4.97505952380952[/C][/ROW]
[ROW][C]68[/C][C]93.8[/C][C]93.8179166666667[/C][C]-0.0179166666666755[/C][/ROW]
[ROW][C]69[/C][C]122.7[/C][C]117.404345238095[/C][C]5.29565476190476[/C][/ROW]
[ROW][C]70[/C][C]126.2[/C][C]118.137678571429[/C][C]8.06232142857143[/C][/ROW]
[ROW][C]71[/C][C]124.6[/C][C]114.071011904762[/C][C]10.5289880952381[/C][/ROW]
[ROW][C]72[/C][C]116.7[/C][C]111.487678571429[/C][C]5.21232142857143[/C][/ROW]
[ROW][C]73[/C][C]115.2[/C][C]106.295535714286[/C][C]8.90446428571431[/C][/ROW]
[ROW][C]74[/C][C]111.1[/C][C]109.495535714286[/C][C]1.60446428571427[/C][/ROW]
[ROW][C]75[/C][C]129.9[/C][C]124.732857142857[/C][C]5.16714285714286[/C][/ROW]
[ROW][C]76[/C][C]113.3[/C][C]110.99[/C][C]2.30999999999999[/C][/ROW]
[ROW][C]77[/C][C]118.5[/C][C]112.375714285714[/C][C]6.12428571428571[/C][/ROW]
[ROW][C]78[/C][C]133.5[/C][C]126.547142857143[/C][C]6.95285714285714[/C][/ROW]
[ROW][C]79[/C][C]102.1[/C][C]93.8757142857143[/C][C]8.2242857142857[/C][/ROW]
[ROW][C]80[/C][C]102.4[/C][C]95.2185714285714[/C][C]7.18142857142857[/C][/ROW]
[/TABLE]
Source: https://freestatistics.org/blog/index.php?pk=25444&T=4

Globally Unique Identifier (entire table): ba.freestatistics.org/blog/index.php?pk=25444&T=4

As an alternative you can also use a QR Code:  

The GUIDs for individual cells are displayed in the table below:

Multiple Linear Regression - Actuals, Interpolation, and Residuals
Time or IndexActualsInterpolationForecastResidualsPrediction Error
1106.792.352857142857314.3471428571427
2110.295.552857142857114.6471428571429
3125.9110.79017857142915.1098214285714
4100.197.04732142857143.05267857142857
5106.498.43303571428577.96696428571428
6114.8112.6044642857142.19553571428571
781.379.93303571428571.36696428571429
88781.27589285714295.72410714285714
9104.2104.862321428571-0.662321428571411
10108105.5956547619052.40434523809524
11105101.5289880952383.47101190476191
1294.598.9456547619048-4.44565476190476
139293.7535119047619-1.75351190476188
1495.996.9535119047619-1.05351190476189
15108.8112.190833333333-3.39083333333333
16103.498.44797619047624.95202380952382
17102.199.83369047619052.26630952380952
18110.1114.005119047619-3.90511904761905
1983.281.33369047619051.86630952380953
2082.782.67654761904760.0234523809523847
21106.8106.2629761904760.537023809523803
22113.7106.9963095238106.70369047619048
23102.5102.929642857143-0.429642857142855
2496.6100.346309523810-3.74630952380953
2592.195.1541666666666-3.05416666666665
2695.698.3541666666667-2.75416666666667
27102.3113.591488095238-11.2914880952381
2898.699.848630952381-1.24863095238096
2998.2101.234345238095-3.03434523809523
30104.5115.405773809524-10.9057738095238
318482.73434523809521.26565476190476
3273.884.0772023809524-10.2772023809524
33103.9107.663630952381-3.76363095238095
34106108.396964285714-2.39696428571429
3597.2104.330297619048-7.13029761904762
36102.6101.7469642857140.853035714285705
378996.5548214285714-7.55482142857141
3893.899.7548214285714-5.95482142857143
39116.7120.530892857143-3.83089285714285
40106.8106.7880357142860.0119642857142872
4198.5108.17375-9.67375
42118.7122.345178571429-3.64517857142857
439089.673750.326250000000006
4491.991.01660714285710.883392857142866
45113.3114.603035714286-1.30303571428572
46113.1115.336369047619-2.23636904761905
47104.1111.269702380952-7.16970238095238
48108.7108.6863690476190.0136309523809534
4996.7103.494226190476-6.79422619047616
50101106.694226190476-5.69422619047619
51116.9121.931547619048-5.03154761904762
52105.8108.188690476190-2.38869047619048
5399109.574404761905-10.5744047619048
54129.4123.7458333333335.65416666666667
558391.0744047619048-8.07440476190476
5688.992.4172619047619-3.5172619047619
57115.9116.003690476190-0.103690476190477
58104.2116.737023809524-12.5370238095238
59113.4112.6703571428570.729642857142862
60112.2110.0870238095242.11297619047619
61100.8104.894880952381-4.09488095238094
62107.3108.094880952381-0.794880952380958
63126.6123.3322023809523.26779761904761
64102.9109.589345238095-6.68934523809524
65117.9110.9750595238106.92494047619048
66128.8125.1464880952383.65351190476191
6787.592.4750595238095-4.97505952380952
6893.893.8179166666667-0.0179166666666755
69122.7117.4043452380955.29565476190476
70126.2118.1376785714298.06232142857143
71124.6114.07101190476210.5289880952381
72116.7111.4876785714295.21232142857143
73115.2106.2955357142868.90446428571431
74111.1109.4955357142861.60446428571427
75129.9124.7328571428575.16714285714286
76113.3110.992.30999999999999
77118.5112.3757142857146.12428571428571
78133.5126.5471428571436.95285714285714
79102.193.87571428571438.2242857142857
80102.495.21857142857147.18142857142857


Parameters (Session):
par1 = 1 ; par2 = Include Monthly Dummies ; par3 = Linear Trend ;
Parameters (R input):
par1 = 1 ; par2 = Include Monthly Dummies ; par3 = Linear Trend ; par4 = ; par5 = ; par6 = ; par7 = ; par8 = ; par9 = ; par10 = ; par11 = ; par12 = ; par13 = ; par14 = ; par15 = ; par16 = ; par17 = ; par18 = ; par19 = ; par20 = ;
R code (references can be found in the software module):
library(lattice)
par1 <- as.numeric(par1)
x <- t(y)
k <- length(x[1,])
n <- length(x[,1])
x1 <- cbind(x[,par1], x[,1:k!=par1])
mycolnames <- c(colnames(x)[par1], colnames(x)[1:k!=par1])
colnames(x1) <- mycolnames #colnames(x)[par1]
x <- x1
if (par3 == 'First Differences'){
x2 <- array(0, dim=c(n-1,k), dimnames=list(1:(n-1), paste('(1-B)',colnames(x),sep='')))
for (i in 1:n-1) {
for (j in 1:k) {
x2[i,j] <- x[i+1,j] - x[i,j]
}
}
x <- x2
}
if (par2 == 'Include Monthly Dummies'){
x2 <- array(0, dim=c(n,11), dimnames=list(1:n, paste('M', seq(1:11), sep ='')))
for (i in 1:11){
x2[seq(i,n,12),i] <- 1
}
x <- cbind(x, x2)
}
if (par2 == 'Include Quarterly Dummies'){
x2 <- array(0, dim=c(n,3), dimnames=list(1:n, paste('Q', seq(1:3), sep ='')))
for (i in 1:3){
x2[seq(i,n,4),i] <- 1
}
x <- cbind(x, x2)
}
k <- length(x[1,])
if (par3 == 'Linear Trend'){
x <- cbind(x, c(1:n))
colnames(x)[k+1] <- 't'
}
x
k <- length(x[1,])
df <- as.data.frame(x)
(mylm <- lm(df))
(mysum <- summary(mylm))
bitmap(file='test0.png')
plot(x[,1], type='l', main='Actuals and Interpolation', ylab='value of Actuals and Interpolation (dots)', xlab='time or index')
points(x[,1]-mysum$resid)
grid()
dev.off()
bitmap(file='test1.png')
plot(mysum$resid, type='b', pch=19, main='Residuals', ylab='value of Residuals', xlab='time or index')
grid()
dev.off()
bitmap(file='test2.png')
hist(mysum$resid, main='Residual Histogram', xlab='values of Residuals')
grid()
dev.off()
bitmap(file='test3.png')
densityplot(~mysum$resid,col='black',main='Residual Density Plot', xlab='values of Residuals')
dev.off()
bitmap(file='test4.png')
qqnorm(mysum$resid, main='Residual Normal Q-Q Plot')
grid()
dev.off()
(myerror <- as.ts(mysum$resid))
bitmap(file='test5.png')
dum <- cbind(lag(myerror,k=1),myerror)
dum
dum1 <- dum[2:length(myerror),]
dum1
z <- as.data.frame(dum1)
z
plot(z,main=paste('Residual Lag plot, lowess, and regression line'), ylab='values of Residuals', xlab='lagged values of Residuals')
lines(lowess(z))
abline(lm(z))
grid()
dev.off()
bitmap(file='test6.png')
acf(mysum$resid, lag.max=length(mysum$resid)/2, main='Residual Autocorrelation Function')
grid()
dev.off()
bitmap(file='test7.png')
pacf(mysum$resid, lag.max=length(mysum$resid)/2, main='Residual Partial Autocorrelation Function')
grid()
dev.off()
bitmap(file='test8.png')
opar <- par(mfrow = c(2,2), oma = c(0, 0, 1.1, 0))
plot(mylm, las = 1, sub='Residual Diagnostics')
par(opar)
dev.off()
load(file='createtable')
a<-table.start()
a<-table.row.start(a)
a<-table.element(a, 'Multiple Linear Regression - Estimated Regression Equation', 1, TRUE)
a<-table.row.end(a)
myeq <- colnames(x)[1]
myeq <- paste(myeq, '[t] = ', sep='')
for (i in 1:k){
if (mysum$coefficients[i,1] > 0) myeq <- paste(myeq, '+', '')
myeq <- paste(myeq, mysum$coefficients[i,1], sep=' ')
if (rownames(mysum$coefficients)[i] != '(Intercept)') {
myeq <- paste(myeq, rownames(mysum$coefficients)[i], sep='')
if (rownames(mysum$coefficients)[i] != 't') myeq <- paste(myeq, '[t]', sep='')
}
}
myeq <- paste(myeq, ' + e[t]')
a<-table.row.start(a)
a<-table.element(a, myeq)
a<-table.row.end(a)
a<-table.end(a)
table.save(a,file='mytable1.tab')
a<-table.start()
a<-table.row.start(a)
a<-table.element(a,hyperlink('ols1.htm','Multiple Linear Regression - Ordinary Least Squares',''), 6, TRUE)
a<-table.row.end(a)
a<-table.row.start(a)
a<-table.element(a,'Variable',header=TRUE)
a<-table.element(a,'Parameter',header=TRUE)
a<-table.element(a,'S.D.',header=TRUE)
a<-table.element(a,'T-STAT
H0: parameter = 0',header=TRUE)
a<-table.element(a,'2-tail p-value',header=TRUE)
a<-table.element(a,'1-tail p-value',header=TRUE)
a<-table.row.end(a)
for (i in 1:k){
a<-table.row.start(a)
a<-table.element(a,rownames(mysum$coefficients)[i],header=TRUE)
a<-table.element(a,mysum$coefficients[i,1])
a<-table.element(a, round(mysum$coefficients[i,2],6))
a<-table.element(a, round(mysum$coefficients[i,3],4))
a<-table.element(a, round(mysum$coefficients[i,4],6))
a<-table.element(a, round(mysum$coefficients[i,4]/2,6))
a<-table.row.end(a)
}
a<-table.end(a)
table.save(a,file='mytable2.tab')
a<-table.start()
a<-table.row.start(a)
a<-table.element(a, 'Multiple Linear Regression - Regression Statistics', 2, TRUE)
a<-table.row.end(a)
a<-table.row.start(a)
a<-table.element(a, 'Multiple R',1,TRUE)
a<-table.element(a, sqrt(mysum$r.squared))
a<-table.row.end(a)
a<-table.row.start(a)
a<-table.element(a, 'R-squared',1,TRUE)
a<-table.element(a, mysum$r.squared)
a<-table.row.end(a)
a<-table.row.start(a)
a<-table.element(a, 'Adjusted R-squared',1,TRUE)
a<-table.element(a, mysum$adj.r.squared)
a<-table.row.end(a)
a<-table.row.start(a)
a<-table.element(a, 'F-TEST (value)',1,TRUE)
a<-table.element(a, mysum$fstatistic[1])
a<-table.row.end(a)
a<-table.row.start(a)
a<-table.element(a, 'F-TEST (DF numerator)',1,TRUE)
a<-table.element(a, mysum$fstatistic[2])
a<-table.row.end(a)
a<-table.row.start(a)
a<-table.element(a, 'F-TEST (DF denominator)',1,TRUE)
a<-table.element(a, mysum$fstatistic[3])
a<-table.row.end(a)
a<-table.row.start(a)
a<-table.element(a, 'p-value',1,TRUE)
a<-table.element(a, 1-pf(mysum$fstatistic[1],mysum$fstatistic[2],mysum$fstatistic[3]))
a<-table.row.end(a)
a<-table.row.start(a)
a<-table.element(a, 'Multiple Linear Regression - Residual Statistics', 2, TRUE)
a<-table.row.end(a)
a<-table.row.start(a)
a<-table.element(a, 'Residual Standard Deviation',1,TRUE)
a<-table.element(a, mysum$sigma)
a<-table.row.end(a)
a<-table.row.start(a)
a<-table.element(a, 'Sum Squared Residuals',1,TRUE)
a<-table.element(a, sum(myerror*myerror))
a<-table.row.end(a)
a<-table.end(a)
table.save(a,file='mytable3.tab')
a<-table.start()
a<-table.row.start(a)
a<-table.element(a, 'Multiple Linear Regression - Actuals, Interpolation, and Residuals', 4, TRUE)
a<-table.row.end(a)
a<-table.row.start(a)
a<-table.element(a, 'Time or Index', 1, TRUE)
a<-table.element(a, 'Actuals', 1, TRUE)
a<-table.element(a, 'Interpolation
Forecast', 1, TRUE)
a<-table.element(a, 'Residuals
Prediction Error', 1, TRUE)
a<-table.row.end(a)
for (i in 1:n) {
a<-table.row.start(a)
a<-table.element(a,i, 1, TRUE)
a<-table.element(a,x[i])
a<-table.element(a,x[i]-mysum$resid[i])
a<-table.element(a,mysum$resid[i])
a<-table.row.end(a)
}
a<-table.end(a)
table.save(a,file='mytable4.tab')