Free Statistics

of Irreproducible Research!

Author's title

Author*Unverified author*
R Software Modulerwasp_multipleregression.wasp
Title produced by softwareMultiple Regression
Date of computationMon, 24 Nov 2008 06:22:49 -0700
Cite this page as followsStatistical Computations at FreeStatistics.org, Office for Research Development and Education, URL https://freestatistics.org/blog/index.php?v=date/2008/Nov/24/t1227533035kp2e3xvzoc4nwag.htm/, Retrieved Tue, 14 May 2024 04:22:31 +0000
Statistical Computations at FreeStatistics.org, Office for Research Development and Education, URL https://freestatistics.org/blog/index.php?pk=25421, Retrieved Tue, 14 May 2024 04:22:31 +0000
QR Codes:

Original text written by user:
IsPrivate?No (this computation is public)
User-defined keywords
Estimated Impact151
Family? (F = Feedback message, R = changed R code, M = changed R Module, P = changed Parameters, D = changed Data)
F       [Multiple Regression] [seatbeltlawq3a] [2008-11-24 13:22:49] [80e37024345c6a903bf645806b7fbe14] [Current]
Feedback Forum
2008-11-29 09:46:04 [Katrijn Truyman] [reply
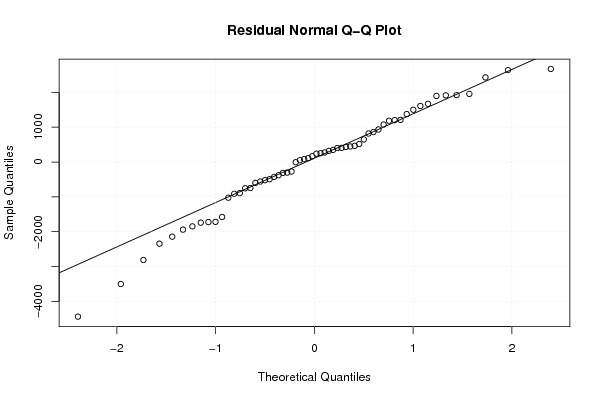
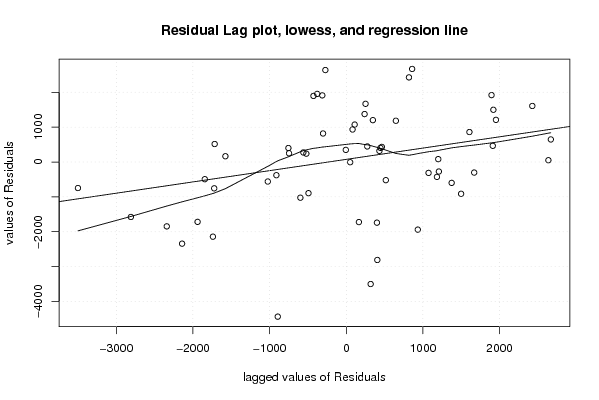
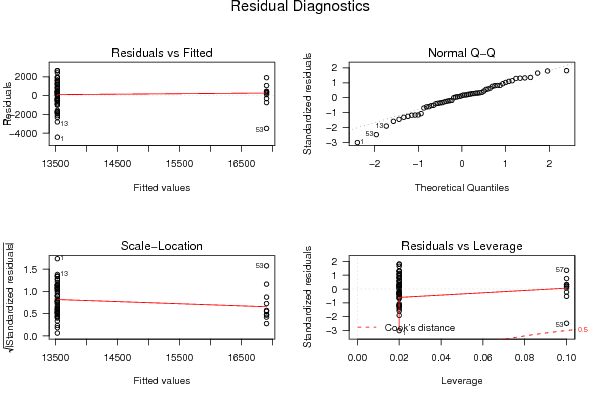
Er is een verkeerde berekening gemaakt, want er is geen seizoenaliteit opgenomen en geen lineaire trend, hierdoor geven de grafieken geen correct beeld...
2008-11-30 16:37:53 [Lana Van Wesemael] [reply
Q3: Hier is de student vergeten om maandelijkse dummies en een lineaire trens in te voegen. Waardoor de resultaten een vertekend beeld geven. Dit is eenvoudig aan te passen door de berekening te reproduceren en dan bij fixed seasonal effects include monthly dummies aan te klikken en bij type of equation linear trend te gebruiken.
2008-12-01 14:21:34 [58d427c57bd46519a715a3a7fea6a80f] [reply
De student heeft verkeerde grafieken want hij heeft geen seizoenaliteit opgenomen, daardoor geven zijn resultaten een vertekend beeld.
2008-12-01 17:41:43 [Stefan Temmerman] [reply
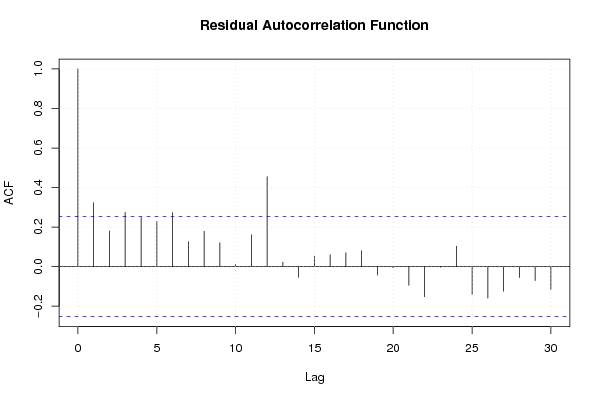
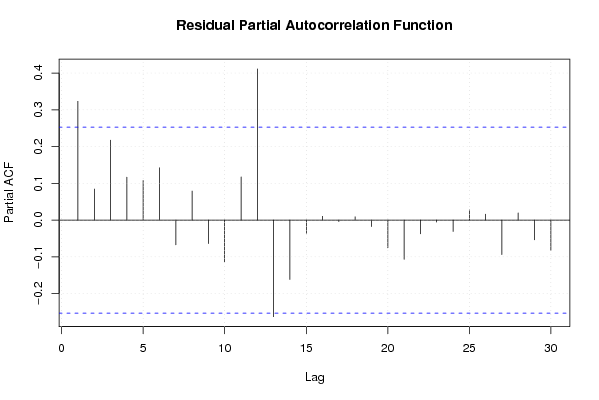
De student heeft geen seasonal dummies of lineaire trend gebruikt, wat bij export gegevens toch relevant is. Het berekende model is toch voor verbetering vatbaar, gezien de R² waarde, het gemiddelde dat niet constant is aan nul, en er is nog autocorrelatie aanwezig. Maar omdat de berekening vertekend is door de afwezigheid van seasonal dummies en een lineaire trend, kunnen we moeilijk een besluit nemen.
2008-12-01 19:06:03 [Peter Van Doninck] [reply
De student heeft hier geen multiple regression met seasonal dummy's en linear trend toegepast. Hierdoor kunnen we dus geen duidelijke conclusies trekken. De student dient de oorspronkelijke gegevens in te voeren, en seasonal dummys en linear trend aan te vinken.

Post a new message
Dataseries X:
9097	0
12639	0
13040	0
11687	0
11191	0
11391	0
11793	0
13933	0
12778	0
11810	0
13698	0
11956	0
10723	0
13938	0
13979	0
13807	0
12973	0
12509	0
12934	0
14908	0
13772	0
13012	0
14049	0
11816	0
11593	0
14466	0
13615	0
14733	0
13880	0
13527	0
13584	0
16170	0
13260	0
14741	0
15486	0
13154	0
12621	0
15031	0
15452	0
15428	0
13105	0
14716	0
14180	0
16202	0
14392	0
15140	0
15960	0
14351	0
13230	0
15202	0
17157	1
16159	1
13405	1
17224	1
17338	1
17370	1
18817	1
16593	1
17979	1
17015	1


Summary of computational transaction
Raw Inputview raw input (R code)
Raw Outputview raw output of R engine
Computing time4 seconds
R Server'Gwilym Jenkins' @ 72.249.127.135

\begin{tabular}{lllllllll}
\hline
Summary of computational transaction \tabularnewline
Raw Input & view raw input (R code)  \tabularnewline
Raw Output & view raw output of R engine  \tabularnewline
Computing time & 4 seconds \tabularnewline
R Server & 'Gwilym Jenkins' @ 72.249.127.135 \tabularnewline
\hline
\end{tabular}
%Source: https://freestatistics.org/blog/index.php?pk=25421&T=0

[TABLE]
[ROW][C]Summary of computational transaction[/C][/ROW]
[ROW][C]Raw Input[/C][C]view raw input (R code) [/C][/ROW]
[ROW][C]Raw Output[/C][C]view raw output of R engine [/C][/ROW]
[ROW][C]Computing time[/C][C]4 seconds[/C][/ROW]
[ROW][C]R Server[/C][C]'Gwilym Jenkins' @ 72.249.127.135[/C][/ROW]
[/TABLE]
Source: https://freestatistics.org/blog/index.php?pk=25421&T=0

Globally Unique Identifier (entire table): ba.freestatistics.org/blog/index.php?pk=25421&T=0

As an alternative you can also use a QR Code:  

The GUIDs for individual cells are displayed in the table below:

Summary of computational transaction
Raw Inputview raw input (R code)
Raw Outputview raw output of R engine
Computing time4 seconds
R Server'Gwilym Jenkins' @ 72.249.127.135


Multiple Linear Regression - Estimated Regression Equation
Uitvoer[t] = + 13533.04 + 3372.66x[t] + e[t]

\begin{tabular}{lllllllll}
\hline
Multiple Linear Regression - Estimated Regression Equation \tabularnewline
Uitvoer[t] =  +  13533.04 +  3372.66x[t]  + e[t] \tabularnewline
\hline
\end{tabular}
%Source: https://freestatistics.org/blog/index.php?pk=25421&T=1

[TABLE]
[ROW][C]Multiple Linear Regression - Estimated Regression Equation[/C][/ROW]
[ROW][C]Uitvoer[t] =  +  13533.04 +  3372.66x[t]  + e[t][/C][/ROW]
[/TABLE]
Source: https://freestatistics.org/blog/index.php?pk=25421&T=1

Globally Unique Identifier (entire table): ba.freestatistics.org/blog/index.php?pk=25421&T=1

As an alternative you can also use a QR Code:  

The GUIDs for individual cells are displayed in the table below:

Multiple Linear Regression - Estimated Regression Equation
Uitvoer[t] = + 13533.04 + 3372.66x[t] + e[t]


Multiple Linear Regression - Ordinary Least Squares
VariableParameterS.D.T-STATH0: parameter = 02-tail p-value1-tail p-value
(Intercept)13533.04210.17653864.388900
x3372.66514.8252756.551100

\begin{tabular}{lllllllll}
\hline
Multiple Linear Regression - Ordinary Least Squares \tabularnewline
Variable & Parameter & S.D. & T-STATH0: parameter = 0 & 2-tail p-value & 1-tail p-value \tabularnewline
(Intercept) & 13533.04 & 210.176538 & 64.3889 & 0 & 0 \tabularnewline
x & 3372.66 & 514.825275 & 6.5511 & 0 & 0 \tabularnewline
\hline
\end{tabular}
%Source: https://freestatistics.org/blog/index.php?pk=25421&T=2

[TABLE]
[ROW][C]Multiple Linear Regression - Ordinary Least Squares[/C][/ROW]
[ROW][C]Variable[/C][C]Parameter[/C][C]S.D.[/C][C]T-STATH0: parameter = 0[/C][C]2-tail p-value[/C][C]1-tail p-value[/C][/ROW]
[ROW][C](Intercept)[/C][C]13533.04[/C][C]210.176538[/C][C]64.3889[/C][C]0[/C][C]0[/C][/ROW]
[ROW][C]x[/C][C]3372.66[/C][C]514.825275[/C][C]6.5511[/C][C]0[/C][C]0[/C][/ROW]
[/TABLE]
Source: https://freestatistics.org/blog/index.php?pk=25421&T=2

Globally Unique Identifier (entire table): ba.freestatistics.org/blog/index.php?pk=25421&T=2

As an alternative you can also use a QR Code:  

The GUIDs for individual cells are displayed in the table below:

Multiple Linear Regression - Ordinary Least Squares
VariableParameterS.D.T-STATH0: parameter = 02-tail p-value1-tail p-value
(Intercept)13533.04210.17653864.388900
x3372.66514.8252756.551100


Multiple Linear Regression - Regression Statistics
Multiple R0.652125791064754
R-squared0.425268047371832
Adjusted R-squared0.415358875774794
F-TEST (value)42.9166094468459
F-TEST (DF numerator)1
F-TEST (DF denominator)58
p-value1.65659783668559e-08
Multiple Linear Regression - Residual Statistics
Residual Standard Deviation1486.17255472364
Sum Squared Residuals128105114.02

\begin{tabular}{lllllllll}
\hline
Multiple Linear Regression - Regression Statistics \tabularnewline
Multiple R & 0.652125791064754 \tabularnewline
R-squared & 0.425268047371832 \tabularnewline
Adjusted R-squared & 0.415358875774794 \tabularnewline
F-TEST (value) & 42.9166094468459 \tabularnewline
F-TEST (DF numerator) & 1 \tabularnewline
F-TEST (DF denominator) & 58 \tabularnewline
p-value & 1.65659783668559e-08 \tabularnewline
Multiple Linear Regression - Residual Statistics \tabularnewline
Residual Standard Deviation & 1486.17255472364 \tabularnewline
Sum Squared Residuals & 128105114.02 \tabularnewline
\hline
\end{tabular}
%Source: https://freestatistics.org/blog/index.php?pk=25421&T=3

[TABLE]
[ROW][C]Multiple Linear Regression - Regression Statistics[/C][/ROW]
[ROW][C]Multiple R[/C][C]0.652125791064754[/C][/ROW]
[ROW][C]R-squared[/C][C]0.425268047371832[/C][/ROW]
[ROW][C]Adjusted R-squared[/C][C]0.415358875774794[/C][/ROW]
[ROW][C]F-TEST (value)[/C][C]42.9166094468459[/C][/ROW]
[ROW][C]F-TEST (DF numerator)[/C][C]1[/C][/ROW]
[ROW][C]F-TEST (DF denominator)[/C][C]58[/C][/ROW]
[ROW][C]p-value[/C][C]1.65659783668559e-08[/C][/ROW]
[ROW][C]Multiple Linear Regression - Residual Statistics[/C][/ROW]
[ROW][C]Residual Standard Deviation[/C][C]1486.17255472364[/C][/ROW]
[ROW][C]Sum Squared Residuals[/C][C]128105114.02[/C][/ROW]
[/TABLE]
Source: https://freestatistics.org/blog/index.php?pk=25421&T=3

Globally Unique Identifier (entire table): ba.freestatistics.org/blog/index.php?pk=25421&T=3

As an alternative you can also use a QR Code:  

The GUIDs for individual cells are displayed in the table below:

Multiple Linear Regression - Regression Statistics
Multiple R0.652125791064754
R-squared0.425268047371832
Adjusted R-squared0.415358875774794
F-TEST (value)42.9166094468459
F-TEST (DF numerator)1
F-TEST (DF denominator)58
p-value1.65659783668559e-08
Multiple Linear Regression - Residual Statistics
Residual Standard Deviation1486.17255472364
Sum Squared Residuals128105114.02


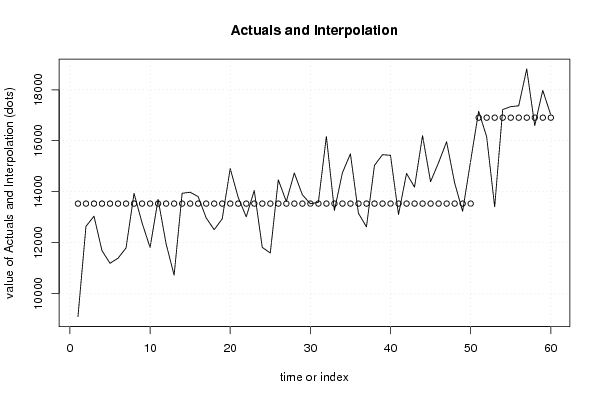
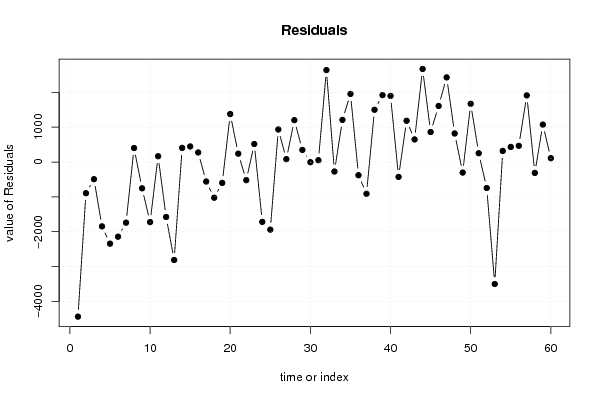
Multiple Linear Regression - Actuals, Interpolation, and Residuals
Time or IndexActualsInterpolationForecastResidualsPrediction Error
1909713533.04-4436.04
21263913533.04-894.039999999998
31304013533.04-493.04
41168713533.04-1846.04
51119113533.04-2342.04
61139113533.04-2142.04
71179313533.04-1740.04
81393313533.04399.96
91277813533.04-755.04
101181013533.04-1723.04
111369813533.04164.960000000000
121195613533.04-1577.04
131072313533.04-2810.04
141393813533.04404.96
151397913533.04445.96
161380713533.04273.96
171297313533.04-560.04
181250913533.04-1024.04
191293413533.04-599.04
201490813533.041374.96
211377213533.04238.960000000000
221301213533.04-521.04
231404913533.04515.96
241181613533.04-1717.04
251159313533.04-1940.04
261446613533.04932.96
271361513533.0481.9600000000003
281473313533.041199.96
291388013533.04346.96
301352713533.04-6.03999999999974
311358413533.0450.9600000000003
321617013533.042636.96
331326013533.04-273.04
341474113533.041207.96
351548613533.041952.96
361315413533.04-379.04
371262113533.04-912.04
381503113533.041497.96
391545213533.041918.96
401542813533.041894.96
411310513533.04-428.04
421471613533.041182.96
431418013533.04646.96
441620213533.042668.96
451439213533.04858.96
461514013533.041606.96
471596013533.042426.96
481435113533.04817.96
491323013533.04-303.04
501520213533.041668.96
511715716905.7251.3
521615916905.7-746.7
531340516905.7-3500.7
541722416905.7318.3
551733816905.7432.3
561737016905.7464.3
571881716905.71911.3
581659316905.7-312.7
591797916905.71073.3
601701516905.7109.3

\begin{tabular}{lllllllll}
\hline
Multiple Linear Regression - Actuals, Interpolation, and Residuals \tabularnewline
Time or Index & Actuals & InterpolationForecast & ResidualsPrediction Error \tabularnewline
1 & 9097 & 13533.04 & -4436.04 \tabularnewline
2 & 12639 & 13533.04 & -894.039999999998 \tabularnewline
3 & 13040 & 13533.04 & -493.04 \tabularnewline
4 & 11687 & 13533.04 & -1846.04 \tabularnewline
5 & 11191 & 13533.04 & -2342.04 \tabularnewline
6 & 11391 & 13533.04 & -2142.04 \tabularnewline
7 & 11793 & 13533.04 & -1740.04 \tabularnewline
8 & 13933 & 13533.04 & 399.96 \tabularnewline
9 & 12778 & 13533.04 & -755.04 \tabularnewline
10 & 11810 & 13533.04 & -1723.04 \tabularnewline
11 & 13698 & 13533.04 & 164.960000000000 \tabularnewline
12 & 11956 & 13533.04 & -1577.04 \tabularnewline
13 & 10723 & 13533.04 & -2810.04 \tabularnewline
14 & 13938 & 13533.04 & 404.96 \tabularnewline
15 & 13979 & 13533.04 & 445.96 \tabularnewline
16 & 13807 & 13533.04 & 273.96 \tabularnewline
17 & 12973 & 13533.04 & -560.04 \tabularnewline
18 & 12509 & 13533.04 & -1024.04 \tabularnewline
19 & 12934 & 13533.04 & -599.04 \tabularnewline
20 & 14908 & 13533.04 & 1374.96 \tabularnewline
21 & 13772 & 13533.04 & 238.960000000000 \tabularnewline
22 & 13012 & 13533.04 & -521.04 \tabularnewline
23 & 14049 & 13533.04 & 515.96 \tabularnewline
24 & 11816 & 13533.04 & -1717.04 \tabularnewline
25 & 11593 & 13533.04 & -1940.04 \tabularnewline
26 & 14466 & 13533.04 & 932.96 \tabularnewline
27 & 13615 & 13533.04 & 81.9600000000003 \tabularnewline
28 & 14733 & 13533.04 & 1199.96 \tabularnewline
29 & 13880 & 13533.04 & 346.96 \tabularnewline
30 & 13527 & 13533.04 & -6.03999999999974 \tabularnewline
31 & 13584 & 13533.04 & 50.9600000000003 \tabularnewline
32 & 16170 & 13533.04 & 2636.96 \tabularnewline
33 & 13260 & 13533.04 & -273.04 \tabularnewline
34 & 14741 & 13533.04 & 1207.96 \tabularnewline
35 & 15486 & 13533.04 & 1952.96 \tabularnewline
36 & 13154 & 13533.04 & -379.04 \tabularnewline
37 & 12621 & 13533.04 & -912.04 \tabularnewline
38 & 15031 & 13533.04 & 1497.96 \tabularnewline
39 & 15452 & 13533.04 & 1918.96 \tabularnewline
40 & 15428 & 13533.04 & 1894.96 \tabularnewline
41 & 13105 & 13533.04 & -428.04 \tabularnewline
42 & 14716 & 13533.04 & 1182.96 \tabularnewline
43 & 14180 & 13533.04 & 646.96 \tabularnewline
44 & 16202 & 13533.04 & 2668.96 \tabularnewline
45 & 14392 & 13533.04 & 858.96 \tabularnewline
46 & 15140 & 13533.04 & 1606.96 \tabularnewline
47 & 15960 & 13533.04 & 2426.96 \tabularnewline
48 & 14351 & 13533.04 & 817.96 \tabularnewline
49 & 13230 & 13533.04 & -303.04 \tabularnewline
50 & 15202 & 13533.04 & 1668.96 \tabularnewline
51 & 17157 & 16905.7 & 251.3 \tabularnewline
52 & 16159 & 16905.7 & -746.7 \tabularnewline
53 & 13405 & 16905.7 & -3500.7 \tabularnewline
54 & 17224 & 16905.7 & 318.3 \tabularnewline
55 & 17338 & 16905.7 & 432.3 \tabularnewline
56 & 17370 & 16905.7 & 464.3 \tabularnewline
57 & 18817 & 16905.7 & 1911.3 \tabularnewline
58 & 16593 & 16905.7 & -312.7 \tabularnewline
59 & 17979 & 16905.7 & 1073.3 \tabularnewline
60 & 17015 & 16905.7 & 109.3 \tabularnewline
\hline
\end{tabular}
%Source: https://freestatistics.org/blog/index.php?pk=25421&T=4

[TABLE]
[ROW][C]Multiple Linear Regression - Actuals, Interpolation, and Residuals[/C][/ROW]
[ROW][C]Time or Index[/C][C]Actuals[/C][C]InterpolationForecast[/C][C]ResidualsPrediction Error[/C][/ROW]
[ROW][C]1[/C][C]9097[/C][C]13533.04[/C][C]-4436.04[/C][/ROW]
[ROW][C]2[/C][C]12639[/C][C]13533.04[/C][C]-894.039999999998[/C][/ROW]
[ROW][C]3[/C][C]13040[/C][C]13533.04[/C][C]-493.04[/C][/ROW]
[ROW][C]4[/C][C]11687[/C][C]13533.04[/C][C]-1846.04[/C][/ROW]
[ROW][C]5[/C][C]11191[/C][C]13533.04[/C][C]-2342.04[/C][/ROW]
[ROW][C]6[/C][C]11391[/C][C]13533.04[/C][C]-2142.04[/C][/ROW]
[ROW][C]7[/C][C]11793[/C][C]13533.04[/C][C]-1740.04[/C][/ROW]
[ROW][C]8[/C][C]13933[/C][C]13533.04[/C][C]399.96[/C][/ROW]
[ROW][C]9[/C][C]12778[/C][C]13533.04[/C][C]-755.04[/C][/ROW]
[ROW][C]10[/C][C]11810[/C][C]13533.04[/C][C]-1723.04[/C][/ROW]
[ROW][C]11[/C][C]13698[/C][C]13533.04[/C][C]164.960000000000[/C][/ROW]
[ROW][C]12[/C][C]11956[/C][C]13533.04[/C][C]-1577.04[/C][/ROW]
[ROW][C]13[/C][C]10723[/C][C]13533.04[/C][C]-2810.04[/C][/ROW]
[ROW][C]14[/C][C]13938[/C][C]13533.04[/C][C]404.96[/C][/ROW]
[ROW][C]15[/C][C]13979[/C][C]13533.04[/C][C]445.96[/C][/ROW]
[ROW][C]16[/C][C]13807[/C][C]13533.04[/C][C]273.96[/C][/ROW]
[ROW][C]17[/C][C]12973[/C][C]13533.04[/C][C]-560.04[/C][/ROW]
[ROW][C]18[/C][C]12509[/C][C]13533.04[/C][C]-1024.04[/C][/ROW]
[ROW][C]19[/C][C]12934[/C][C]13533.04[/C][C]-599.04[/C][/ROW]
[ROW][C]20[/C][C]14908[/C][C]13533.04[/C][C]1374.96[/C][/ROW]
[ROW][C]21[/C][C]13772[/C][C]13533.04[/C][C]238.960000000000[/C][/ROW]
[ROW][C]22[/C][C]13012[/C][C]13533.04[/C][C]-521.04[/C][/ROW]
[ROW][C]23[/C][C]14049[/C][C]13533.04[/C][C]515.96[/C][/ROW]
[ROW][C]24[/C][C]11816[/C][C]13533.04[/C][C]-1717.04[/C][/ROW]
[ROW][C]25[/C][C]11593[/C][C]13533.04[/C][C]-1940.04[/C][/ROW]
[ROW][C]26[/C][C]14466[/C][C]13533.04[/C][C]932.96[/C][/ROW]
[ROW][C]27[/C][C]13615[/C][C]13533.04[/C][C]81.9600000000003[/C][/ROW]
[ROW][C]28[/C][C]14733[/C][C]13533.04[/C][C]1199.96[/C][/ROW]
[ROW][C]29[/C][C]13880[/C][C]13533.04[/C][C]346.96[/C][/ROW]
[ROW][C]30[/C][C]13527[/C][C]13533.04[/C][C]-6.03999999999974[/C][/ROW]
[ROW][C]31[/C][C]13584[/C][C]13533.04[/C][C]50.9600000000003[/C][/ROW]
[ROW][C]32[/C][C]16170[/C][C]13533.04[/C][C]2636.96[/C][/ROW]
[ROW][C]33[/C][C]13260[/C][C]13533.04[/C][C]-273.04[/C][/ROW]
[ROW][C]34[/C][C]14741[/C][C]13533.04[/C][C]1207.96[/C][/ROW]
[ROW][C]35[/C][C]15486[/C][C]13533.04[/C][C]1952.96[/C][/ROW]
[ROW][C]36[/C][C]13154[/C][C]13533.04[/C][C]-379.04[/C][/ROW]
[ROW][C]37[/C][C]12621[/C][C]13533.04[/C][C]-912.04[/C][/ROW]
[ROW][C]38[/C][C]15031[/C][C]13533.04[/C][C]1497.96[/C][/ROW]
[ROW][C]39[/C][C]15452[/C][C]13533.04[/C][C]1918.96[/C][/ROW]
[ROW][C]40[/C][C]15428[/C][C]13533.04[/C][C]1894.96[/C][/ROW]
[ROW][C]41[/C][C]13105[/C][C]13533.04[/C][C]-428.04[/C][/ROW]
[ROW][C]42[/C][C]14716[/C][C]13533.04[/C][C]1182.96[/C][/ROW]
[ROW][C]43[/C][C]14180[/C][C]13533.04[/C][C]646.96[/C][/ROW]
[ROW][C]44[/C][C]16202[/C][C]13533.04[/C][C]2668.96[/C][/ROW]
[ROW][C]45[/C][C]14392[/C][C]13533.04[/C][C]858.96[/C][/ROW]
[ROW][C]46[/C][C]15140[/C][C]13533.04[/C][C]1606.96[/C][/ROW]
[ROW][C]47[/C][C]15960[/C][C]13533.04[/C][C]2426.96[/C][/ROW]
[ROW][C]48[/C][C]14351[/C][C]13533.04[/C][C]817.96[/C][/ROW]
[ROW][C]49[/C][C]13230[/C][C]13533.04[/C][C]-303.04[/C][/ROW]
[ROW][C]50[/C][C]15202[/C][C]13533.04[/C][C]1668.96[/C][/ROW]
[ROW][C]51[/C][C]17157[/C][C]16905.7[/C][C]251.3[/C][/ROW]
[ROW][C]52[/C][C]16159[/C][C]16905.7[/C][C]-746.7[/C][/ROW]
[ROW][C]53[/C][C]13405[/C][C]16905.7[/C][C]-3500.7[/C][/ROW]
[ROW][C]54[/C][C]17224[/C][C]16905.7[/C][C]318.3[/C][/ROW]
[ROW][C]55[/C][C]17338[/C][C]16905.7[/C][C]432.3[/C][/ROW]
[ROW][C]56[/C][C]17370[/C][C]16905.7[/C][C]464.3[/C][/ROW]
[ROW][C]57[/C][C]18817[/C][C]16905.7[/C][C]1911.3[/C][/ROW]
[ROW][C]58[/C][C]16593[/C][C]16905.7[/C][C]-312.7[/C][/ROW]
[ROW][C]59[/C][C]17979[/C][C]16905.7[/C][C]1073.3[/C][/ROW]
[ROW][C]60[/C][C]17015[/C][C]16905.7[/C][C]109.3[/C][/ROW]
[/TABLE]
Source: https://freestatistics.org/blog/index.php?pk=25421&T=4

Globally Unique Identifier (entire table): ba.freestatistics.org/blog/index.php?pk=25421&T=4

As an alternative you can also use a QR Code:  

The GUIDs for individual cells are displayed in the table below:

Multiple Linear Regression - Actuals, Interpolation, and Residuals
Time or IndexActualsInterpolationForecastResidualsPrediction Error
1909713533.04-4436.04
21263913533.04-894.039999999998
31304013533.04-493.04
41168713533.04-1846.04
51119113533.04-2342.04
61139113533.04-2142.04
71179313533.04-1740.04
81393313533.04399.96
91277813533.04-755.04
101181013533.04-1723.04
111369813533.04164.960000000000
121195613533.04-1577.04
131072313533.04-2810.04
141393813533.04404.96
151397913533.04445.96
161380713533.04273.96
171297313533.04-560.04
181250913533.04-1024.04
191293413533.04-599.04
201490813533.041374.96
211377213533.04238.960000000000
221301213533.04-521.04
231404913533.04515.96
241181613533.04-1717.04
251159313533.04-1940.04
261446613533.04932.96
271361513533.0481.9600000000003
281473313533.041199.96
291388013533.04346.96
301352713533.04-6.03999999999974
311358413533.0450.9600000000003
321617013533.042636.96
331326013533.04-273.04
341474113533.041207.96
351548613533.041952.96
361315413533.04-379.04
371262113533.04-912.04
381503113533.041497.96
391545213533.041918.96
401542813533.041894.96
411310513533.04-428.04
421471613533.041182.96
431418013533.04646.96
441620213533.042668.96
451439213533.04858.96
461514013533.041606.96
471596013533.042426.96
481435113533.04817.96
491323013533.04-303.04
501520213533.041668.96
511715716905.7251.3
521615916905.7-746.7
531340516905.7-3500.7
541722416905.7318.3
551733816905.7432.3
561737016905.7464.3
571881716905.71911.3
581659316905.7-312.7
591797916905.71073.3
601701516905.7109.3


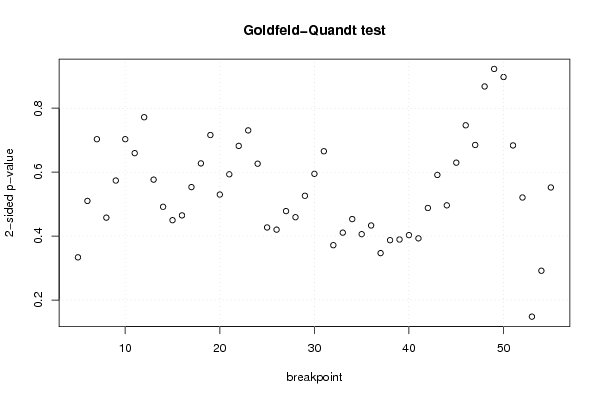
Goldfeld-Quandt test for Heteroskedasticity
p-valuesAlternative Hypothesis
breakpoint indexgreater2-sidedless
50.8332117804270270.3335764391459470.166788219572973
60.745039313697060.509921372605880.25496068630294
70.6485095335063680.7029809329872640.351490466493632
80.771167438620440.4576651227591200.228832561379560
90.7131597981628360.5736804036743290.286840201837164
100.6484878425617240.7030243148765520.351512157438276
110.6703202699678830.6593594600642340.329679730032117
120.614139990384550.77172001923090.38586000961545
130.7117545139481020.5764909721037970.288245486051898
140.7542211174256850.4915577651486290.245778882574315
150.7751445170449050.449710965910190.224855482955095
160.7676186170957830.4647627658084350.232381382904217
170.7234327896787960.5531344206424080.276567210321204
180.6863160205730670.6273679588538660.313683979426933
190.6419886864791820.7160226270416370.358011313520818
200.735049406897270.529901186205460.26495059310273
210.7033965628658460.5932068742683090.296603437134154
220.6589599386321540.6820801227356920.341040061367846
230.6347043930554390.7305912138891230.365295606944561
240.6868109596965120.6263780806069760.313189040303488
250.7864975955323220.4270048089353560.213502404467678
260.7899446443709330.4201107112581350.210055355629067
270.7609244884565970.4781510230868070.239075511543403
280.7704982358707440.4590035282585130.229501764129256
290.7370061303536640.5259877392926720.262993869646336
300.7026415549745010.5947168900509990.297358445025499
310.6673352821280380.6653294357439230.332664717871962
320.8142426784053390.3715146431893230.185757321594661
330.794633003444610.4107339931107790.205366996555390
340.7734384673857240.4531230652285510.226561532614276
350.7970023235366710.4059953529266580.202997676463329
360.7834237957192160.4331524085615670.216576204280783
370.8266484641403380.3467030717193240.173351535859662
380.8064054244858750.387189151028250.193594575514125
390.8053696533246940.3892606933506120.194630346675306
400.7984858318234240.4030283363531510.201514168176576
410.803540829133460.3929183417330780.196459170866539
420.756079082379570.4878418352408610.243920917620431
430.70434155349510.5913168930098010.295658446504900
440.7519104081406680.4961791837186650.248089591859332
450.6851989364357530.6296021271284940.314801063564247
460.6267516935837840.7464966128324330.373248306416216
470.6575430619558170.6849138760883660.342456938044183
480.5660301087492180.8679397825015650.433969891250782
490.5386336455672380.9227327088655230.461366354432762
500.4487423342328070.8974846684656150.551257665767193
510.3417679875691230.6835359751382450.658232012430877
520.2603129870153150.5206259740306310.739687012984685
530.9260081441605470.1479837116789070.0739918558394534
540.8542014972693840.2915970054612320.145798502730616
550.7239652803640520.5520694392718960.276034719635948

\begin{tabular}{lllllllll}
\hline
Goldfeld-Quandt test for Heteroskedasticity \tabularnewline
p-values & Alternative Hypothesis \tabularnewline
breakpoint index & greater & 2-sided & less \tabularnewline
5 & 0.833211780427027 & 0.333576439145947 & 0.166788219572973 \tabularnewline
6 & 0.74503931369706 & 0.50992137260588 & 0.25496068630294 \tabularnewline
7 & 0.648509533506368 & 0.702980932987264 & 0.351490466493632 \tabularnewline
8 & 0.77116743862044 & 0.457665122759120 & 0.228832561379560 \tabularnewline
9 & 0.713159798162836 & 0.573680403674329 & 0.286840201837164 \tabularnewline
10 & 0.648487842561724 & 0.703024314876552 & 0.351512157438276 \tabularnewline
11 & 0.670320269967883 & 0.659359460064234 & 0.329679730032117 \tabularnewline
12 & 0.61413999038455 & 0.7717200192309 & 0.38586000961545 \tabularnewline
13 & 0.711754513948102 & 0.576490972103797 & 0.288245486051898 \tabularnewline
14 & 0.754221117425685 & 0.491557765148629 & 0.245778882574315 \tabularnewline
15 & 0.775144517044905 & 0.44971096591019 & 0.224855482955095 \tabularnewline
16 & 0.767618617095783 & 0.464762765808435 & 0.232381382904217 \tabularnewline
17 & 0.723432789678796 & 0.553134420642408 & 0.276567210321204 \tabularnewline
18 & 0.686316020573067 & 0.627367958853866 & 0.313683979426933 \tabularnewline
19 & 0.641988686479182 & 0.716022627041637 & 0.358011313520818 \tabularnewline
20 & 0.73504940689727 & 0.52990118620546 & 0.26495059310273 \tabularnewline
21 & 0.703396562865846 & 0.593206874268309 & 0.296603437134154 \tabularnewline
22 & 0.658959938632154 & 0.682080122735692 & 0.341040061367846 \tabularnewline
23 & 0.634704393055439 & 0.730591213889123 & 0.365295606944561 \tabularnewline
24 & 0.686810959696512 & 0.626378080606976 & 0.313189040303488 \tabularnewline
25 & 0.786497595532322 & 0.427004808935356 & 0.213502404467678 \tabularnewline
26 & 0.789944644370933 & 0.420110711258135 & 0.210055355629067 \tabularnewline
27 & 0.760924488456597 & 0.478151023086807 & 0.239075511543403 \tabularnewline
28 & 0.770498235870744 & 0.459003528258513 & 0.229501764129256 \tabularnewline
29 & 0.737006130353664 & 0.525987739292672 & 0.262993869646336 \tabularnewline
30 & 0.702641554974501 & 0.594716890050999 & 0.297358445025499 \tabularnewline
31 & 0.667335282128038 & 0.665329435743923 & 0.332664717871962 \tabularnewline
32 & 0.814242678405339 & 0.371514643189323 & 0.185757321594661 \tabularnewline
33 & 0.79463300344461 & 0.410733993110779 & 0.205366996555390 \tabularnewline
34 & 0.773438467385724 & 0.453123065228551 & 0.226561532614276 \tabularnewline
35 & 0.797002323536671 & 0.405995352926658 & 0.202997676463329 \tabularnewline
36 & 0.783423795719216 & 0.433152408561567 & 0.216576204280783 \tabularnewline
37 & 0.826648464140338 & 0.346703071719324 & 0.173351535859662 \tabularnewline
38 & 0.806405424485875 & 0.38718915102825 & 0.193594575514125 \tabularnewline
39 & 0.805369653324694 & 0.389260693350612 & 0.194630346675306 \tabularnewline
40 & 0.798485831823424 & 0.403028336353151 & 0.201514168176576 \tabularnewline
41 & 0.80354082913346 & 0.392918341733078 & 0.196459170866539 \tabularnewline
42 & 0.75607908237957 & 0.487841835240861 & 0.243920917620431 \tabularnewline
43 & 0.7043415534951 & 0.591316893009801 & 0.295658446504900 \tabularnewline
44 & 0.751910408140668 & 0.496179183718665 & 0.248089591859332 \tabularnewline
45 & 0.685198936435753 & 0.629602127128494 & 0.314801063564247 \tabularnewline
46 & 0.626751693583784 & 0.746496612832433 & 0.373248306416216 \tabularnewline
47 & 0.657543061955817 & 0.684913876088366 & 0.342456938044183 \tabularnewline
48 & 0.566030108749218 & 0.867939782501565 & 0.433969891250782 \tabularnewline
49 & 0.538633645567238 & 0.922732708865523 & 0.461366354432762 \tabularnewline
50 & 0.448742334232807 & 0.897484668465615 & 0.551257665767193 \tabularnewline
51 & 0.341767987569123 & 0.683535975138245 & 0.658232012430877 \tabularnewline
52 & 0.260312987015315 & 0.520625974030631 & 0.739687012984685 \tabularnewline
53 & 0.926008144160547 & 0.147983711678907 & 0.0739918558394534 \tabularnewline
54 & 0.854201497269384 & 0.291597005461232 & 0.145798502730616 \tabularnewline
55 & 0.723965280364052 & 0.552069439271896 & 0.276034719635948 \tabularnewline
\hline
\end{tabular}
%Source: https://freestatistics.org/blog/index.php?pk=25421&T=5

[TABLE]
[ROW][C]Goldfeld-Quandt test for Heteroskedasticity[/C][/ROW]
[ROW][C]p-values[/C][C]Alternative Hypothesis[/C][/ROW]
[ROW][C]breakpoint index[/C][C]greater[/C][C]2-sided[/C][C]less[/C][/ROW]
[ROW][C]5[/C][C]0.833211780427027[/C][C]0.333576439145947[/C][C]0.166788219572973[/C][/ROW]
[ROW][C]6[/C][C]0.74503931369706[/C][C]0.50992137260588[/C][C]0.25496068630294[/C][/ROW]
[ROW][C]7[/C][C]0.648509533506368[/C][C]0.702980932987264[/C][C]0.351490466493632[/C][/ROW]
[ROW][C]8[/C][C]0.77116743862044[/C][C]0.457665122759120[/C][C]0.228832561379560[/C][/ROW]
[ROW][C]9[/C][C]0.713159798162836[/C][C]0.573680403674329[/C][C]0.286840201837164[/C][/ROW]
[ROW][C]10[/C][C]0.648487842561724[/C][C]0.703024314876552[/C][C]0.351512157438276[/C][/ROW]
[ROW][C]11[/C][C]0.670320269967883[/C][C]0.659359460064234[/C][C]0.329679730032117[/C][/ROW]
[ROW][C]12[/C][C]0.61413999038455[/C][C]0.7717200192309[/C][C]0.38586000961545[/C][/ROW]
[ROW][C]13[/C][C]0.711754513948102[/C][C]0.576490972103797[/C][C]0.288245486051898[/C][/ROW]
[ROW][C]14[/C][C]0.754221117425685[/C][C]0.491557765148629[/C][C]0.245778882574315[/C][/ROW]
[ROW][C]15[/C][C]0.775144517044905[/C][C]0.44971096591019[/C][C]0.224855482955095[/C][/ROW]
[ROW][C]16[/C][C]0.767618617095783[/C][C]0.464762765808435[/C][C]0.232381382904217[/C][/ROW]
[ROW][C]17[/C][C]0.723432789678796[/C][C]0.553134420642408[/C][C]0.276567210321204[/C][/ROW]
[ROW][C]18[/C][C]0.686316020573067[/C][C]0.627367958853866[/C][C]0.313683979426933[/C][/ROW]
[ROW][C]19[/C][C]0.641988686479182[/C][C]0.716022627041637[/C][C]0.358011313520818[/C][/ROW]
[ROW][C]20[/C][C]0.73504940689727[/C][C]0.52990118620546[/C][C]0.26495059310273[/C][/ROW]
[ROW][C]21[/C][C]0.703396562865846[/C][C]0.593206874268309[/C][C]0.296603437134154[/C][/ROW]
[ROW][C]22[/C][C]0.658959938632154[/C][C]0.682080122735692[/C][C]0.341040061367846[/C][/ROW]
[ROW][C]23[/C][C]0.634704393055439[/C][C]0.730591213889123[/C][C]0.365295606944561[/C][/ROW]
[ROW][C]24[/C][C]0.686810959696512[/C][C]0.626378080606976[/C][C]0.313189040303488[/C][/ROW]
[ROW][C]25[/C][C]0.786497595532322[/C][C]0.427004808935356[/C][C]0.213502404467678[/C][/ROW]
[ROW][C]26[/C][C]0.789944644370933[/C][C]0.420110711258135[/C][C]0.210055355629067[/C][/ROW]
[ROW][C]27[/C][C]0.760924488456597[/C][C]0.478151023086807[/C][C]0.239075511543403[/C][/ROW]
[ROW][C]28[/C][C]0.770498235870744[/C][C]0.459003528258513[/C][C]0.229501764129256[/C][/ROW]
[ROW][C]29[/C][C]0.737006130353664[/C][C]0.525987739292672[/C][C]0.262993869646336[/C][/ROW]
[ROW][C]30[/C][C]0.702641554974501[/C][C]0.594716890050999[/C][C]0.297358445025499[/C][/ROW]
[ROW][C]31[/C][C]0.667335282128038[/C][C]0.665329435743923[/C][C]0.332664717871962[/C][/ROW]
[ROW][C]32[/C][C]0.814242678405339[/C][C]0.371514643189323[/C][C]0.185757321594661[/C][/ROW]
[ROW][C]33[/C][C]0.79463300344461[/C][C]0.410733993110779[/C][C]0.205366996555390[/C][/ROW]
[ROW][C]34[/C][C]0.773438467385724[/C][C]0.453123065228551[/C][C]0.226561532614276[/C][/ROW]
[ROW][C]35[/C][C]0.797002323536671[/C][C]0.405995352926658[/C][C]0.202997676463329[/C][/ROW]
[ROW][C]36[/C][C]0.783423795719216[/C][C]0.433152408561567[/C][C]0.216576204280783[/C][/ROW]
[ROW][C]37[/C][C]0.826648464140338[/C][C]0.346703071719324[/C][C]0.173351535859662[/C][/ROW]
[ROW][C]38[/C][C]0.806405424485875[/C][C]0.38718915102825[/C][C]0.193594575514125[/C][/ROW]
[ROW][C]39[/C][C]0.805369653324694[/C][C]0.389260693350612[/C][C]0.194630346675306[/C][/ROW]
[ROW][C]40[/C][C]0.798485831823424[/C][C]0.403028336353151[/C][C]0.201514168176576[/C][/ROW]
[ROW][C]41[/C][C]0.80354082913346[/C][C]0.392918341733078[/C][C]0.196459170866539[/C][/ROW]
[ROW][C]42[/C][C]0.75607908237957[/C][C]0.487841835240861[/C][C]0.243920917620431[/C][/ROW]
[ROW][C]43[/C][C]0.7043415534951[/C][C]0.591316893009801[/C][C]0.295658446504900[/C][/ROW]
[ROW][C]44[/C][C]0.751910408140668[/C][C]0.496179183718665[/C][C]0.248089591859332[/C][/ROW]
[ROW][C]45[/C][C]0.685198936435753[/C][C]0.629602127128494[/C][C]0.314801063564247[/C][/ROW]
[ROW][C]46[/C][C]0.626751693583784[/C][C]0.746496612832433[/C][C]0.373248306416216[/C][/ROW]
[ROW][C]47[/C][C]0.657543061955817[/C][C]0.684913876088366[/C][C]0.342456938044183[/C][/ROW]
[ROW][C]48[/C][C]0.566030108749218[/C][C]0.867939782501565[/C][C]0.433969891250782[/C][/ROW]
[ROW][C]49[/C][C]0.538633645567238[/C][C]0.922732708865523[/C][C]0.461366354432762[/C][/ROW]
[ROW][C]50[/C][C]0.448742334232807[/C][C]0.897484668465615[/C][C]0.551257665767193[/C][/ROW]
[ROW][C]51[/C][C]0.341767987569123[/C][C]0.683535975138245[/C][C]0.658232012430877[/C][/ROW]
[ROW][C]52[/C][C]0.260312987015315[/C][C]0.520625974030631[/C][C]0.739687012984685[/C][/ROW]
[ROW][C]53[/C][C]0.926008144160547[/C][C]0.147983711678907[/C][C]0.0739918558394534[/C][/ROW]
[ROW][C]54[/C][C]0.854201497269384[/C][C]0.291597005461232[/C][C]0.145798502730616[/C][/ROW]
[ROW][C]55[/C][C]0.723965280364052[/C][C]0.552069439271896[/C][C]0.276034719635948[/C][/ROW]
[/TABLE]
Source: https://freestatistics.org/blog/index.php?pk=25421&T=5

Globally Unique Identifier (entire table): ba.freestatistics.org/blog/index.php?pk=25421&T=5

As an alternative you can also use a QR Code:  

The GUIDs for individual cells are displayed in the table below:

Goldfeld-Quandt test for Heteroskedasticity
p-valuesAlternative Hypothesis
breakpoint indexgreater2-sidedless
50.8332117804270270.3335764391459470.166788219572973
60.745039313697060.509921372605880.25496068630294
70.6485095335063680.7029809329872640.351490466493632
80.771167438620440.4576651227591200.228832561379560
90.7131597981628360.5736804036743290.286840201837164
100.6484878425617240.7030243148765520.351512157438276
110.6703202699678830.6593594600642340.329679730032117
120.614139990384550.77172001923090.38586000961545
130.7117545139481020.5764909721037970.288245486051898
140.7542211174256850.4915577651486290.245778882574315
150.7751445170449050.449710965910190.224855482955095
160.7676186170957830.4647627658084350.232381382904217
170.7234327896787960.5531344206424080.276567210321204
180.6863160205730670.6273679588538660.313683979426933
190.6419886864791820.7160226270416370.358011313520818
200.735049406897270.529901186205460.26495059310273
210.7033965628658460.5932068742683090.296603437134154
220.6589599386321540.6820801227356920.341040061367846
230.6347043930554390.7305912138891230.365295606944561
240.6868109596965120.6263780806069760.313189040303488
250.7864975955323220.4270048089353560.213502404467678
260.7899446443709330.4201107112581350.210055355629067
270.7609244884565970.4781510230868070.239075511543403
280.7704982358707440.4590035282585130.229501764129256
290.7370061303536640.5259877392926720.262993869646336
300.7026415549745010.5947168900509990.297358445025499
310.6673352821280380.6653294357439230.332664717871962
320.8142426784053390.3715146431893230.185757321594661
330.794633003444610.4107339931107790.205366996555390
340.7734384673857240.4531230652285510.226561532614276
350.7970023235366710.4059953529266580.202997676463329
360.7834237957192160.4331524085615670.216576204280783
370.8266484641403380.3467030717193240.173351535859662
380.8064054244858750.387189151028250.193594575514125
390.8053696533246940.3892606933506120.194630346675306
400.7984858318234240.4030283363531510.201514168176576
410.803540829133460.3929183417330780.196459170866539
420.756079082379570.4878418352408610.243920917620431
430.70434155349510.5913168930098010.295658446504900
440.7519104081406680.4961791837186650.248089591859332
450.6851989364357530.6296021271284940.314801063564247
460.6267516935837840.7464966128324330.373248306416216
470.6575430619558170.6849138760883660.342456938044183
480.5660301087492180.8679397825015650.433969891250782
490.5386336455672380.9227327088655230.461366354432762
500.4487423342328070.8974846684656150.551257665767193
510.3417679875691230.6835359751382450.658232012430877
520.2603129870153150.5206259740306310.739687012984685
530.9260081441605470.1479837116789070.0739918558394534
540.8542014972693840.2915970054612320.145798502730616
550.7239652803640520.5520694392718960.276034719635948


Meta Analysis of Goldfeld-Quandt test for Heteroskedasticity
Description# significant tests% significant testsOK/NOK
1% type I error level00OK
5% type I error level00OK
10% type I error level00OK

\begin{tabular}{lllllllll}
\hline
Meta Analysis of Goldfeld-Quandt test for Heteroskedasticity \tabularnewline
Description & # significant tests & % significant tests & OK/NOK \tabularnewline
1% type I error level & 0 & 0 & OK \tabularnewline
5% type I error level & 0 & 0 & OK \tabularnewline
10% type I error level & 0 & 0 & OK \tabularnewline
\hline
\end{tabular}
%Source: https://freestatistics.org/blog/index.php?pk=25421&T=6

[TABLE]
[ROW][C]Meta Analysis of Goldfeld-Quandt test for Heteroskedasticity[/C][/ROW]
[ROW][C]Description[/C][C]# significant tests[/C][C]% significant tests[/C][C]OK/NOK[/C][/ROW]
[ROW][C]1% type I error level[/C][C]0[/C][C]0[/C][C]OK[/C][/ROW]
[ROW][C]5% type I error level[/C][C]0[/C][C]0[/C][C]OK[/C][/ROW]
[ROW][C]10% type I error level[/C][C]0[/C][C]0[/C][C]OK[/C][/ROW]
[/TABLE]
Source: https://freestatistics.org/blog/index.php?pk=25421&T=6

Globally Unique Identifier (entire table): ba.freestatistics.org/blog/index.php?pk=25421&T=6

As an alternative you can also use a QR Code:  

The GUIDs for individual cells are displayed in the table below:

Meta Analysis of Goldfeld-Quandt test for Heteroskedasticity
Description# significant tests% significant testsOK/NOK
1% type I error level00OK
5% type I error level00OK
10% type I error level00OK


Parameters (Session):
par1 = 1 ; par2 = Do not include Seasonal Dummies ; par3 = No Linear Trend ;
Parameters (R input):
par1 = 1 ; par2 = Do not include Seasonal Dummies ; par3 = No Linear Trend ;
R code (references can be found in the software module):
library(lattice)
library(lmtest)
n25 <- 25 #minimum number of obs. for Goldfeld-Quandt test
par1 <- as.numeric(par1)
x <- t(y)
k <- length(x[1,])
n <- length(x[,1])
x1 <- cbind(x[,par1], x[,1:k!=par1])
mycolnames <- c(colnames(x)[par1], colnames(x)[1:k!=par1])
colnames(x1) <- mycolnames #colnames(x)[par1]
x <- x1
if (par3 == 'First Differences'){
x2 <- array(0, dim=c(n-1,k), dimnames=list(1:(n-1), paste('(1-B)',colnames(x),sep='')))
for (i in 1:n-1) {
for (j in 1:k) {
x2[i,j] <- x[i+1,j] - x[i,j]
}
}
x <- x2
}
if (par2 == 'Include Monthly Dummies'){
x2 <- array(0, dim=c(n,11), dimnames=list(1:n, paste('M', seq(1:11), sep ='')))
for (i in 1:11){
x2[seq(i,n,12),i] <- 1
}
x <- cbind(x, x2)
}
if (par2 == 'Include Quarterly Dummies'){
x2 <- array(0, dim=c(n,3), dimnames=list(1:n, paste('Q', seq(1:3), sep ='')))
for (i in 1:3){
x2[seq(i,n,4),i] <- 1
}
x <- cbind(x, x2)
}
k <- length(x[1,])
if (par3 == 'Linear Trend'){
x <- cbind(x, c(1:n))
colnames(x)[k+1] <- 't'
}
x
k <- length(x[1,])
df <- as.data.frame(x)
(mylm <- lm(df))
(mysum <- summary(mylm))
if (n > n25) {
kp3 <- k + 3
nmkm3 <- n - k - 3
gqarr <- array(NA, dim=c(nmkm3-kp3+1,3))
numgqtests <- 0
numsignificant1 <- 0
numsignificant5 <- 0
numsignificant10 <- 0
for (mypoint in kp3:nmkm3) {
j <- 0
numgqtests <- numgqtests + 1
for (myalt in c('greater', 'two.sided', 'less')) {
j <- j + 1
gqarr[mypoint-kp3+1,j] <- gqtest(mylm, point=mypoint, alternative=myalt)$p.value
}
if (gqarr[mypoint-kp3+1,2] < 0.01) numsignificant1 <- numsignificant1 + 1
if (gqarr[mypoint-kp3+1,2] < 0.05) numsignificant5 <- numsignificant5 + 1
if (gqarr[mypoint-kp3+1,2] < 0.10) numsignificant10 <- numsignificant10 + 1
}
gqarr
}
bitmap(file='test0.png')
plot(x[,1], type='l', main='Actuals and Interpolation', ylab='value of Actuals and Interpolation (dots)', xlab='time or index')
points(x[,1]-mysum$resid)
grid()
dev.off()
bitmap(file='test1.png')
plot(mysum$resid, type='b', pch=19, main='Residuals', ylab='value of Residuals', xlab='time or index')
grid()
dev.off()
bitmap(file='test2.png')
hist(mysum$resid, main='Residual Histogram', xlab='values of Residuals')
grid()
dev.off()
bitmap(file='test3.png')
densityplot(~mysum$resid,col='black',main='Residual Density Plot', xlab='values of Residuals')
dev.off()
bitmap(file='test4.png')
qqnorm(mysum$resid, main='Residual Normal Q-Q Plot')
qqline(mysum$resid)
grid()
dev.off()
(myerror <- as.ts(mysum$resid))
bitmap(file='test5.png')
dum <- cbind(lag(myerror,k=1),myerror)
dum
dum1 <- dum[2:length(myerror),]
dum1
z <- as.data.frame(dum1)
z
plot(z,main=paste('Residual Lag plot, lowess, and regression line'), ylab='values of Residuals', xlab='lagged values of Residuals')
lines(lowess(z))
abline(lm(z))
grid()
dev.off()
bitmap(file='test6.png')
acf(mysum$resid, lag.max=length(mysum$resid)/2, main='Residual Autocorrelation Function')
grid()
dev.off()
bitmap(file='test7.png')
pacf(mysum$resid, lag.max=length(mysum$resid)/2, main='Residual Partial Autocorrelation Function')
grid()
dev.off()
bitmap(file='test8.png')
opar <- par(mfrow = c(2,2), oma = c(0, 0, 1.1, 0))
plot(mylm, las = 1, sub='Residual Diagnostics')
par(opar)
dev.off()
if (n > n25) {
bitmap(file='test9.png')
plot(kp3:nmkm3,gqarr[,2], main='Goldfeld-Quandt test',ylab='2-sided p-value',xlab='breakpoint')
grid()
dev.off()
}
load(file='createtable')
a<-table.start()
a<-table.row.start(a)
a<-table.element(a, 'Multiple Linear Regression - Estimated Regression Equation', 1, TRUE)
a<-table.row.end(a)
myeq <- colnames(x)[1]
myeq <- paste(myeq, '[t] = ', sep='')
for (i in 1:k){
if (mysum$coefficients[i,1] > 0) myeq <- paste(myeq, '+', '')
myeq <- paste(myeq, mysum$coefficients[i,1], sep=' ')
if (rownames(mysum$coefficients)[i] != '(Intercept)') {
myeq <- paste(myeq, rownames(mysum$coefficients)[i], sep='')
if (rownames(mysum$coefficients)[i] != 't') myeq <- paste(myeq, '[t]', sep='')
}
}
myeq <- paste(myeq, ' + e[t]')
a<-table.row.start(a)
a<-table.element(a, myeq)
a<-table.row.end(a)
a<-table.end(a)
table.save(a,file='mytable1.tab')
a<-table.start()
a<-table.row.start(a)
a<-table.element(a,hyperlink('ols1.htm','Multiple Linear Regression - Ordinary Least Squares',''), 6, TRUE)
a<-table.row.end(a)
a<-table.row.start(a)
a<-table.element(a,'Variable',header=TRUE)
a<-table.element(a,'Parameter',header=TRUE)
a<-table.element(a,'S.D.',header=TRUE)
a<-table.element(a,'T-STAT
H0: parameter = 0',header=TRUE)
a<-table.element(a,'2-tail p-value',header=TRUE)
a<-table.element(a,'1-tail p-value',header=TRUE)
a<-table.row.end(a)
for (i in 1:k){
a<-table.row.start(a)
a<-table.element(a,rownames(mysum$coefficients)[i],header=TRUE)
a<-table.element(a,mysum$coefficients[i,1])
a<-table.element(a, round(mysum$coefficients[i,2],6))
a<-table.element(a, round(mysum$coefficients[i,3],4))
a<-table.element(a, round(mysum$coefficients[i,4],6))
a<-table.element(a, round(mysum$coefficients[i,4]/2,6))
a<-table.row.end(a)
}
a<-table.end(a)
table.save(a,file='mytable2.tab')
a<-table.start()
a<-table.row.start(a)
a<-table.element(a, 'Multiple Linear Regression - Regression Statistics', 2, TRUE)
a<-table.row.end(a)
a<-table.row.start(a)
a<-table.element(a, 'Multiple R',1,TRUE)
a<-table.element(a, sqrt(mysum$r.squared))
a<-table.row.end(a)
a<-table.row.start(a)
a<-table.element(a, 'R-squared',1,TRUE)
a<-table.element(a, mysum$r.squared)
a<-table.row.end(a)
a<-table.row.start(a)
a<-table.element(a, 'Adjusted R-squared',1,TRUE)
a<-table.element(a, mysum$adj.r.squared)
a<-table.row.end(a)
a<-table.row.start(a)
a<-table.element(a, 'F-TEST (value)',1,TRUE)
a<-table.element(a, mysum$fstatistic[1])
a<-table.row.end(a)
a<-table.row.start(a)
a<-table.element(a, 'F-TEST (DF numerator)',1,TRUE)
a<-table.element(a, mysum$fstatistic[2])
a<-table.row.end(a)
a<-table.row.start(a)
a<-table.element(a, 'F-TEST (DF denominator)',1,TRUE)
a<-table.element(a, mysum$fstatistic[3])
a<-table.row.end(a)
a<-table.row.start(a)
a<-table.element(a, 'p-value',1,TRUE)
a<-table.element(a, 1-pf(mysum$fstatistic[1],mysum$fstatistic[2],mysum$fstatistic[3]))
a<-table.row.end(a)
a<-table.row.start(a)
a<-table.element(a, 'Multiple Linear Regression - Residual Statistics', 2, TRUE)
a<-table.row.end(a)
a<-table.row.start(a)
a<-table.element(a, 'Residual Standard Deviation',1,TRUE)
a<-table.element(a, mysum$sigma)
a<-table.row.end(a)
a<-table.row.start(a)
a<-table.element(a, 'Sum Squared Residuals',1,TRUE)
a<-table.element(a, sum(myerror*myerror))
a<-table.row.end(a)
a<-table.end(a)
table.save(a,file='mytable3.tab')
a<-table.start()
a<-table.row.start(a)
a<-table.element(a, 'Multiple Linear Regression - Actuals, Interpolation, and Residuals', 4, TRUE)
a<-table.row.end(a)
a<-table.row.start(a)
a<-table.element(a, 'Time or Index', 1, TRUE)
a<-table.element(a, 'Actuals', 1, TRUE)
a<-table.element(a, 'Interpolation
Forecast', 1, TRUE)
a<-table.element(a, 'Residuals
Prediction Error', 1, TRUE)
a<-table.row.end(a)
for (i in 1:n) {
a<-table.row.start(a)
a<-table.element(a,i, 1, TRUE)
a<-table.element(a,x[i])
a<-table.element(a,x[i]-mysum$resid[i])
a<-table.element(a,mysum$resid[i])
a<-table.row.end(a)
}
a<-table.end(a)
table.save(a,file='mytable4.tab')
if (n > n25) {
a<-table.start()
a<-table.row.start(a)
a<-table.element(a,'Goldfeld-Quandt test for Heteroskedasticity',4,TRUE)
a<-table.row.end(a)
a<-table.row.start(a)
a<-table.element(a,'p-values',header=TRUE)
a<-table.element(a,'Alternative Hypothesis',3,header=TRUE)
a<-table.row.end(a)
a<-table.row.start(a)
a<-table.element(a,'breakpoint index',header=TRUE)
a<-table.element(a,'greater',header=TRUE)
a<-table.element(a,'2-sided',header=TRUE)
a<-table.element(a,'less',header=TRUE)
a<-table.row.end(a)
for (mypoint in kp3:nmkm3) {
a<-table.row.start(a)
a<-table.element(a,mypoint,header=TRUE)
a<-table.element(a,gqarr[mypoint-kp3+1,1])
a<-table.element(a,gqarr[mypoint-kp3+1,2])
a<-table.element(a,gqarr[mypoint-kp3+1,3])
a<-table.row.end(a)
}
a<-table.end(a)
table.save(a,file='mytable5.tab')
a<-table.start()
a<-table.row.start(a)
a<-table.element(a,'Meta Analysis of Goldfeld-Quandt test for Heteroskedasticity',4,TRUE)
a<-table.row.end(a)
a<-table.row.start(a)
a<-table.element(a,'Description',header=TRUE)
a<-table.element(a,'# significant tests',header=TRUE)
a<-table.element(a,'% significant tests',header=TRUE)
a<-table.element(a,'OK/NOK',header=TRUE)
a<-table.row.end(a)
a<-table.row.start(a)
a<-table.element(a,'1% type I error level',header=TRUE)
a<-table.element(a,numsignificant1)
a<-table.element(a,numsignificant1/numgqtests)
if (numsignificant1/numgqtests < 0.01) dum <- 'OK' else dum <- 'NOK'
a<-table.element(a,dum)
a<-table.row.end(a)
a<-table.row.start(a)
a<-table.element(a,'5% type I error level',header=TRUE)
a<-table.element(a,numsignificant5)
a<-table.element(a,numsignificant5/numgqtests)
if (numsignificant5/numgqtests < 0.05) dum <- 'OK' else dum <- 'NOK'
a<-table.element(a,dum)
a<-table.row.end(a)
a<-table.row.start(a)
a<-table.element(a,'10% type I error level',header=TRUE)
a<-table.element(a,numsignificant10)
a<-table.element(a,numsignificant10/numgqtests)
if (numsignificant10/numgqtests < 0.1) dum <- 'OK' else dum <- 'NOK'
a<-table.element(a,dum)
a<-table.row.end(a)
a<-table.end(a)
table.save(a,file='mytable6.tab')
}