Free Statistics

of Irreproducible Research!

Author's title

Author*Unverified author*
R Software Modulerwasp_multipleregression.wasp
Title produced by softwareMultiple Regression
Date of computationMon, 24 Nov 2008 05:04:39 -0700
Cite this page as followsStatistical Computations at FreeStatistics.org, Office for Research Development and Education, URL https://freestatistics.org/blog/index.php?v=date/2008/Nov/24/t1227528378uzlol7bvusvdr8n.htm/, Retrieved Tue, 14 May 2024 19:50:37 +0000
Statistical Computations at FreeStatistics.org, Office for Research Development and Education, URL https://freestatistics.org/blog/index.php?pk=25409, Retrieved Tue, 14 May 2024 19:50:37 +0000
QR Codes:

Original text written by user:
IsPrivate?No (this computation is public)
User-defined keywordsVan Dooren Leen
Estimated Impact156
Family? (F = Feedback message, R = changed R code, M = changed R Module, P = changed Parameters, D = changed Data)
F       [Multiple Regression] [Seatbelt Law Q3] [2008-11-24 12:04:39] [d175f84d503eb4f2a43145d5e67795b5] [Current]
F   PD    [Multiple Regression] [seabelt law Q3] [2008-11-27 12:31:42] [9ea94c8297ec7e569f27218c1d8ea30f]
F   PD      [Multiple Regression] [seabelt law Q3.1] [2008-11-27 12:49:31] [9ea94c8297ec7e569f27218c1d8ea30f]
-   PD      [Multiple Regression] [seabelt law Q3.2] [2008-11-27 13:05:29] [9ea94c8297ec7e569f27218c1d8ea30f]
Feedback Forum
2008-11-29 20:35:26 [006ad2c49b6a7c2ad6ab685cfc1dae56] [reply
Goed opgelost, ik had enkel nog tabellen moeten toevoegen, net als bij Q1 en Q2.
2008-12-01 15:21:59 [Stefan Temmerman] [reply
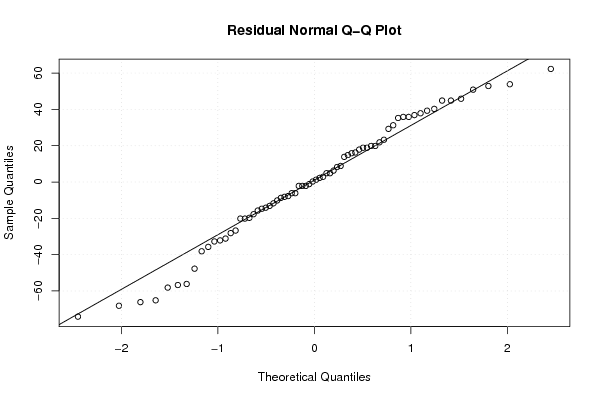
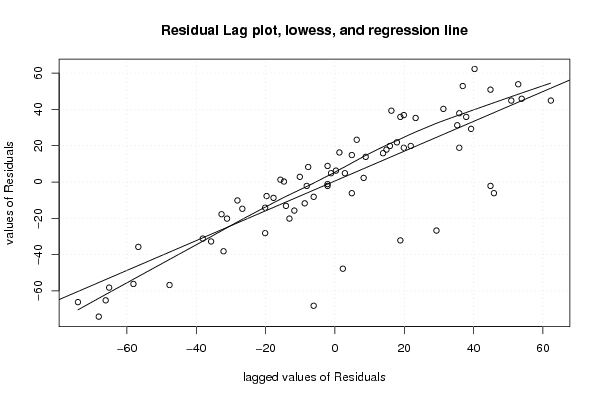
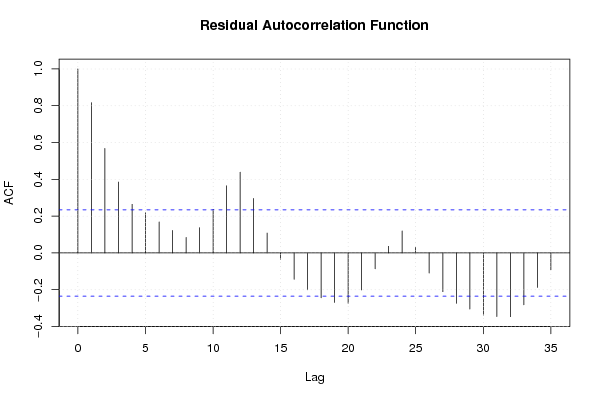
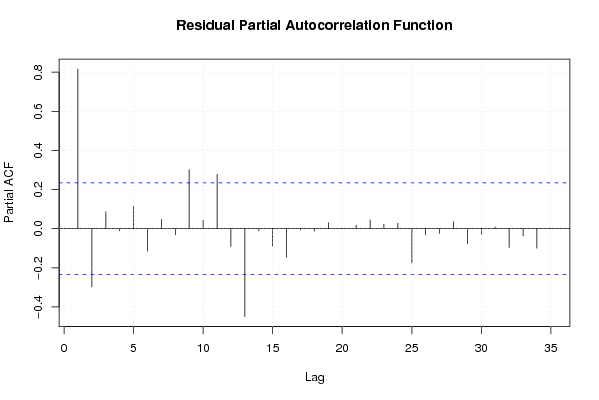
De student gebruikt de goede methode, maar laat een grondige uitleg achterwege. Ook is er in de berekening sprake van een gebruikte dummy, maar nergens wordt vermeld welke het is. De student behandelt de werkloosheid, maar onderzoekt geen seizoenaliteit, en ook geen lineaire trend, wat bij dit onderwerp wel relevant kan zijn. Er wordt niet gekeken naar significantie van het model, via de T-STAT, p-values, R² etc. De autocorrelatie, welke hier aanwezig is, duidt ook op een model dat voor verbetering vatbaar is.

Post a new message
Dataseries X:
519	0
517	0
510	0
509	0
501	0
507	0
569	0
580	0
578	0
565	0
547	0
555	0
562	0
561	0
555	0
544	0
537	0
543	0
594	0
611	0
613	0
611	0
594	0
595	0
591	0
589	0
584	0
573	0
567	0
569	0
621	0
629	0
628	0
612	0
595	0
597	0
593	0
590	0
580	0
574	0
573	0
573	0
620	0
626	0
620	0
588	1
566	1
557	1
561	1
549	1
532	1
526	1
511	1
499	1
555	1
565	1
542	1
527	1
510	1
514	1
517	1
508	1
493	1
490	1
469	1
478	1
528	1
534	1
518	1
506	1


Summary of computational transaction
Raw Inputview raw input (R code)
Raw Outputview raw output of R engine
Computing time4 seconds
R Server'Gwilym Jenkins' @ 72.249.127.135

\begin{tabular}{lllllllll}
\hline
Summary of computational transaction \tabularnewline
Raw Input & view raw input (R code)  \tabularnewline
Raw Output & view raw output of R engine  \tabularnewline
Computing time & 4 seconds \tabularnewline
R Server & 'Gwilym Jenkins' @ 72.249.127.135 \tabularnewline
\hline
\end{tabular}
%Source: https://freestatistics.org/blog/index.php?pk=25409&T=0

[TABLE]
[ROW][C]Summary of computational transaction[/C][/ROW]
[ROW][C]Raw Input[/C][C]view raw input (R code) [/C][/ROW]
[ROW][C]Raw Output[/C][C]view raw output of R engine [/C][/ROW]
[ROW][C]Computing time[/C][C]4 seconds[/C][/ROW]
[ROW][C]R Server[/C][C]'Gwilym Jenkins' @ 72.249.127.135[/C][/ROW]
[/TABLE]
Source: https://freestatistics.org/blog/index.php?pk=25409&T=0

Globally Unique Identifier (entire table): ba.freestatistics.org/blog/index.php?pk=25409&T=0

As an alternative you can also use a QR Code:  

The GUIDs for individual cells are displayed in the table below:

Summary of computational transaction
Raw Inputview raw input (R code)
Raw Outputview raw output of R engine
Computing time4 seconds
R Server'Gwilym Jenkins' @ 72.249.127.135


Multiple Linear Regression - Estimated Regression Equation
W[t] = + 575.133333333333 -49.4133333333334D[t] + e[t]

\begin{tabular}{lllllllll}
\hline
Multiple Linear Regression - Estimated Regression Equation \tabularnewline
W[t] =  +  575.133333333333 -49.4133333333334D[t]  + e[t] \tabularnewline
\hline
\end{tabular}
%Source: https://freestatistics.org/blog/index.php?pk=25409&T=1

[TABLE]
[ROW][C]Multiple Linear Regression - Estimated Regression Equation[/C][/ROW]
[ROW][C]W[t] =  +  575.133333333333 -49.4133333333334D[t]  + e[t][/C][/ROW]
[/TABLE]
Source: https://freestatistics.org/blog/index.php?pk=25409&T=1

Globally Unique Identifier (entire table): ba.freestatistics.org/blog/index.php?pk=25409&T=1

As an alternative you can also use a QR Code:  

The GUIDs for individual cells are displayed in the table below:

Multiple Linear Regression - Estimated Regression Equation
W[t] = + 575.133333333333 -49.4133333333334D[t] + e[t]


Multiple Linear Regression - Ordinary Least Squares
VariableParameterS.D.T-STATH0: parameter = 02-tail p-value1-tail p-value
(Intercept)575.1333333333334.94718116.254800
D-49.41333333333348.278215-5.969100

\begin{tabular}{lllllllll}
\hline
Multiple Linear Regression - Ordinary Least Squares \tabularnewline
Variable & Parameter & S.D. & T-STATH0: parameter = 0 & 2-tail p-value & 1-tail p-value \tabularnewline
(Intercept) & 575.133333333333 & 4.94718 & 116.2548 & 0 & 0 \tabularnewline
D & -49.4133333333334 & 8.278215 & -5.9691 & 0 & 0 \tabularnewline
\hline
\end{tabular}
%Source: https://freestatistics.org/blog/index.php?pk=25409&T=2

[TABLE]
[ROW][C]Multiple Linear Regression - Ordinary Least Squares[/C][/ROW]
[ROW][C]Variable[/C][C]Parameter[/C][C]S.D.[/C][C]T-STATH0: parameter = 0[/C][C]2-tail p-value[/C][C]1-tail p-value[/C][/ROW]
[ROW][C](Intercept)[/C][C]575.133333333333[/C][C]4.94718[/C][C]116.2548[/C][C]0[/C][C]0[/C][/ROW]
[ROW][C]D[/C][C]-49.4133333333334[/C][C]8.278215[/C][C]-5.9691[/C][C]0[/C][C]0[/C][/ROW]
[/TABLE]
Source: https://freestatistics.org/blog/index.php?pk=25409&T=2

Globally Unique Identifier (entire table): ba.freestatistics.org/blog/index.php?pk=25409&T=2

As an alternative you can also use a QR Code:  

The GUIDs for individual cells are displayed in the table below:

Multiple Linear Regression - Ordinary Least Squares
VariableParameterS.D.T-STATH0: parameter = 02-tail p-value1-tail p-value
(Intercept)575.1333333333334.94718116.254800
D-49.41333333333348.278215-5.969100


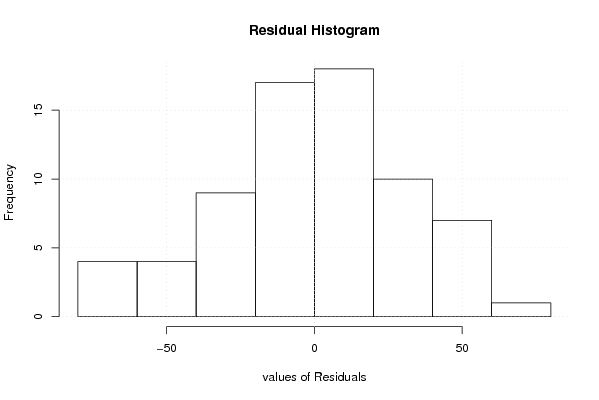
Multiple Linear Regression - Regression Statistics
Multiple R0.58636069678184
R-squared0.343818866730485
Adjusted R-squared0.334169144182404
F-TEST (value)35.6299225202962
F-TEST (DF numerator)1
F-TEST (DF denominator)68
p-value9.62911737012462e-08
Multiple Linear Regression - Residual Statistics
Residual Standard Deviation33.1866911666143
Sum Squared Residuals74892.24

\begin{tabular}{lllllllll}
\hline
Multiple Linear Regression - Regression Statistics \tabularnewline
Multiple R & 0.58636069678184 \tabularnewline
R-squared & 0.343818866730485 \tabularnewline
Adjusted R-squared & 0.334169144182404 \tabularnewline
F-TEST (value) & 35.6299225202962 \tabularnewline
F-TEST (DF numerator) & 1 \tabularnewline
F-TEST (DF denominator) & 68 \tabularnewline
p-value & 9.62911737012462e-08 \tabularnewline
Multiple Linear Regression - Residual Statistics \tabularnewline
Residual Standard Deviation & 33.1866911666143 \tabularnewline
Sum Squared Residuals & 74892.24 \tabularnewline
\hline
\end{tabular}
%Source: https://freestatistics.org/blog/index.php?pk=25409&T=3

[TABLE]
[ROW][C]Multiple Linear Regression - Regression Statistics[/C][/ROW]
[ROW][C]Multiple R[/C][C]0.58636069678184[/C][/ROW]
[ROW][C]R-squared[/C][C]0.343818866730485[/C][/ROW]
[ROW][C]Adjusted R-squared[/C][C]0.334169144182404[/C][/ROW]
[ROW][C]F-TEST (value)[/C][C]35.6299225202962[/C][/ROW]
[ROW][C]F-TEST (DF numerator)[/C][C]1[/C][/ROW]
[ROW][C]F-TEST (DF denominator)[/C][C]68[/C][/ROW]
[ROW][C]p-value[/C][C]9.62911737012462e-08[/C][/ROW]
[ROW][C]Multiple Linear Regression - Residual Statistics[/C][/ROW]
[ROW][C]Residual Standard Deviation[/C][C]33.1866911666143[/C][/ROW]
[ROW][C]Sum Squared Residuals[/C][C]74892.24[/C][/ROW]
[/TABLE]
Source: https://freestatistics.org/blog/index.php?pk=25409&T=3

Globally Unique Identifier (entire table): ba.freestatistics.org/blog/index.php?pk=25409&T=3

As an alternative you can also use a QR Code:  

The GUIDs for individual cells are displayed in the table below:

Multiple Linear Regression - Regression Statistics
Multiple R0.58636069678184
R-squared0.343818866730485
Adjusted R-squared0.334169144182404
F-TEST (value)35.6299225202962
F-TEST (DF numerator)1
F-TEST (DF denominator)68
p-value9.62911737012462e-08
Multiple Linear Regression - Residual Statistics
Residual Standard Deviation33.1866911666143
Sum Squared Residuals74892.24


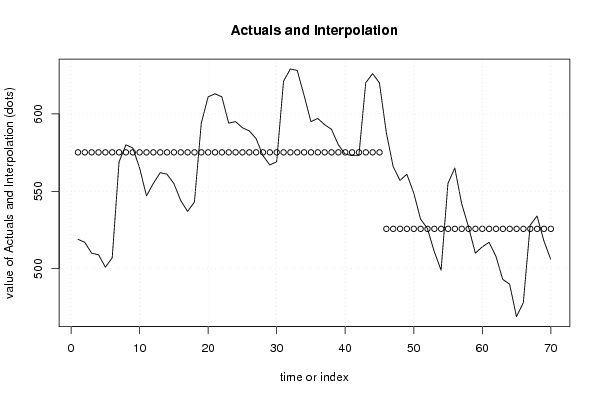
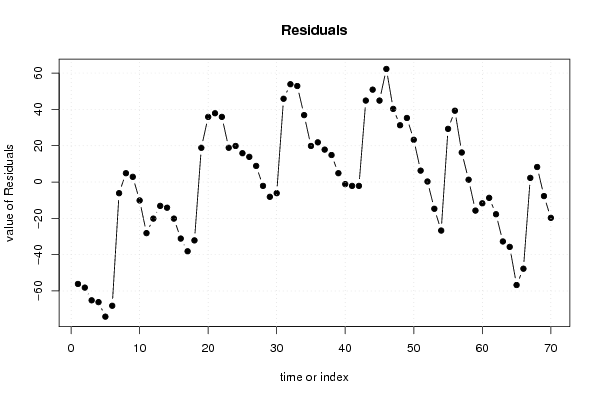
Multiple Linear Regression - Actuals, Interpolation, and Residuals
Time or IndexActualsInterpolationForecastResidualsPrediction Error
1519575.133333333333-56.1333333333329
2517575.133333333333-58.1333333333333
3510575.133333333333-65.1333333333333
4509575.133333333333-66.1333333333333
5501575.133333333333-74.1333333333334
6507575.133333333333-68.1333333333333
7569575.133333333333-6.13333333333334
8580575.1333333333334.86666666666666
9578575.1333333333332.86666666666666
10565575.133333333333-10.1333333333333
11547575.133333333333-28.1333333333333
12555575.133333333333-20.1333333333333
13562575.133333333333-13.1333333333333
14561575.133333333333-14.1333333333333
15555575.133333333333-20.1333333333333
16544575.133333333333-31.1333333333333
17537575.133333333333-38.1333333333333
18543575.133333333333-32.1333333333333
19594575.13333333333318.8666666666667
20611575.13333333333335.8666666666667
21613575.13333333333337.8666666666667
22611575.13333333333335.8666666666667
23594575.13333333333318.8666666666667
24595575.13333333333319.8666666666667
25591575.13333333333315.8666666666667
26589575.13333333333313.8666666666667
27584575.1333333333338.86666666666666
28573575.133333333333-2.13333333333334
29567575.133333333333-8.13333333333334
30569575.133333333333-6.13333333333334
31621575.13333333333345.8666666666667
32629575.13333333333353.8666666666667
33628575.13333333333352.8666666666667
34612575.13333333333336.8666666666667
35595575.13333333333319.8666666666667
36597575.13333333333321.8666666666667
37593575.13333333333317.8666666666667
38590575.13333333333314.8666666666667
39580575.1333333333334.86666666666666
40574575.133333333333-1.13333333333334
41573575.133333333333-2.13333333333334
42573575.133333333333-2.13333333333334
43620575.13333333333344.8666666666667
44626575.13333333333350.8666666666667
45620575.13333333333344.8666666666667
46588525.7262.28
47566525.7240.28
48557525.7231.28
49561525.7235.28
50549525.7223.28
51532525.726.28
52526525.720.280000000000006
53511525.72-14.72
54499525.72-26.72
55555525.7229.28
56565525.7239.28
57542525.7216.28
58527525.721.28000000000001
59510525.72-15.72
60514525.72-11.72
61517525.72-8.72
62508525.72-17.72
63493525.72-32.72
64490525.72-35.72
65469525.72-56.72
66478525.72-47.72
67528525.722.28000000000001
68534525.728.28
69518525.72-7.72
70506525.72-19.72

\begin{tabular}{lllllllll}
\hline
Multiple Linear Regression - Actuals, Interpolation, and Residuals \tabularnewline
Time or Index & Actuals & InterpolationForecast & ResidualsPrediction Error \tabularnewline
1 & 519 & 575.133333333333 & -56.1333333333329 \tabularnewline
2 & 517 & 575.133333333333 & -58.1333333333333 \tabularnewline
3 & 510 & 575.133333333333 & -65.1333333333333 \tabularnewline
4 & 509 & 575.133333333333 & -66.1333333333333 \tabularnewline
5 & 501 & 575.133333333333 & -74.1333333333334 \tabularnewline
6 & 507 & 575.133333333333 & -68.1333333333333 \tabularnewline
7 & 569 & 575.133333333333 & -6.13333333333334 \tabularnewline
8 & 580 & 575.133333333333 & 4.86666666666666 \tabularnewline
9 & 578 & 575.133333333333 & 2.86666666666666 \tabularnewline
10 & 565 & 575.133333333333 & -10.1333333333333 \tabularnewline
11 & 547 & 575.133333333333 & -28.1333333333333 \tabularnewline
12 & 555 & 575.133333333333 & -20.1333333333333 \tabularnewline
13 & 562 & 575.133333333333 & -13.1333333333333 \tabularnewline
14 & 561 & 575.133333333333 & -14.1333333333333 \tabularnewline
15 & 555 & 575.133333333333 & -20.1333333333333 \tabularnewline
16 & 544 & 575.133333333333 & -31.1333333333333 \tabularnewline
17 & 537 & 575.133333333333 & -38.1333333333333 \tabularnewline
18 & 543 & 575.133333333333 & -32.1333333333333 \tabularnewline
19 & 594 & 575.133333333333 & 18.8666666666667 \tabularnewline
20 & 611 & 575.133333333333 & 35.8666666666667 \tabularnewline
21 & 613 & 575.133333333333 & 37.8666666666667 \tabularnewline
22 & 611 & 575.133333333333 & 35.8666666666667 \tabularnewline
23 & 594 & 575.133333333333 & 18.8666666666667 \tabularnewline
24 & 595 & 575.133333333333 & 19.8666666666667 \tabularnewline
25 & 591 & 575.133333333333 & 15.8666666666667 \tabularnewline
26 & 589 & 575.133333333333 & 13.8666666666667 \tabularnewline
27 & 584 & 575.133333333333 & 8.86666666666666 \tabularnewline
28 & 573 & 575.133333333333 & -2.13333333333334 \tabularnewline
29 & 567 & 575.133333333333 & -8.13333333333334 \tabularnewline
30 & 569 & 575.133333333333 & -6.13333333333334 \tabularnewline
31 & 621 & 575.133333333333 & 45.8666666666667 \tabularnewline
32 & 629 & 575.133333333333 & 53.8666666666667 \tabularnewline
33 & 628 & 575.133333333333 & 52.8666666666667 \tabularnewline
34 & 612 & 575.133333333333 & 36.8666666666667 \tabularnewline
35 & 595 & 575.133333333333 & 19.8666666666667 \tabularnewline
36 & 597 & 575.133333333333 & 21.8666666666667 \tabularnewline
37 & 593 & 575.133333333333 & 17.8666666666667 \tabularnewline
38 & 590 & 575.133333333333 & 14.8666666666667 \tabularnewline
39 & 580 & 575.133333333333 & 4.86666666666666 \tabularnewline
40 & 574 & 575.133333333333 & -1.13333333333334 \tabularnewline
41 & 573 & 575.133333333333 & -2.13333333333334 \tabularnewline
42 & 573 & 575.133333333333 & -2.13333333333334 \tabularnewline
43 & 620 & 575.133333333333 & 44.8666666666667 \tabularnewline
44 & 626 & 575.133333333333 & 50.8666666666667 \tabularnewline
45 & 620 & 575.133333333333 & 44.8666666666667 \tabularnewline
46 & 588 & 525.72 & 62.28 \tabularnewline
47 & 566 & 525.72 & 40.28 \tabularnewline
48 & 557 & 525.72 & 31.28 \tabularnewline
49 & 561 & 525.72 & 35.28 \tabularnewline
50 & 549 & 525.72 & 23.28 \tabularnewline
51 & 532 & 525.72 & 6.28 \tabularnewline
52 & 526 & 525.72 & 0.280000000000006 \tabularnewline
53 & 511 & 525.72 & -14.72 \tabularnewline
54 & 499 & 525.72 & -26.72 \tabularnewline
55 & 555 & 525.72 & 29.28 \tabularnewline
56 & 565 & 525.72 & 39.28 \tabularnewline
57 & 542 & 525.72 & 16.28 \tabularnewline
58 & 527 & 525.72 & 1.28000000000001 \tabularnewline
59 & 510 & 525.72 & -15.72 \tabularnewline
60 & 514 & 525.72 & -11.72 \tabularnewline
61 & 517 & 525.72 & -8.72 \tabularnewline
62 & 508 & 525.72 & -17.72 \tabularnewline
63 & 493 & 525.72 & -32.72 \tabularnewline
64 & 490 & 525.72 & -35.72 \tabularnewline
65 & 469 & 525.72 & -56.72 \tabularnewline
66 & 478 & 525.72 & -47.72 \tabularnewline
67 & 528 & 525.72 & 2.28000000000001 \tabularnewline
68 & 534 & 525.72 & 8.28 \tabularnewline
69 & 518 & 525.72 & -7.72 \tabularnewline
70 & 506 & 525.72 & -19.72 \tabularnewline
\hline
\end{tabular}
%Source: https://freestatistics.org/blog/index.php?pk=25409&T=4

[TABLE]
[ROW][C]Multiple Linear Regression - Actuals, Interpolation, and Residuals[/C][/ROW]
[ROW][C]Time or Index[/C][C]Actuals[/C][C]InterpolationForecast[/C][C]ResidualsPrediction Error[/C][/ROW]
[ROW][C]1[/C][C]519[/C][C]575.133333333333[/C][C]-56.1333333333329[/C][/ROW]
[ROW][C]2[/C][C]517[/C][C]575.133333333333[/C][C]-58.1333333333333[/C][/ROW]
[ROW][C]3[/C][C]510[/C][C]575.133333333333[/C][C]-65.1333333333333[/C][/ROW]
[ROW][C]4[/C][C]509[/C][C]575.133333333333[/C][C]-66.1333333333333[/C][/ROW]
[ROW][C]5[/C][C]501[/C][C]575.133333333333[/C][C]-74.1333333333334[/C][/ROW]
[ROW][C]6[/C][C]507[/C][C]575.133333333333[/C][C]-68.1333333333333[/C][/ROW]
[ROW][C]7[/C][C]569[/C][C]575.133333333333[/C][C]-6.13333333333334[/C][/ROW]
[ROW][C]8[/C][C]580[/C][C]575.133333333333[/C][C]4.86666666666666[/C][/ROW]
[ROW][C]9[/C][C]578[/C][C]575.133333333333[/C][C]2.86666666666666[/C][/ROW]
[ROW][C]10[/C][C]565[/C][C]575.133333333333[/C][C]-10.1333333333333[/C][/ROW]
[ROW][C]11[/C][C]547[/C][C]575.133333333333[/C][C]-28.1333333333333[/C][/ROW]
[ROW][C]12[/C][C]555[/C][C]575.133333333333[/C][C]-20.1333333333333[/C][/ROW]
[ROW][C]13[/C][C]562[/C][C]575.133333333333[/C][C]-13.1333333333333[/C][/ROW]
[ROW][C]14[/C][C]561[/C][C]575.133333333333[/C][C]-14.1333333333333[/C][/ROW]
[ROW][C]15[/C][C]555[/C][C]575.133333333333[/C][C]-20.1333333333333[/C][/ROW]
[ROW][C]16[/C][C]544[/C][C]575.133333333333[/C][C]-31.1333333333333[/C][/ROW]
[ROW][C]17[/C][C]537[/C][C]575.133333333333[/C][C]-38.1333333333333[/C][/ROW]
[ROW][C]18[/C][C]543[/C][C]575.133333333333[/C][C]-32.1333333333333[/C][/ROW]
[ROW][C]19[/C][C]594[/C][C]575.133333333333[/C][C]18.8666666666667[/C][/ROW]
[ROW][C]20[/C][C]611[/C][C]575.133333333333[/C][C]35.8666666666667[/C][/ROW]
[ROW][C]21[/C][C]613[/C][C]575.133333333333[/C][C]37.8666666666667[/C][/ROW]
[ROW][C]22[/C][C]611[/C][C]575.133333333333[/C][C]35.8666666666667[/C][/ROW]
[ROW][C]23[/C][C]594[/C][C]575.133333333333[/C][C]18.8666666666667[/C][/ROW]
[ROW][C]24[/C][C]595[/C][C]575.133333333333[/C][C]19.8666666666667[/C][/ROW]
[ROW][C]25[/C][C]591[/C][C]575.133333333333[/C][C]15.8666666666667[/C][/ROW]
[ROW][C]26[/C][C]589[/C][C]575.133333333333[/C][C]13.8666666666667[/C][/ROW]
[ROW][C]27[/C][C]584[/C][C]575.133333333333[/C][C]8.86666666666666[/C][/ROW]
[ROW][C]28[/C][C]573[/C][C]575.133333333333[/C][C]-2.13333333333334[/C][/ROW]
[ROW][C]29[/C][C]567[/C][C]575.133333333333[/C][C]-8.13333333333334[/C][/ROW]
[ROW][C]30[/C][C]569[/C][C]575.133333333333[/C][C]-6.13333333333334[/C][/ROW]
[ROW][C]31[/C][C]621[/C][C]575.133333333333[/C][C]45.8666666666667[/C][/ROW]
[ROW][C]32[/C][C]629[/C][C]575.133333333333[/C][C]53.8666666666667[/C][/ROW]
[ROW][C]33[/C][C]628[/C][C]575.133333333333[/C][C]52.8666666666667[/C][/ROW]
[ROW][C]34[/C][C]612[/C][C]575.133333333333[/C][C]36.8666666666667[/C][/ROW]
[ROW][C]35[/C][C]595[/C][C]575.133333333333[/C][C]19.8666666666667[/C][/ROW]
[ROW][C]36[/C][C]597[/C][C]575.133333333333[/C][C]21.8666666666667[/C][/ROW]
[ROW][C]37[/C][C]593[/C][C]575.133333333333[/C][C]17.8666666666667[/C][/ROW]
[ROW][C]38[/C][C]590[/C][C]575.133333333333[/C][C]14.8666666666667[/C][/ROW]
[ROW][C]39[/C][C]580[/C][C]575.133333333333[/C][C]4.86666666666666[/C][/ROW]
[ROW][C]40[/C][C]574[/C][C]575.133333333333[/C][C]-1.13333333333334[/C][/ROW]
[ROW][C]41[/C][C]573[/C][C]575.133333333333[/C][C]-2.13333333333334[/C][/ROW]
[ROW][C]42[/C][C]573[/C][C]575.133333333333[/C][C]-2.13333333333334[/C][/ROW]
[ROW][C]43[/C][C]620[/C][C]575.133333333333[/C][C]44.8666666666667[/C][/ROW]
[ROW][C]44[/C][C]626[/C][C]575.133333333333[/C][C]50.8666666666667[/C][/ROW]
[ROW][C]45[/C][C]620[/C][C]575.133333333333[/C][C]44.8666666666667[/C][/ROW]
[ROW][C]46[/C][C]588[/C][C]525.72[/C][C]62.28[/C][/ROW]
[ROW][C]47[/C][C]566[/C][C]525.72[/C][C]40.28[/C][/ROW]
[ROW][C]48[/C][C]557[/C][C]525.72[/C][C]31.28[/C][/ROW]
[ROW][C]49[/C][C]561[/C][C]525.72[/C][C]35.28[/C][/ROW]
[ROW][C]50[/C][C]549[/C][C]525.72[/C][C]23.28[/C][/ROW]
[ROW][C]51[/C][C]532[/C][C]525.72[/C][C]6.28[/C][/ROW]
[ROW][C]52[/C][C]526[/C][C]525.72[/C][C]0.280000000000006[/C][/ROW]
[ROW][C]53[/C][C]511[/C][C]525.72[/C][C]-14.72[/C][/ROW]
[ROW][C]54[/C][C]499[/C][C]525.72[/C][C]-26.72[/C][/ROW]
[ROW][C]55[/C][C]555[/C][C]525.72[/C][C]29.28[/C][/ROW]
[ROW][C]56[/C][C]565[/C][C]525.72[/C][C]39.28[/C][/ROW]
[ROW][C]57[/C][C]542[/C][C]525.72[/C][C]16.28[/C][/ROW]
[ROW][C]58[/C][C]527[/C][C]525.72[/C][C]1.28000000000001[/C][/ROW]
[ROW][C]59[/C][C]510[/C][C]525.72[/C][C]-15.72[/C][/ROW]
[ROW][C]60[/C][C]514[/C][C]525.72[/C][C]-11.72[/C][/ROW]
[ROW][C]61[/C][C]517[/C][C]525.72[/C][C]-8.72[/C][/ROW]
[ROW][C]62[/C][C]508[/C][C]525.72[/C][C]-17.72[/C][/ROW]
[ROW][C]63[/C][C]493[/C][C]525.72[/C][C]-32.72[/C][/ROW]
[ROW][C]64[/C][C]490[/C][C]525.72[/C][C]-35.72[/C][/ROW]
[ROW][C]65[/C][C]469[/C][C]525.72[/C][C]-56.72[/C][/ROW]
[ROW][C]66[/C][C]478[/C][C]525.72[/C][C]-47.72[/C][/ROW]
[ROW][C]67[/C][C]528[/C][C]525.72[/C][C]2.28000000000001[/C][/ROW]
[ROW][C]68[/C][C]534[/C][C]525.72[/C][C]8.28[/C][/ROW]
[ROW][C]69[/C][C]518[/C][C]525.72[/C][C]-7.72[/C][/ROW]
[ROW][C]70[/C][C]506[/C][C]525.72[/C][C]-19.72[/C][/ROW]
[/TABLE]
Source: https://freestatistics.org/blog/index.php?pk=25409&T=4

Globally Unique Identifier (entire table): ba.freestatistics.org/blog/index.php?pk=25409&T=4

As an alternative you can also use a QR Code:  

The GUIDs for individual cells are displayed in the table below:

Multiple Linear Regression - Actuals, Interpolation, and Residuals
Time or IndexActualsInterpolationForecastResidualsPrediction Error
1519575.133333333333-56.1333333333329
2517575.133333333333-58.1333333333333
3510575.133333333333-65.1333333333333
4509575.133333333333-66.1333333333333
5501575.133333333333-74.1333333333334
6507575.133333333333-68.1333333333333
7569575.133333333333-6.13333333333334
8580575.1333333333334.86666666666666
9578575.1333333333332.86666666666666
10565575.133333333333-10.1333333333333
11547575.133333333333-28.1333333333333
12555575.133333333333-20.1333333333333
13562575.133333333333-13.1333333333333
14561575.133333333333-14.1333333333333
15555575.133333333333-20.1333333333333
16544575.133333333333-31.1333333333333
17537575.133333333333-38.1333333333333
18543575.133333333333-32.1333333333333
19594575.13333333333318.8666666666667
20611575.13333333333335.8666666666667
21613575.13333333333337.8666666666667
22611575.13333333333335.8666666666667
23594575.13333333333318.8666666666667
24595575.13333333333319.8666666666667
25591575.13333333333315.8666666666667
26589575.13333333333313.8666666666667
27584575.1333333333338.86666666666666
28573575.133333333333-2.13333333333334
29567575.133333333333-8.13333333333334
30569575.133333333333-6.13333333333334
31621575.13333333333345.8666666666667
32629575.13333333333353.8666666666667
33628575.13333333333352.8666666666667
34612575.13333333333336.8666666666667
35595575.13333333333319.8666666666667
36597575.13333333333321.8666666666667
37593575.13333333333317.8666666666667
38590575.13333333333314.8666666666667
39580575.1333333333334.86666666666666
40574575.133333333333-1.13333333333334
41573575.133333333333-2.13333333333334
42573575.133333333333-2.13333333333334
43620575.13333333333344.8666666666667
44626575.13333333333350.8666666666667
45620575.13333333333344.8666666666667
46588525.7262.28
47566525.7240.28
48557525.7231.28
49561525.7235.28
50549525.7223.28
51532525.726.28
52526525.720.280000000000006
53511525.72-14.72
54499525.72-26.72
55555525.7229.28
56565525.7239.28
57542525.7216.28
58527525.721.28000000000001
59510525.72-15.72
60514525.72-11.72
61517525.72-8.72
62508525.72-17.72
63493525.72-32.72
64490525.72-35.72
65469525.72-56.72
66478525.72-47.72
67528525.722.28000000000001
68534525.728.28
69518525.72-7.72
70506525.72-19.72


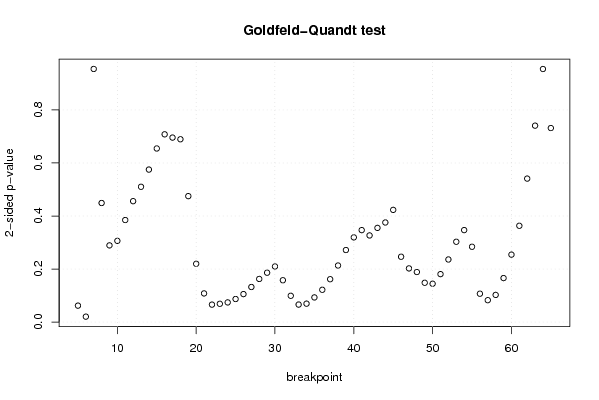
Goldfeld-Quandt test for Heteroskedasticity
p-valuesAlternative Hypothesis
breakpoint indexgreater2-sidedless
50.03104549397540520.06209098795081050.968954506024595
60.01028206599487180.02056413198974360.989717934005128
70.4771933875057540.9543867750115080.522806612494246
80.7754902748176970.4490194503646070.224509725182303
90.8553406522132990.2893186955734020.144659347786701
100.8468351600630370.3063296798739250.153164839936963
110.8076337623402660.3847324753194670.192366237659734
120.7720412080443130.4559175839113740.227958791955687
130.7449483313492440.5101033373015120.255051668650756
140.7124782142805230.5750435714389540.287521785719477
150.6727248611036760.6545502777926470.327275138896324
160.6460378820842270.7079242358315460.353962117915773
170.6521678895890370.6956642208219250.347832110410963
180.6553471479876420.6893057040247150.344652852012358
190.7625509010278770.4748981979442450.237449098972123
200.8900896161693350.2198207676613310.109910383830665
210.9459095317355590.1081809365288830.0540904682644414
220.9670464660343280.06590706793134470.0329535339656724
230.9654706929093260.0690586141813490.0345293070906745
240.96287171664560.07425656670880070.0371282833544004
250.9564662256272920.08706754874541650.0435337743727082
260.9471983696015620.1056032607968760.0528016303984379
270.933823662336930.1323526753261420.0661763376630708
280.9186546174971830.1626907650056340.081345382502817
290.9068941120344490.1862117759311030.0931058879655514
300.8951093451925230.2097813096149540.104890654807477
310.9210875061035880.1578249877928250.0789124938964123
320.9504173954224140.09916520915517220.0495826045775861
330.9669362953044020.06612740939119630.0330637046955981
340.965257341062280.06948531787543960.0347426589377198
350.9534624012432490.09307519751350230.0465375987567511
360.9390912372615230.1218175254769530.0609087627384766
370.919150766954590.1616984660908180.080849233045409
380.8933125276226160.2133749447547670.106687472377384
390.8641424093320880.2717151813358240.135857590667912
400.8402614669152670.3194770661694660.159738533084733
410.8266003019481040.3467993961037910.173399698051896
420.8366286676549430.3267426646901140.163371332345057
430.8223869673402570.3552260653194860.177613032659743
440.8122302523311980.3755394953376040.187769747668802
450.7884389723476370.4231220553047250.211561027652363
460.8767951701516820.2464096596966360.123204829848318
470.8987601143356720.2024797713286560.101239885664328
480.905596709345190.1888065813096210.0944032906548103
490.9258747427114620.1482505145770760.074125257288538
500.9276439774073080.1447120451853840.0723560225926921
510.9095556738425180.1808886523149650.0904443261574824
520.8819470604472290.2361058791055420.118052939552771
530.8485577002198180.3028845995603630.151442299780182
540.8265308950020950.346938209995810.173469104997905
550.857971801245970.2840563975080610.142028198754030
560.9464793331208750.1070413337582500.0535206668791252
570.9586644401056970.08267111978860620.0413355598943031
580.9487340837506280.1025318324987430.0512659162493715
590.916993383282850.1660132334343020.0830066167171508
600.8728224595580410.2543550808839180.127177540441959
610.8184027951706270.3631944096587460.181597204829373
620.7294906489456150.541018702108770.270509351054385
630.6296827778360750.7406344443278490.370317222163925
640.5228972229992640.9542055540014730.477102777000736
650.6342200032902750.731559993419450.365779996709725

\begin{tabular}{lllllllll}
\hline
Goldfeld-Quandt test for Heteroskedasticity \tabularnewline
p-values & Alternative Hypothesis \tabularnewline
breakpoint index & greater & 2-sided & less \tabularnewline
5 & 0.0310454939754052 & 0.0620909879508105 & 0.968954506024595 \tabularnewline
6 & 0.0102820659948718 & 0.0205641319897436 & 0.989717934005128 \tabularnewline
7 & 0.477193387505754 & 0.954386775011508 & 0.522806612494246 \tabularnewline
8 & 0.775490274817697 & 0.449019450364607 & 0.224509725182303 \tabularnewline
9 & 0.855340652213299 & 0.289318695573402 & 0.144659347786701 \tabularnewline
10 & 0.846835160063037 & 0.306329679873925 & 0.153164839936963 \tabularnewline
11 & 0.807633762340266 & 0.384732475319467 & 0.192366237659734 \tabularnewline
12 & 0.772041208044313 & 0.455917583911374 & 0.227958791955687 \tabularnewline
13 & 0.744948331349244 & 0.510103337301512 & 0.255051668650756 \tabularnewline
14 & 0.712478214280523 & 0.575043571438954 & 0.287521785719477 \tabularnewline
15 & 0.672724861103676 & 0.654550277792647 & 0.327275138896324 \tabularnewline
16 & 0.646037882084227 & 0.707924235831546 & 0.353962117915773 \tabularnewline
17 & 0.652167889589037 & 0.695664220821925 & 0.347832110410963 \tabularnewline
18 & 0.655347147987642 & 0.689305704024715 & 0.344652852012358 \tabularnewline
19 & 0.762550901027877 & 0.474898197944245 & 0.237449098972123 \tabularnewline
20 & 0.890089616169335 & 0.219820767661331 & 0.109910383830665 \tabularnewline
21 & 0.945909531735559 & 0.108180936528883 & 0.0540904682644414 \tabularnewline
22 & 0.967046466034328 & 0.0659070679313447 & 0.0329535339656724 \tabularnewline
23 & 0.965470692909326 & 0.069058614181349 & 0.0345293070906745 \tabularnewline
24 & 0.9628717166456 & 0.0742565667088007 & 0.0371282833544004 \tabularnewline
25 & 0.956466225627292 & 0.0870675487454165 & 0.0435337743727082 \tabularnewline
26 & 0.947198369601562 & 0.105603260796876 & 0.0528016303984379 \tabularnewline
27 & 0.93382366233693 & 0.132352675326142 & 0.0661763376630708 \tabularnewline
28 & 0.918654617497183 & 0.162690765005634 & 0.081345382502817 \tabularnewline
29 & 0.906894112034449 & 0.186211775931103 & 0.0931058879655514 \tabularnewline
30 & 0.895109345192523 & 0.209781309614954 & 0.104890654807477 \tabularnewline
31 & 0.921087506103588 & 0.157824987792825 & 0.0789124938964123 \tabularnewline
32 & 0.950417395422414 & 0.0991652091551722 & 0.0495826045775861 \tabularnewline
33 & 0.966936295304402 & 0.0661274093911963 & 0.0330637046955981 \tabularnewline
34 & 0.96525734106228 & 0.0694853178754396 & 0.0347426589377198 \tabularnewline
35 & 0.953462401243249 & 0.0930751975135023 & 0.0465375987567511 \tabularnewline
36 & 0.939091237261523 & 0.121817525476953 & 0.0609087627384766 \tabularnewline
37 & 0.91915076695459 & 0.161698466090818 & 0.080849233045409 \tabularnewline
38 & 0.893312527622616 & 0.213374944754767 & 0.106687472377384 \tabularnewline
39 & 0.864142409332088 & 0.271715181335824 & 0.135857590667912 \tabularnewline
40 & 0.840261466915267 & 0.319477066169466 & 0.159738533084733 \tabularnewline
41 & 0.826600301948104 & 0.346799396103791 & 0.173399698051896 \tabularnewline
42 & 0.836628667654943 & 0.326742664690114 & 0.163371332345057 \tabularnewline
43 & 0.822386967340257 & 0.355226065319486 & 0.177613032659743 \tabularnewline
44 & 0.812230252331198 & 0.375539495337604 & 0.187769747668802 \tabularnewline
45 & 0.788438972347637 & 0.423122055304725 & 0.211561027652363 \tabularnewline
46 & 0.876795170151682 & 0.246409659696636 & 0.123204829848318 \tabularnewline
47 & 0.898760114335672 & 0.202479771328656 & 0.101239885664328 \tabularnewline
48 & 0.90559670934519 & 0.188806581309621 & 0.0944032906548103 \tabularnewline
49 & 0.925874742711462 & 0.148250514577076 & 0.074125257288538 \tabularnewline
50 & 0.927643977407308 & 0.144712045185384 & 0.0723560225926921 \tabularnewline
51 & 0.909555673842518 & 0.180888652314965 & 0.0904443261574824 \tabularnewline
52 & 0.881947060447229 & 0.236105879105542 & 0.118052939552771 \tabularnewline
53 & 0.848557700219818 & 0.302884599560363 & 0.151442299780182 \tabularnewline
54 & 0.826530895002095 & 0.34693820999581 & 0.173469104997905 \tabularnewline
55 & 0.85797180124597 & 0.284056397508061 & 0.142028198754030 \tabularnewline
56 & 0.946479333120875 & 0.107041333758250 & 0.0535206668791252 \tabularnewline
57 & 0.958664440105697 & 0.0826711197886062 & 0.0413355598943031 \tabularnewline
58 & 0.948734083750628 & 0.102531832498743 & 0.0512659162493715 \tabularnewline
59 & 0.91699338328285 & 0.166013233434302 & 0.0830066167171508 \tabularnewline
60 & 0.872822459558041 & 0.254355080883918 & 0.127177540441959 \tabularnewline
61 & 0.818402795170627 & 0.363194409658746 & 0.181597204829373 \tabularnewline
62 & 0.729490648945615 & 0.54101870210877 & 0.270509351054385 \tabularnewline
63 & 0.629682777836075 & 0.740634444327849 & 0.370317222163925 \tabularnewline
64 & 0.522897222999264 & 0.954205554001473 & 0.477102777000736 \tabularnewline
65 & 0.634220003290275 & 0.73155999341945 & 0.365779996709725 \tabularnewline
\hline
\end{tabular}
%Source: https://freestatistics.org/blog/index.php?pk=25409&T=5

[TABLE]
[ROW][C]Goldfeld-Quandt test for Heteroskedasticity[/C][/ROW]
[ROW][C]p-values[/C][C]Alternative Hypothesis[/C][/ROW]
[ROW][C]breakpoint index[/C][C]greater[/C][C]2-sided[/C][C]less[/C][/ROW]
[ROW][C]5[/C][C]0.0310454939754052[/C][C]0.0620909879508105[/C][C]0.968954506024595[/C][/ROW]
[ROW][C]6[/C][C]0.0102820659948718[/C][C]0.0205641319897436[/C][C]0.989717934005128[/C][/ROW]
[ROW][C]7[/C][C]0.477193387505754[/C][C]0.954386775011508[/C][C]0.522806612494246[/C][/ROW]
[ROW][C]8[/C][C]0.775490274817697[/C][C]0.449019450364607[/C][C]0.224509725182303[/C][/ROW]
[ROW][C]9[/C][C]0.855340652213299[/C][C]0.289318695573402[/C][C]0.144659347786701[/C][/ROW]
[ROW][C]10[/C][C]0.846835160063037[/C][C]0.306329679873925[/C][C]0.153164839936963[/C][/ROW]
[ROW][C]11[/C][C]0.807633762340266[/C][C]0.384732475319467[/C][C]0.192366237659734[/C][/ROW]
[ROW][C]12[/C][C]0.772041208044313[/C][C]0.455917583911374[/C][C]0.227958791955687[/C][/ROW]
[ROW][C]13[/C][C]0.744948331349244[/C][C]0.510103337301512[/C][C]0.255051668650756[/C][/ROW]
[ROW][C]14[/C][C]0.712478214280523[/C][C]0.575043571438954[/C][C]0.287521785719477[/C][/ROW]
[ROW][C]15[/C][C]0.672724861103676[/C][C]0.654550277792647[/C][C]0.327275138896324[/C][/ROW]
[ROW][C]16[/C][C]0.646037882084227[/C][C]0.707924235831546[/C][C]0.353962117915773[/C][/ROW]
[ROW][C]17[/C][C]0.652167889589037[/C][C]0.695664220821925[/C][C]0.347832110410963[/C][/ROW]
[ROW][C]18[/C][C]0.655347147987642[/C][C]0.689305704024715[/C][C]0.344652852012358[/C][/ROW]
[ROW][C]19[/C][C]0.762550901027877[/C][C]0.474898197944245[/C][C]0.237449098972123[/C][/ROW]
[ROW][C]20[/C][C]0.890089616169335[/C][C]0.219820767661331[/C][C]0.109910383830665[/C][/ROW]
[ROW][C]21[/C][C]0.945909531735559[/C][C]0.108180936528883[/C][C]0.0540904682644414[/C][/ROW]
[ROW][C]22[/C][C]0.967046466034328[/C][C]0.0659070679313447[/C][C]0.0329535339656724[/C][/ROW]
[ROW][C]23[/C][C]0.965470692909326[/C][C]0.069058614181349[/C][C]0.0345293070906745[/C][/ROW]
[ROW][C]24[/C][C]0.9628717166456[/C][C]0.0742565667088007[/C][C]0.0371282833544004[/C][/ROW]
[ROW][C]25[/C][C]0.956466225627292[/C][C]0.0870675487454165[/C][C]0.0435337743727082[/C][/ROW]
[ROW][C]26[/C][C]0.947198369601562[/C][C]0.105603260796876[/C][C]0.0528016303984379[/C][/ROW]
[ROW][C]27[/C][C]0.93382366233693[/C][C]0.132352675326142[/C][C]0.0661763376630708[/C][/ROW]
[ROW][C]28[/C][C]0.918654617497183[/C][C]0.162690765005634[/C][C]0.081345382502817[/C][/ROW]
[ROW][C]29[/C][C]0.906894112034449[/C][C]0.186211775931103[/C][C]0.0931058879655514[/C][/ROW]
[ROW][C]30[/C][C]0.895109345192523[/C][C]0.209781309614954[/C][C]0.104890654807477[/C][/ROW]
[ROW][C]31[/C][C]0.921087506103588[/C][C]0.157824987792825[/C][C]0.0789124938964123[/C][/ROW]
[ROW][C]32[/C][C]0.950417395422414[/C][C]0.0991652091551722[/C][C]0.0495826045775861[/C][/ROW]
[ROW][C]33[/C][C]0.966936295304402[/C][C]0.0661274093911963[/C][C]0.0330637046955981[/C][/ROW]
[ROW][C]34[/C][C]0.96525734106228[/C][C]0.0694853178754396[/C][C]0.0347426589377198[/C][/ROW]
[ROW][C]35[/C][C]0.953462401243249[/C][C]0.0930751975135023[/C][C]0.0465375987567511[/C][/ROW]
[ROW][C]36[/C][C]0.939091237261523[/C][C]0.121817525476953[/C][C]0.0609087627384766[/C][/ROW]
[ROW][C]37[/C][C]0.91915076695459[/C][C]0.161698466090818[/C][C]0.080849233045409[/C][/ROW]
[ROW][C]38[/C][C]0.893312527622616[/C][C]0.213374944754767[/C][C]0.106687472377384[/C][/ROW]
[ROW][C]39[/C][C]0.864142409332088[/C][C]0.271715181335824[/C][C]0.135857590667912[/C][/ROW]
[ROW][C]40[/C][C]0.840261466915267[/C][C]0.319477066169466[/C][C]0.159738533084733[/C][/ROW]
[ROW][C]41[/C][C]0.826600301948104[/C][C]0.346799396103791[/C][C]0.173399698051896[/C][/ROW]
[ROW][C]42[/C][C]0.836628667654943[/C][C]0.326742664690114[/C][C]0.163371332345057[/C][/ROW]
[ROW][C]43[/C][C]0.822386967340257[/C][C]0.355226065319486[/C][C]0.177613032659743[/C][/ROW]
[ROW][C]44[/C][C]0.812230252331198[/C][C]0.375539495337604[/C][C]0.187769747668802[/C][/ROW]
[ROW][C]45[/C][C]0.788438972347637[/C][C]0.423122055304725[/C][C]0.211561027652363[/C][/ROW]
[ROW][C]46[/C][C]0.876795170151682[/C][C]0.246409659696636[/C][C]0.123204829848318[/C][/ROW]
[ROW][C]47[/C][C]0.898760114335672[/C][C]0.202479771328656[/C][C]0.101239885664328[/C][/ROW]
[ROW][C]48[/C][C]0.90559670934519[/C][C]0.188806581309621[/C][C]0.0944032906548103[/C][/ROW]
[ROW][C]49[/C][C]0.925874742711462[/C][C]0.148250514577076[/C][C]0.074125257288538[/C][/ROW]
[ROW][C]50[/C][C]0.927643977407308[/C][C]0.144712045185384[/C][C]0.0723560225926921[/C][/ROW]
[ROW][C]51[/C][C]0.909555673842518[/C][C]0.180888652314965[/C][C]0.0904443261574824[/C][/ROW]
[ROW][C]52[/C][C]0.881947060447229[/C][C]0.236105879105542[/C][C]0.118052939552771[/C][/ROW]
[ROW][C]53[/C][C]0.848557700219818[/C][C]0.302884599560363[/C][C]0.151442299780182[/C][/ROW]
[ROW][C]54[/C][C]0.826530895002095[/C][C]0.34693820999581[/C][C]0.173469104997905[/C][/ROW]
[ROW][C]55[/C][C]0.85797180124597[/C][C]0.284056397508061[/C][C]0.142028198754030[/C][/ROW]
[ROW][C]56[/C][C]0.946479333120875[/C][C]0.107041333758250[/C][C]0.0535206668791252[/C][/ROW]
[ROW][C]57[/C][C]0.958664440105697[/C][C]0.0826711197886062[/C][C]0.0413355598943031[/C][/ROW]
[ROW][C]58[/C][C]0.948734083750628[/C][C]0.102531832498743[/C][C]0.0512659162493715[/C][/ROW]
[ROW][C]59[/C][C]0.91699338328285[/C][C]0.166013233434302[/C][C]0.0830066167171508[/C][/ROW]
[ROW][C]60[/C][C]0.872822459558041[/C][C]0.254355080883918[/C][C]0.127177540441959[/C][/ROW]
[ROW][C]61[/C][C]0.818402795170627[/C][C]0.363194409658746[/C][C]0.181597204829373[/C][/ROW]
[ROW][C]62[/C][C]0.729490648945615[/C][C]0.54101870210877[/C][C]0.270509351054385[/C][/ROW]
[ROW][C]63[/C][C]0.629682777836075[/C][C]0.740634444327849[/C][C]0.370317222163925[/C][/ROW]
[ROW][C]64[/C][C]0.522897222999264[/C][C]0.954205554001473[/C][C]0.477102777000736[/C][/ROW]
[ROW][C]65[/C][C]0.634220003290275[/C][C]0.73155999341945[/C][C]0.365779996709725[/C][/ROW]
[/TABLE]
Source: https://freestatistics.org/blog/index.php?pk=25409&T=5

Globally Unique Identifier (entire table): ba.freestatistics.org/blog/index.php?pk=25409&T=5

As an alternative you can also use a QR Code:  

The GUIDs for individual cells are displayed in the table below:

Goldfeld-Quandt test for Heteroskedasticity
p-valuesAlternative Hypothesis
breakpoint indexgreater2-sidedless
50.03104549397540520.06209098795081050.968954506024595
60.01028206599487180.02056413198974360.989717934005128
70.4771933875057540.9543867750115080.522806612494246
80.7754902748176970.4490194503646070.224509725182303
90.8553406522132990.2893186955734020.144659347786701
100.8468351600630370.3063296798739250.153164839936963
110.8076337623402660.3847324753194670.192366237659734
120.7720412080443130.4559175839113740.227958791955687
130.7449483313492440.5101033373015120.255051668650756
140.7124782142805230.5750435714389540.287521785719477
150.6727248611036760.6545502777926470.327275138896324
160.6460378820842270.7079242358315460.353962117915773
170.6521678895890370.6956642208219250.347832110410963
180.6553471479876420.6893057040247150.344652852012358
190.7625509010278770.4748981979442450.237449098972123
200.8900896161693350.2198207676613310.109910383830665
210.9459095317355590.1081809365288830.0540904682644414
220.9670464660343280.06590706793134470.0329535339656724
230.9654706929093260.0690586141813490.0345293070906745
240.96287171664560.07425656670880070.0371282833544004
250.9564662256272920.08706754874541650.0435337743727082
260.9471983696015620.1056032607968760.0528016303984379
270.933823662336930.1323526753261420.0661763376630708
280.9186546174971830.1626907650056340.081345382502817
290.9068941120344490.1862117759311030.0931058879655514
300.8951093451925230.2097813096149540.104890654807477
310.9210875061035880.1578249877928250.0789124938964123
320.9504173954224140.09916520915517220.0495826045775861
330.9669362953044020.06612740939119630.0330637046955981
340.965257341062280.06948531787543960.0347426589377198
350.9534624012432490.09307519751350230.0465375987567511
360.9390912372615230.1218175254769530.0609087627384766
370.919150766954590.1616984660908180.080849233045409
380.8933125276226160.2133749447547670.106687472377384
390.8641424093320880.2717151813358240.135857590667912
400.8402614669152670.3194770661694660.159738533084733
410.8266003019481040.3467993961037910.173399698051896
420.8366286676549430.3267426646901140.163371332345057
430.8223869673402570.3552260653194860.177613032659743
440.8122302523311980.3755394953376040.187769747668802
450.7884389723476370.4231220553047250.211561027652363
460.8767951701516820.2464096596966360.123204829848318
470.8987601143356720.2024797713286560.101239885664328
480.905596709345190.1888065813096210.0944032906548103
490.9258747427114620.1482505145770760.074125257288538
500.9276439774073080.1447120451853840.0723560225926921
510.9095556738425180.1808886523149650.0904443261574824
520.8819470604472290.2361058791055420.118052939552771
530.8485577002198180.3028845995603630.151442299780182
540.8265308950020950.346938209995810.173469104997905
550.857971801245970.2840563975080610.142028198754030
560.9464793331208750.1070413337582500.0535206668791252
570.9586644401056970.08267111978860620.0413355598943031
580.9487340837506280.1025318324987430.0512659162493715
590.916993383282850.1660132334343020.0830066167171508
600.8728224595580410.2543550808839180.127177540441959
610.8184027951706270.3631944096587460.181597204829373
620.7294906489456150.541018702108770.270509351054385
630.6296827778360750.7406344443278490.370317222163925
640.5228972229992640.9542055540014730.477102777000736
650.6342200032902750.731559993419450.365779996709725


Meta Analysis of Goldfeld-Quandt test for Heteroskedasticity
Description# significant tests% significant testsOK/NOK
1% type I error level00OK
5% type I error level10.0163934426229508OK
10% type I error level110.180327868852459NOK

\begin{tabular}{lllllllll}
\hline
Meta Analysis of Goldfeld-Quandt test for Heteroskedasticity \tabularnewline
Description & # significant tests & % significant tests & OK/NOK \tabularnewline
1% type I error level & 0 & 0 & OK \tabularnewline
5% type I error level & 1 & 0.0163934426229508 & OK \tabularnewline
10% type I error level & 11 & 0.180327868852459 & NOK \tabularnewline
\hline
\end{tabular}
%Source: https://freestatistics.org/blog/index.php?pk=25409&T=6

[TABLE]
[ROW][C]Meta Analysis of Goldfeld-Quandt test for Heteroskedasticity[/C][/ROW]
[ROW][C]Description[/C][C]# significant tests[/C][C]% significant tests[/C][C]OK/NOK[/C][/ROW]
[ROW][C]1% type I error level[/C][C]0[/C][C]0[/C][C]OK[/C][/ROW]
[ROW][C]5% type I error level[/C][C]1[/C][C]0.0163934426229508[/C][C]OK[/C][/ROW]
[ROW][C]10% type I error level[/C][C]11[/C][C]0.180327868852459[/C][C]NOK[/C][/ROW]
[/TABLE]
Source: https://freestatistics.org/blog/index.php?pk=25409&T=6

Globally Unique Identifier (entire table): ba.freestatistics.org/blog/index.php?pk=25409&T=6

As an alternative you can also use a QR Code:  

The GUIDs for individual cells are displayed in the table below:

Meta Analysis of Goldfeld-Quandt test for Heteroskedasticity
Description# significant tests% significant testsOK/NOK
1% type I error level00OK
5% type I error level10.0163934426229508OK
10% type I error level110.180327868852459NOK


Parameters (Session):
par1 = 1 ; par2 = Do not include Seasonal Dummies ; par3 = No Linear Trend ;
Parameters (R input):
par1 = 1 ; par2 = Do not include Seasonal Dummies ; par3 = No Linear Trend ;
R code (references can be found in the software module):
library(lattice)
library(lmtest)
n25 <- 25 #minimum number of obs. for Goldfeld-Quandt test
par1 <- as.numeric(par1)
x <- t(y)
k <- length(x[1,])
n <- length(x[,1])
x1 <- cbind(x[,par1], x[,1:k!=par1])
mycolnames <- c(colnames(x)[par1], colnames(x)[1:k!=par1])
colnames(x1) <- mycolnames #colnames(x)[par1]
x <- x1
if (par3 == 'First Differences'){
x2 <- array(0, dim=c(n-1,k), dimnames=list(1:(n-1), paste('(1-B)',colnames(x),sep='')))
for (i in 1:n-1) {
for (j in 1:k) {
x2[i,j] <- x[i+1,j] - x[i,j]
}
}
x <- x2
}
if (par2 == 'Include Monthly Dummies'){
x2 <- array(0, dim=c(n,11), dimnames=list(1:n, paste('M', seq(1:11), sep ='')))
for (i in 1:11){
x2[seq(i,n,12),i] <- 1
}
x <- cbind(x, x2)
}
if (par2 == 'Include Quarterly Dummies'){
x2 <- array(0, dim=c(n,3), dimnames=list(1:n, paste('Q', seq(1:3), sep ='')))
for (i in 1:3){
x2[seq(i,n,4),i] <- 1
}
x <- cbind(x, x2)
}
k <- length(x[1,])
if (par3 == 'Linear Trend'){
x <- cbind(x, c(1:n))
colnames(x)[k+1] <- 't'
}
x
k <- length(x[1,])
df <- as.data.frame(x)
(mylm <- lm(df))
(mysum <- summary(mylm))
if (n > n25) {
kp3 <- k + 3
nmkm3 <- n - k - 3
gqarr <- array(NA, dim=c(nmkm3-kp3+1,3))
numgqtests <- 0
numsignificant1 <- 0
numsignificant5 <- 0
numsignificant10 <- 0
for (mypoint in kp3:nmkm3) {
j <- 0
numgqtests <- numgqtests + 1
for (myalt in c('greater', 'two.sided', 'less')) {
j <- j + 1
gqarr[mypoint-kp3+1,j] <- gqtest(mylm, point=mypoint, alternative=myalt)$p.value
}
if (gqarr[mypoint-kp3+1,2] < 0.01) numsignificant1 <- numsignificant1 + 1
if (gqarr[mypoint-kp3+1,2] < 0.05) numsignificant5 <- numsignificant5 + 1
if (gqarr[mypoint-kp3+1,2] < 0.10) numsignificant10 <- numsignificant10 + 1
}
gqarr
}
bitmap(file='test0.png')
plot(x[,1], type='l', main='Actuals and Interpolation', ylab='value of Actuals and Interpolation (dots)', xlab='time or index')
points(x[,1]-mysum$resid)
grid()
dev.off()
bitmap(file='test1.png')
plot(mysum$resid, type='b', pch=19, main='Residuals', ylab='value of Residuals', xlab='time or index')
grid()
dev.off()
bitmap(file='test2.png')
hist(mysum$resid, main='Residual Histogram', xlab='values of Residuals')
grid()
dev.off()
bitmap(file='test3.png')
densityplot(~mysum$resid,col='black',main='Residual Density Plot', xlab='values of Residuals')
dev.off()
bitmap(file='test4.png')
qqnorm(mysum$resid, main='Residual Normal Q-Q Plot')
qqline(mysum$resid)
grid()
dev.off()
(myerror <- as.ts(mysum$resid))
bitmap(file='test5.png')
dum <- cbind(lag(myerror,k=1),myerror)
dum
dum1 <- dum[2:length(myerror),]
dum1
z <- as.data.frame(dum1)
z
plot(z,main=paste('Residual Lag plot, lowess, and regression line'), ylab='values of Residuals', xlab='lagged values of Residuals')
lines(lowess(z))
abline(lm(z))
grid()
dev.off()
bitmap(file='test6.png')
acf(mysum$resid, lag.max=length(mysum$resid)/2, main='Residual Autocorrelation Function')
grid()
dev.off()
bitmap(file='test7.png')
pacf(mysum$resid, lag.max=length(mysum$resid)/2, main='Residual Partial Autocorrelation Function')
grid()
dev.off()
bitmap(file='test8.png')
opar <- par(mfrow = c(2,2), oma = c(0, 0, 1.1, 0))
plot(mylm, las = 1, sub='Residual Diagnostics')
par(opar)
dev.off()
if (n > n25) {
bitmap(file='test9.png')
plot(kp3:nmkm3,gqarr[,2], main='Goldfeld-Quandt test',ylab='2-sided p-value',xlab='breakpoint')
grid()
dev.off()
}
load(file='createtable')
a<-table.start()
a<-table.row.start(a)
a<-table.element(a, 'Multiple Linear Regression - Estimated Regression Equation', 1, TRUE)
a<-table.row.end(a)
myeq <- colnames(x)[1]
myeq <- paste(myeq, '[t] = ', sep='')
for (i in 1:k){
if (mysum$coefficients[i,1] > 0) myeq <- paste(myeq, '+', '')
myeq <- paste(myeq, mysum$coefficients[i,1], sep=' ')
if (rownames(mysum$coefficients)[i] != '(Intercept)') {
myeq <- paste(myeq, rownames(mysum$coefficients)[i], sep='')
if (rownames(mysum$coefficients)[i] != 't') myeq <- paste(myeq, '[t]', sep='')
}
}
myeq <- paste(myeq, ' + e[t]')
a<-table.row.start(a)
a<-table.element(a, myeq)
a<-table.row.end(a)
a<-table.end(a)
table.save(a,file='mytable1.tab')
a<-table.start()
a<-table.row.start(a)
a<-table.element(a,hyperlink('ols1.htm','Multiple Linear Regression - Ordinary Least Squares',''), 6, TRUE)
a<-table.row.end(a)
a<-table.row.start(a)
a<-table.element(a,'Variable',header=TRUE)
a<-table.element(a,'Parameter',header=TRUE)
a<-table.element(a,'S.D.',header=TRUE)
a<-table.element(a,'T-STAT
H0: parameter = 0',header=TRUE)
a<-table.element(a,'2-tail p-value',header=TRUE)
a<-table.element(a,'1-tail p-value',header=TRUE)
a<-table.row.end(a)
for (i in 1:k){
a<-table.row.start(a)
a<-table.element(a,rownames(mysum$coefficients)[i],header=TRUE)
a<-table.element(a,mysum$coefficients[i,1])
a<-table.element(a, round(mysum$coefficients[i,2],6))
a<-table.element(a, round(mysum$coefficients[i,3],4))
a<-table.element(a, round(mysum$coefficients[i,4],6))
a<-table.element(a, round(mysum$coefficients[i,4]/2,6))
a<-table.row.end(a)
}
a<-table.end(a)
table.save(a,file='mytable2.tab')
a<-table.start()
a<-table.row.start(a)
a<-table.element(a, 'Multiple Linear Regression - Regression Statistics', 2, TRUE)
a<-table.row.end(a)
a<-table.row.start(a)
a<-table.element(a, 'Multiple R',1,TRUE)
a<-table.element(a, sqrt(mysum$r.squared))
a<-table.row.end(a)
a<-table.row.start(a)
a<-table.element(a, 'R-squared',1,TRUE)
a<-table.element(a, mysum$r.squared)
a<-table.row.end(a)
a<-table.row.start(a)
a<-table.element(a, 'Adjusted R-squared',1,TRUE)
a<-table.element(a, mysum$adj.r.squared)
a<-table.row.end(a)
a<-table.row.start(a)
a<-table.element(a, 'F-TEST (value)',1,TRUE)
a<-table.element(a, mysum$fstatistic[1])
a<-table.row.end(a)
a<-table.row.start(a)
a<-table.element(a, 'F-TEST (DF numerator)',1,TRUE)
a<-table.element(a, mysum$fstatistic[2])
a<-table.row.end(a)
a<-table.row.start(a)
a<-table.element(a, 'F-TEST (DF denominator)',1,TRUE)
a<-table.element(a, mysum$fstatistic[3])
a<-table.row.end(a)
a<-table.row.start(a)
a<-table.element(a, 'p-value',1,TRUE)
a<-table.element(a, 1-pf(mysum$fstatistic[1],mysum$fstatistic[2],mysum$fstatistic[3]))
a<-table.row.end(a)
a<-table.row.start(a)
a<-table.element(a, 'Multiple Linear Regression - Residual Statistics', 2, TRUE)
a<-table.row.end(a)
a<-table.row.start(a)
a<-table.element(a, 'Residual Standard Deviation',1,TRUE)
a<-table.element(a, mysum$sigma)
a<-table.row.end(a)
a<-table.row.start(a)
a<-table.element(a, 'Sum Squared Residuals',1,TRUE)
a<-table.element(a, sum(myerror*myerror))
a<-table.row.end(a)
a<-table.end(a)
table.save(a,file='mytable3.tab')
a<-table.start()
a<-table.row.start(a)
a<-table.element(a, 'Multiple Linear Regression - Actuals, Interpolation, and Residuals', 4, TRUE)
a<-table.row.end(a)
a<-table.row.start(a)
a<-table.element(a, 'Time or Index', 1, TRUE)
a<-table.element(a, 'Actuals', 1, TRUE)
a<-table.element(a, 'Interpolation
Forecast', 1, TRUE)
a<-table.element(a, 'Residuals
Prediction Error', 1, TRUE)
a<-table.row.end(a)
for (i in 1:n) {
a<-table.row.start(a)
a<-table.element(a,i, 1, TRUE)
a<-table.element(a,x[i])
a<-table.element(a,x[i]-mysum$resid[i])
a<-table.element(a,mysum$resid[i])
a<-table.row.end(a)
}
a<-table.end(a)
table.save(a,file='mytable4.tab')
if (n > n25) {
a<-table.start()
a<-table.row.start(a)
a<-table.element(a,'Goldfeld-Quandt test for Heteroskedasticity',4,TRUE)
a<-table.row.end(a)
a<-table.row.start(a)
a<-table.element(a,'p-values',header=TRUE)
a<-table.element(a,'Alternative Hypothesis',3,header=TRUE)
a<-table.row.end(a)
a<-table.row.start(a)
a<-table.element(a,'breakpoint index',header=TRUE)
a<-table.element(a,'greater',header=TRUE)
a<-table.element(a,'2-sided',header=TRUE)
a<-table.element(a,'less',header=TRUE)
a<-table.row.end(a)
for (mypoint in kp3:nmkm3) {
a<-table.row.start(a)
a<-table.element(a,mypoint,header=TRUE)
a<-table.element(a,gqarr[mypoint-kp3+1,1])
a<-table.element(a,gqarr[mypoint-kp3+1,2])
a<-table.element(a,gqarr[mypoint-kp3+1,3])
a<-table.row.end(a)
}
a<-table.end(a)
table.save(a,file='mytable5.tab')
a<-table.start()
a<-table.row.start(a)
a<-table.element(a,'Meta Analysis of Goldfeld-Quandt test for Heteroskedasticity',4,TRUE)
a<-table.row.end(a)
a<-table.row.start(a)
a<-table.element(a,'Description',header=TRUE)
a<-table.element(a,'# significant tests',header=TRUE)
a<-table.element(a,'% significant tests',header=TRUE)
a<-table.element(a,'OK/NOK',header=TRUE)
a<-table.row.end(a)
a<-table.row.start(a)
a<-table.element(a,'1% type I error level',header=TRUE)
a<-table.element(a,numsignificant1)
a<-table.element(a,numsignificant1/numgqtests)
if (numsignificant1/numgqtests < 0.01) dum <- 'OK' else dum <- 'NOK'
a<-table.element(a,dum)
a<-table.row.end(a)
a<-table.row.start(a)
a<-table.element(a,'5% type I error level',header=TRUE)
a<-table.element(a,numsignificant5)
a<-table.element(a,numsignificant5/numgqtests)
if (numsignificant5/numgqtests < 0.05) dum <- 'OK' else dum <- 'NOK'
a<-table.element(a,dum)
a<-table.row.end(a)
a<-table.row.start(a)
a<-table.element(a,'10% type I error level',header=TRUE)
a<-table.element(a,numsignificant10)
a<-table.element(a,numsignificant10/numgqtests)
if (numsignificant10/numgqtests < 0.1) dum <- 'OK' else dum <- 'NOK'
a<-table.element(a,dum)
a<-table.row.end(a)
a<-table.end(a)
table.save(a,file='mytable6.tab')
}