Free Statistics

of Irreproducible Research!

Author's title

Author*The author of this computation has been verified*
R Software Modulerwasp_multipleregression.wasp
Title produced by softwareMultiple Regression
Date of computationMon, 24 Nov 2008 04:45:56 -0700
Cite this page as followsStatistical Computations at FreeStatistics.org, Office for Research Development and Education, URL https://freestatistics.org/blog/index.php?v=date/2008/Nov/24/t1227527214peg34ao90lwoj7t.htm/, Retrieved Mon, 13 May 2024 22:15:02 +0000
Statistical Computations at FreeStatistics.org, Office for Research Development and Education, URL https://freestatistics.org/blog/index.php?pk=25405, Retrieved Mon, 13 May 2024 22:15:02 +0000
QR Codes:

Original text written by user:
IsPrivate?No (this computation is public)
User-defined keywordsmultiple regression
Estimated Impact139
Family? (F = Feedback message, R = changed R code, M = changed R Module, P = changed Parameters, D = changed Data)
F       [Multiple Regression] [case: seatbelt la...] [2008-11-24 11:45:56] [74c7506a1ea162af3aa8be25bcd05d28] [Current]
Feedback Forum
2008-11-30 16:47:32 [5faab2fc6fb120339944528a32d48a04] [reply
Goede gegevens gebruikt.
Als we de P-waarde bekijken en vergelijken met de alpha-fout van 5% is de p-waarde niet altijd kleiner dan de alpha fout wat enkel voor bepaalde maanden een significant verschil betekent, meer bepaald M1 en M11. Daarnaast is het belangrijk een eenzijdige toets te gebruiken omdat het invoeren van het plan enkel positieve gevolgen kan hebben.Verder heeft de student correct opgemerkt dat er sprake is van seizonaliteit. De resultaten maken het mogelijk om een uitspraak te doen op LT. Deze is niet gebeurd.
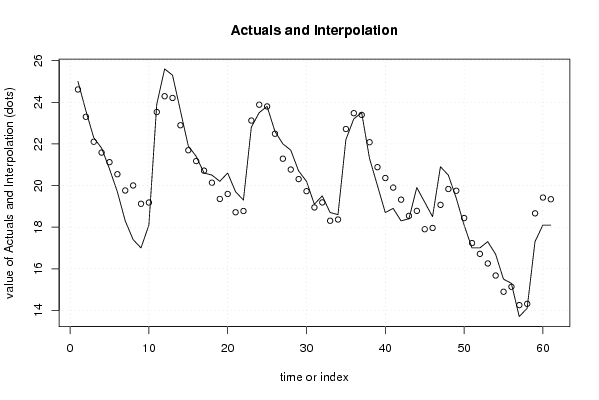
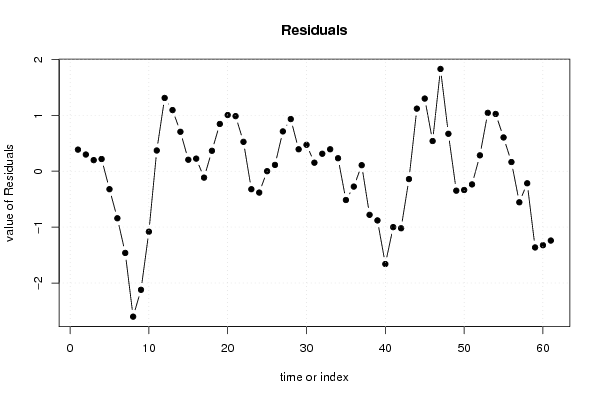
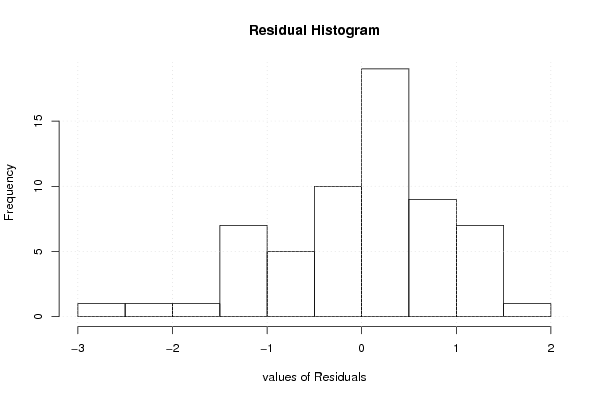
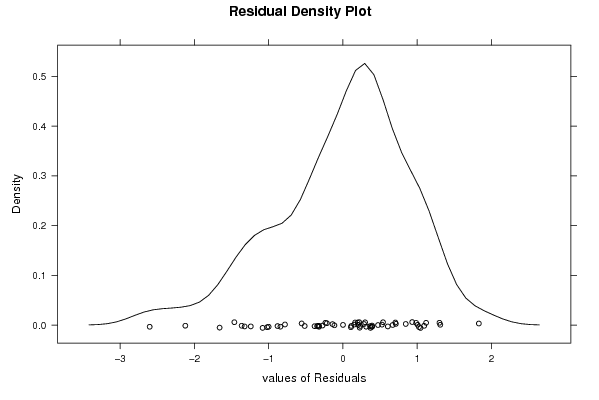
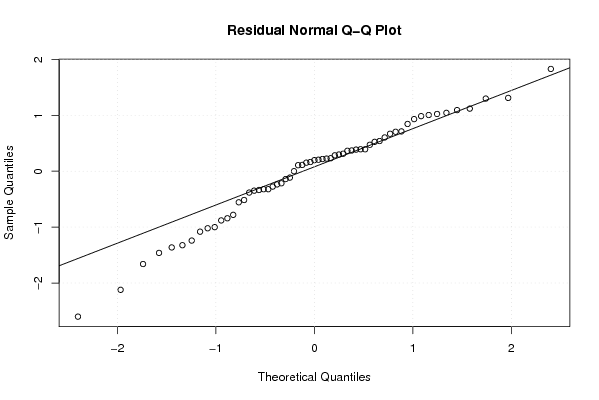
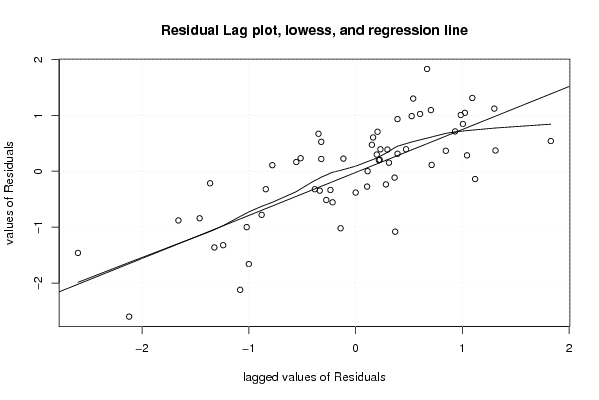
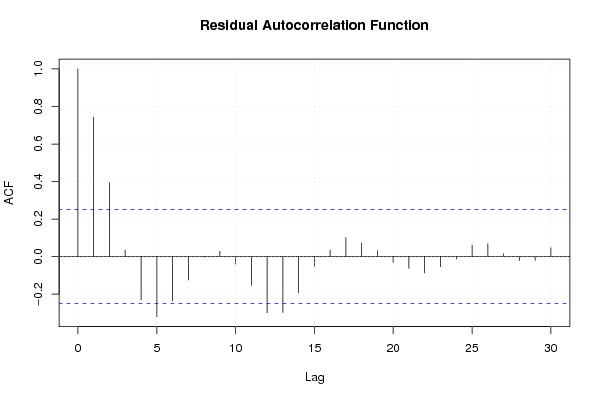
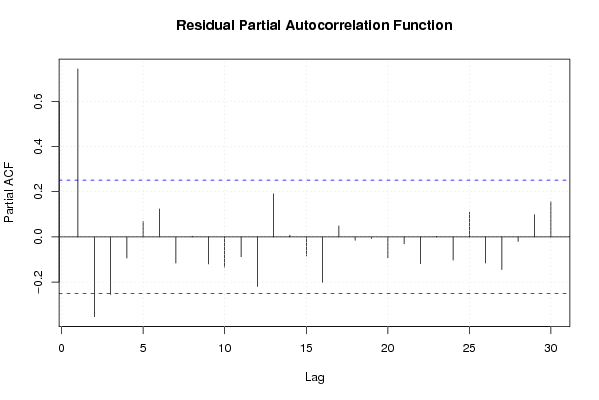
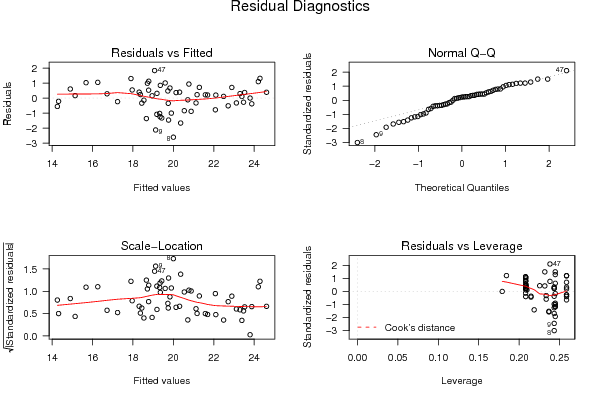
Adjusted R-squared: hetgeen je van de variabiliteit of spreiding kan verklaren, hoog is zeer goed. Maar om te zien of dit aan toeval te wijten is moeten we de F-test (de verdeling) ook controleren. De p-value moet zo klein mogelijk zijn, dat is hier het geval (0), dus de berekeningen kunnen niet aan toeval te wijten zijn. De actuals and interpolations geeft ons een beeld van de licht dalende trend die sterker wordt na de invoering van het plan. De residuals geeft een beeld van de voorspellingsfout, dit zou een mooi golvend patroon rond 0 moeten weergeven maar is hier niet het geval. Het histogram en het densityplot geven eveneens weer dat de residu's niet normaal verdeeld zijn.De qq-plot toont dat de quantielen van de residu’s niet goed aansluiten aan quantielen van een normaalverdeling.Hierbij toont de residual lag plot dat er sprake is van voorspelbaarheid vanwege de positieve correlatie tussen de voorspellingsfout op tijdstip t en t-1. De residual autocorrelatiefunctie geeft binnen de blauwe stippellijn het 95% betrouwbaarheidsinterval, alle verticale lijntjes buiten deze horizontale stippellijn zijn significant verschillend en dus ook niet te wijten aan toeval. Er is geen sprake van autocorrelatie.
Ook het algemeen besluit is correct, nl: Het model is nog niet helemaal in orde. Om aan de assumpties te voldoen:
•mag er geen patroon of geen autocorrelatie zijn; in orde
•moet het gemiddelde constant en nul zijn; niet in orde

OPMERKING: de student stelt dat parameter 0 betekent dat de jobtonic invoering geen effect heeft, dit is niet wat er bedoelt wordt. De parameter nul betekent dat het plan nog niet is ingevoerd.

Post a new message
Dataseries X:
25 0 
23.6 0 
22.3 0 
21.8 0 
20.8 0 
19.7 0 
18.3 0 
17.4 0 
17 0 
18.1 0 
23.9 0 
25.6 0 
25.3 0 
23.6 0 
21.9 0 
21.4 0 
20.6 0 
20.5 0 
20.2 0 
20.6 0 
19.7 0 
19.3 0 
22.8 0 
23.5 0 
23.8 0 
22.6 0 
22 0 
21.7 0 
20.7 0 
20.2 0 
19.1 0 
19.5 0 
18.7 0 
18.6 0 
22.2 0 
23.2 0 
23.5 0 
21.3 0 
20 0 
18.7 0 
18.9 0 
18.3 0 
18.4 0 
19.9 0 
19.2 0 
18.5 0 
20.9 1 
20.5 1 
19.4 1 
18.1 1 
17 1 
17 1 
17.3 1 
16.7 1 
15.5 1 
15.3 1 
13.7 1 
14.1 1 
17.3 1 
18.1 1 
18.1 1


Summary of computational transaction
Raw Inputview raw input (R code)
Raw Outputview raw output of R engine
Computing time3 seconds
R Server'Gwilym Jenkins' @ 72.249.127.135

\begin{tabular}{lllllllll}
\hline
Summary of computational transaction \tabularnewline
Raw Input & view raw input (R code)  \tabularnewline
Raw Output & view raw output of R engine  \tabularnewline
Computing time & 3 seconds \tabularnewline
R Server & 'Gwilym Jenkins' @ 72.249.127.135 \tabularnewline
\hline
\end{tabular}
%Source: https://freestatistics.org/blog/index.php?pk=25405&T=0

[TABLE]
[ROW][C]Summary of computational transaction[/C][/ROW]
[ROW][C]Raw Input[/C][C]view raw input (R code) [/C][/ROW]
[ROW][C]Raw Output[/C][C]view raw output of R engine [/C][/ROW]
[ROW][C]Computing time[/C][C]3 seconds[/C][/ROW]
[ROW][C]R Server[/C][C]'Gwilym Jenkins' @ 72.249.127.135[/C][/ROW]
[/TABLE]
Source: https://freestatistics.org/blog/index.php?pk=25405&T=0

Globally Unique Identifier (entire table): ba.freestatistics.org/blog/index.php?pk=25405&T=0

As an alternative you can also use a QR Code:  

The GUIDs for individual cells are displayed in the table below:

Summary of computational transaction
Raw Inputview raw input (R code)
Raw Outputview raw output of R engine
Computing time3 seconds
R Server'Gwilym Jenkins' @ 72.249.127.135


Multiple Linear Regression - Estimated Regression Equation
werklozen[t] = + 24.6962295081967 -3.23729508196721jobtonic[t] -0.0487795992714024M1[t] -1.32671220400729M2[t] -2.4927868852459M3[t] -2.97886156648452M4[t] -3.40493624772313M5[t] -3.95101092896175M6[t] -4.69708561020036M7[t] -4.42316029143898M8[t] -5.26923497267759M9[t] -5.17530965391621M10[t] -0.793925318761386M11[t] -0.0339253187613844t + e[t]

\begin{tabular}{lllllllll}
\hline
Multiple Linear Regression - Estimated Regression Equation \tabularnewline
werklozen[t] =  +  24.6962295081967 -3.23729508196721jobtonic[t] -0.0487795992714024M1[t] -1.32671220400729M2[t] -2.4927868852459M3[t] -2.97886156648452M4[t] -3.40493624772313M5[t] -3.95101092896175M6[t] -4.69708561020036M7[t] -4.42316029143898M8[t] -5.26923497267759M9[t] -5.17530965391621M10[t] -0.793925318761386M11[t] -0.0339253187613844t  + e[t] \tabularnewline
\hline
\end{tabular}
%Source: https://freestatistics.org/blog/index.php?pk=25405&T=1

[TABLE]
[ROW][C]Multiple Linear Regression - Estimated Regression Equation[/C][/ROW]
[ROW][C]werklozen[t] =  +  24.6962295081967 -3.23729508196721jobtonic[t] -0.0487795992714024M1[t] -1.32671220400729M2[t] -2.4927868852459M3[t] -2.97886156648452M4[t] -3.40493624772313M5[t] -3.95101092896175M6[t] -4.69708561020036M7[t] -4.42316029143898M8[t] -5.26923497267759M9[t] -5.17530965391621M10[t] -0.793925318761386M11[t] -0.0339253187613844t  + e[t][/C][/ROW]
[/TABLE]
Source: https://freestatistics.org/blog/index.php?pk=25405&T=1

Globally Unique Identifier (entire table): ba.freestatistics.org/blog/index.php?pk=25405&T=1

As an alternative you can also use a QR Code:  

The GUIDs for individual cells are displayed in the table below:

Multiple Linear Regression - Estimated Regression Equation
werklozen[t] = + 24.6962295081967 -3.23729508196721jobtonic[t] -0.0487795992714024M1[t] -1.32671220400729M2[t] -2.4927868852459M3[t] -2.97886156648452M4[t] -3.40493624772313M5[t] -3.95101092896175M6[t] -4.69708561020036M7[t] -4.42316029143898M8[t] -5.26923497267759M9[t] -5.17530965391621M10[t] -0.793925318761386M11[t] -0.0339253187613844t + e[t]


Multiple Linear Regression - Ordinary Least Squares
VariableParameterS.D.T-STATH0: parameter = 02-tail p-value1-tail p-value
(Intercept)24.69622950819670.53240146.386500
jobtonic-3.237295081967210.456267-7.095200
M1-0.04877959927140240.605544-0.08060.9361380.468069
M2-1.326712204007290.635518-2.08760.042280.02114
M3-2.49278688524590.634864-3.92650.0002810.00014
M4-2.978861566484520.634404-4.69552.3e-051.2e-05
M5-3.404936247723130.63414-5.36942e-061e-06
M6-3.951010928961750.63407-6.231200
M7-4.697085610200360.634197-7.406400
M8-4.423160291438980.634519-6.970900
M9-5.269234972677590.635035-8.297500
M10-5.175309653916210.635747-8.140500
M11-0.7939253187613860.631287-1.25760.2147380.107369
t-0.03392531876138440.011134-3.04690.0037850.001893

\begin{tabular}{lllllllll}
\hline
Multiple Linear Regression - Ordinary Least Squares \tabularnewline
Variable & Parameter & S.D. & T-STATH0: parameter = 0 & 2-tail p-value & 1-tail p-value \tabularnewline
(Intercept) & 24.6962295081967 & 0.532401 & 46.3865 & 0 & 0 \tabularnewline
jobtonic & -3.23729508196721 & 0.456267 & -7.0952 & 0 & 0 \tabularnewline
M1 & -0.0487795992714024 & 0.605544 & -0.0806 & 0.936138 & 0.468069 \tabularnewline
M2 & -1.32671220400729 & 0.635518 & -2.0876 & 0.04228 & 0.02114 \tabularnewline
M3 & -2.4927868852459 & 0.634864 & -3.9265 & 0.000281 & 0.00014 \tabularnewline
M4 & -2.97886156648452 & 0.634404 & -4.6955 & 2.3e-05 & 1.2e-05 \tabularnewline
M5 & -3.40493624772313 & 0.63414 & -5.3694 & 2e-06 & 1e-06 \tabularnewline
M6 & -3.95101092896175 & 0.63407 & -6.2312 & 0 & 0 \tabularnewline
M7 & -4.69708561020036 & 0.634197 & -7.4064 & 0 & 0 \tabularnewline
M8 & -4.42316029143898 & 0.634519 & -6.9709 & 0 & 0 \tabularnewline
M9 & -5.26923497267759 & 0.635035 & -8.2975 & 0 & 0 \tabularnewline
M10 & -5.17530965391621 & 0.635747 & -8.1405 & 0 & 0 \tabularnewline
M11 & -0.793925318761386 & 0.631287 & -1.2576 & 0.214738 & 0.107369 \tabularnewline
t & -0.0339253187613844 & 0.011134 & -3.0469 & 0.003785 & 0.001893 \tabularnewline
\hline
\end{tabular}
%Source: https://freestatistics.org/blog/index.php?pk=25405&T=2

[TABLE]
[ROW][C]Multiple Linear Regression - Ordinary Least Squares[/C][/ROW]
[ROW][C]Variable[/C][C]Parameter[/C][C]S.D.[/C][C]T-STATH0: parameter = 0[/C][C]2-tail p-value[/C][C]1-tail p-value[/C][/ROW]
[ROW][C](Intercept)[/C][C]24.6962295081967[/C][C]0.532401[/C][C]46.3865[/C][C]0[/C][C]0[/C][/ROW]
[ROW][C]jobtonic[/C][C]-3.23729508196721[/C][C]0.456267[/C][C]-7.0952[/C][C]0[/C][C]0[/C][/ROW]
[ROW][C]M1[/C][C]-0.0487795992714024[/C][C]0.605544[/C][C]-0.0806[/C][C]0.936138[/C][C]0.468069[/C][/ROW]
[ROW][C]M2[/C][C]-1.32671220400729[/C][C]0.635518[/C][C]-2.0876[/C][C]0.04228[/C][C]0.02114[/C][/ROW]
[ROW][C]M3[/C][C]-2.4927868852459[/C][C]0.634864[/C][C]-3.9265[/C][C]0.000281[/C][C]0.00014[/C][/ROW]
[ROW][C]M4[/C][C]-2.97886156648452[/C][C]0.634404[/C][C]-4.6955[/C][C]2.3e-05[/C][C]1.2e-05[/C][/ROW]
[ROW][C]M5[/C][C]-3.40493624772313[/C][C]0.63414[/C][C]-5.3694[/C][C]2e-06[/C][C]1e-06[/C][/ROW]
[ROW][C]M6[/C][C]-3.95101092896175[/C][C]0.63407[/C][C]-6.2312[/C][C]0[/C][C]0[/C][/ROW]
[ROW][C]M7[/C][C]-4.69708561020036[/C][C]0.634197[/C][C]-7.4064[/C][C]0[/C][C]0[/C][/ROW]
[ROW][C]M8[/C][C]-4.42316029143898[/C][C]0.634519[/C][C]-6.9709[/C][C]0[/C][C]0[/C][/ROW]
[ROW][C]M9[/C][C]-5.26923497267759[/C][C]0.635035[/C][C]-8.2975[/C][C]0[/C][C]0[/C][/ROW]
[ROW][C]M10[/C][C]-5.17530965391621[/C][C]0.635747[/C][C]-8.1405[/C][C]0[/C][C]0[/C][/ROW]
[ROW][C]M11[/C][C]-0.793925318761386[/C][C]0.631287[/C][C]-1.2576[/C][C]0.214738[/C][C]0.107369[/C][/ROW]
[ROW][C]t[/C][C]-0.0339253187613844[/C][C]0.011134[/C][C]-3.0469[/C][C]0.003785[/C][C]0.001893[/C][/ROW]
[/TABLE]
Source: https://freestatistics.org/blog/index.php?pk=25405&T=2

Globally Unique Identifier (entire table): ba.freestatistics.org/blog/index.php?pk=25405&T=2

As an alternative you can also use a QR Code:  

The GUIDs for individual cells are displayed in the table below:

Multiple Linear Regression - Ordinary Least Squares
VariableParameterS.D.T-STATH0: parameter = 02-tail p-value1-tail p-value
(Intercept)24.69622950819670.53240146.386500
jobtonic-3.237295081967210.456267-7.095200
M1-0.04877959927140240.605544-0.08060.9361380.468069
M2-1.326712204007290.635518-2.08760.042280.02114
M3-2.49278688524590.634864-3.92650.0002810.00014
M4-2.978861566484520.634404-4.69552.3e-051.2e-05
M5-3.404936247723130.63414-5.36942e-061e-06
M6-3.951010928961750.63407-6.231200
M7-4.697085610200360.634197-7.406400
M8-4.423160291438980.634519-6.970900
M9-5.269234972677590.635035-8.297500
M10-5.175309653916210.635747-8.140500
M11-0.7939253187613860.631287-1.25760.2147380.107369
t-0.03392531876138440.011134-3.04690.0037850.001893


Multiple Linear Regression - Regression Statistics
Multiple R0.944066116465137
R-squared0.891260832257565
Adjusted R-squared0.86118404117987
F-TEST (value)29.6328431432478
F-TEST (DF numerator)13
F-TEST (DF denominator)47
p-value0
Multiple Linear Regression - Residual Statistics
Residual Standard Deviation0.997996452379922
Sum Squared Residuals46.8118551912568

\begin{tabular}{lllllllll}
\hline
Multiple Linear Regression - Regression Statistics \tabularnewline
Multiple R & 0.944066116465137 \tabularnewline
R-squared & 0.891260832257565 \tabularnewline
Adjusted R-squared & 0.86118404117987 \tabularnewline
F-TEST (value) & 29.6328431432478 \tabularnewline
F-TEST (DF numerator) & 13 \tabularnewline
F-TEST (DF denominator) & 47 \tabularnewline
p-value & 0 \tabularnewline
Multiple Linear Regression - Residual Statistics \tabularnewline
Residual Standard Deviation & 0.997996452379922 \tabularnewline
Sum Squared Residuals & 46.8118551912568 \tabularnewline
\hline
\end{tabular}
%Source: https://freestatistics.org/blog/index.php?pk=25405&T=3

[TABLE]
[ROW][C]Multiple Linear Regression - Regression Statistics[/C][/ROW]
[ROW][C]Multiple R[/C][C]0.944066116465137[/C][/ROW]
[ROW][C]R-squared[/C][C]0.891260832257565[/C][/ROW]
[ROW][C]Adjusted R-squared[/C][C]0.86118404117987[/C][/ROW]
[ROW][C]F-TEST (value)[/C][C]29.6328431432478[/C][/ROW]
[ROW][C]F-TEST (DF numerator)[/C][C]13[/C][/ROW]
[ROW][C]F-TEST (DF denominator)[/C][C]47[/C][/ROW]
[ROW][C]p-value[/C][C]0[/C][/ROW]
[ROW][C]Multiple Linear Regression - Residual Statistics[/C][/ROW]
[ROW][C]Residual Standard Deviation[/C][C]0.997996452379922[/C][/ROW]
[ROW][C]Sum Squared Residuals[/C][C]46.8118551912568[/C][/ROW]
[/TABLE]
Source: https://freestatistics.org/blog/index.php?pk=25405&T=3

Globally Unique Identifier (entire table): ba.freestatistics.org/blog/index.php?pk=25405&T=3

As an alternative you can also use a QR Code:  

The GUIDs for individual cells are displayed in the table below:

Multiple Linear Regression - Regression Statistics
Multiple R0.944066116465137
R-squared0.891260832257565
Adjusted R-squared0.86118404117987
F-TEST (value)29.6328431432478
F-TEST (DF numerator)13
F-TEST (DF denominator)47
p-value0
Multiple Linear Regression - Residual Statistics
Residual Standard Deviation0.997996452379922
Sum Squared Residuals46.8118551912568


Multiple Linear Regression - Actuals, Interpolation, and Residuals
Time or IndexActualsInterpolationForecastResidualsPrediction Error
12524.61352459016390.38647540983607
223.623.30166666666670.298333333333331
322.322.10166666666670.198333333333337
421.821.58166666666670.218333333333337
520.821.1216666666667-0.321666666666669
619.720.5416666666667-0.841666666666666
718.319.7616666666667-1.46166666666667
817.420.0016666666667-2.60166666666667
91719.1216666666667-2.12166666666667
1018.119.1816666666667-1.08166666666667
1123.923.52912568306010.370874316939885
1225.624.28912568306011.31087431693989
1325.324.20642076502731.09357923497268
1423.622.89456284153010.705437158469946
1521.921.69456284153010.205437158469943
1621.421.17456284153010.225437158469943
1720.620.7145628415301-0.114562841530053
1820.520.13456284153010.365437158469945
1920.219.35456284153010.845437158469945
2020.619.59456284153011.00543715846995
2119.718.71456284153010.985437158469944
2219.318.77456284153010.525437158469944
2322.823.1220218579235-0.322021857923495
2423.523.8820218579235-0.382021857923497
2523.823.79931693989070.000683060109289271
2622.622.48745901639340.112540983606558
272221.28745901639340.712540983606557
2821.720.76745901639340.932540983606557
2920.720.30745901639340.392540983606557
3020.219.72745901639340.472540983606557
3119.118.94745901639340.152540983606559
3219.519.18745901639340.312540983606557
3318.718.30745901639340.392540983606557
3418.618.36745901639340.232540983606558
3522.222.7149180327869-0.514918032786883
3623.223.4749180327869-0.274918032786885
3723.523.39221311475410.107786885245901
3821.322.0803551912568-0.78035519125683
392020.8803551912568-0.88035519125683
4018.720.3603551912568-1.66035519125683
4118.919.9003551912568-1.00035519125683
4218.319.3203551912568-1.02035519125683
4318.418.5403551912568-0.140355191256831
4419.918.78035519125681.11964480874317
4519.217.90035519125681.29964480874317
4618.517.96035519125680.539644808743169
4720.919.07051912568311.82948087431694
4820.519.83051912568310.66948087431694
4919.419.7478142076503-0.347814207650276
5018.118.435956284153-0.335956284153005
511717.235956284153-0.235956284153007
521716.7159562841530.284043715846994
5317.316.2559562841531.04404371584699
5416.715.6759562841531.02404371584699
5515.514.8959562841530.604043715846995
5615.315.1359562841530.164043715846996
5713.714.255956284153-0.555956284153005
5814.114.315956284153-0.215956284153006
5917.318.6634153005464-1.36341530054645
6018.119.4234153005464-1.32341530054645
6118.119.3407103825137-1.24071038251366

\begin{tabular}{lllllllll}
\hline
Multiple Linear Regression - Actuals, Interpolation, and Residuals \tabularnewline
Time or Index & Actuals & InterpolationForecast & ResidualsPrediction Error \tabularnewline
1 & 25 & 24.6135245901639 & 0.38647540983607 \tabularnewline
2 & 23.6 & 23.3016666666667 & 0.298333333333331 \tabularnewline
3 & 22.3 & 22.1016666666667 & 0.198333333333337 \tabularnewline
4 & 21.8 & 21.5816666666667 & 0.218333333333337 \tabularnewline
5 & 20.8 & 21.1216666666667 & -0.321666666666669 \tabularnewline
6 & 19.7 & 20.5416666666667 & -0.841666666666666 \tabularnewline
7 & 18.3 & 19.7616666666667 & -1.46166666666667 \tabularnewline
8 & 17.4 & 20.0016666666667 & -2.60166666666667 \tabularnewline
9 & 17 & 19.1216666666667 & -2.12166666666667 \tabularnewline
10 & 18.1 & 19.1816666666667 & -1.08166666666667 \tabularnewline
11 & 23.9 & 23.5291256830601 & 0.370874316939885 \tabularnewline
12 & 25.6 & 24.2891256830601 & 1.31087431693989 \tabularnewline
13 & 25.3 & 24.2064207650273 & 1.09357923497268 \tabularnewline
14 & 23.6 & 22.8945628415301 & 0.705437158469946 \tabularnewline
15 & 21.9 & 21.6945628415301 & 0.205437158469943 \tabularnewline
16 & 21.4 & 21.1745628415301 & 0.225437158469943 \tabularnewline
17 & 20.6 & 20.7145628415301 & -0.114562841530053 \tabularnewline
18 & 20.5 & 20.1345628415301 & 0.365437158469945 \tabularnewline
19 & 20.2 & 19.3545628415301 & 0.845437158469945 \tabularnewline
20 & 20.6 & 19.5945628415301 & 1.00543715846995 \tabularnewline
21 & 19.7 & 18.7145628415301 & 0.985437158469944 \tabularnewline
22 & 19.3 & 18.7745628415301 & 0.525437158469944 \tabularnewline
23 & 22.8 & 23.1220218579235 & -0.322021857923495 \tabularnewline
24 & 23.5 & 23.8820218579235 & -0.382021857923497 \tabularnewline
25 & 23.8 & 23.7993169398907 & 0.000683060109289271 \tabularnewline
26 & 22.6 & 22.4874590163934 & 0.112540983606558 \tabularnewline
27 & 22 & 21.2874590163934 & 0.712540983606557 \tabularnewline
28 & 21.7 & 20.7674590163934 & 0.932540983606557 \tabularnewline
29 & 20.7 & 20.3074590163934 & 0.392540983606557 \tabularnewline
30 & 20.2 & 19.7274590163934 & 0.472540983606557 \tabularnewline
31 & 19.1 & 18.9474590163934 & 0.152540983606559 \tabularnewline
32 & 19.5 & 19.1874590163934 & 0.312540983606557 \tabularnewline
33 & 18.7 & 18.3074590163934 & 0.392540983606557 \tabularnewline
34 & 18.6 & 18.3674590163934 & 0.232540983606558 \tabularnewline
35 & 22.2 & 22.7149180327869 & -0.514918032786883 \tabularnewline
36 & 23.2 & 23.4749180327869 & -0.274918032786885 \tabularnewline
37 & 23.5 & 23.3922131147541 & 0.107786885245901 \tabularnewline
38 & 21.3 & 22.0803551912568 & -0.78035519125683 \tabularnewline
39 & 20 & 20.8803551912568 & -0.88035519125683 \tabularnewline
40 & 18.7 & 20.3603551912568 & -1.66035519125683 \tabularnewline
41 & 18.9 & 19.9003551912568 & -1.00035519125683 \tabularnewline
42 & 18.3 & 19.3203551912568 & -1.02035519125683 \tabularnewline
43 & 18.4 & 18.5403551912568 & -0.140355191256831 \tabularnewline
44 & 19.9 & 18.7803551912568 & 1.11964480874317 \tabularnewline
45 & 19.2 & 17.9003551912568 & 1.29964480874317 \tabularnewline
46 & 18.5 & 17.9603551912568 & 0.539644808743169 \tabularnewline
47 & 20.9 & 19.0705191256831 & 1.82948087431694 \tabularnewline
48 & 20.5 & 19.8305191256831 & 0.66948087431694 \tabularnewline
49 & 19.4 & 19.7478142076503 & -0.347814207650276 \tabularnewline
50 & 18.1 & 18.435956284153 & -0.335956284153005 \tabularnewline
51 & 17 & 17.235956284153 & -0.235956284153007 \tabularnewline
52 & 17 & 16.715956284153 & 0.284043715846994 \tabularnewline
53 & 17.3 & 16.255956284153 & 1.04404371584699 \tabularnewline
54 & 16.7 & 15.675956284153 & 1.02404371584699 \tabularnewline
55 & 15.5 & 14.895956284153 & 0.604043715846995 \tabularnewline
56 & 15.3 & 15.135956284153 & 0.164043715846996 \tabularnewline
57 & 13.7 & 14.255956284153 & -0.555956284153005 \tabularnewline
58 & 14.1 & 14.315956284153 & -0.215956284153006 \tabularnewline
59 & 17.3 & 18.6634153005464 & -1.36341530054645 \tabularnewline
60 & 18.1 & 19.4234153005464 & -1.32341530054645 \tabularnewline
61 & 18.1 & 19.3407103825137 & -1.24071038251366 \tabularnewline
\hline
\end{tabular}
%Source: https://freestatistics.org/blog/index.php?pk=25405&T=4

[TABLE]
[ROW][C]Multiple Linear Regression - Actuals, Interpolation, and Residuals[/C][/ROW]
[ROW][C]Time or Index[/C][C]Actuals[/C][C]InterpolationForecast[/C][C]ResidualsPrediction Error[/C][/ROW]
[ROW][C]1[/C][C]25[/C][C]24.6135245901639[/C][C]0.38647540983607[/C][/ROW]
[ROW][C]2[/C][C]23.6[/C][C]23.3016666666667[/C][C]0.298333333333331[/C][/ROW]
[ROW][C]3[/C][C]22.3[/C][C]22.1016666666667[/C][C]0.198333333333337[/C][/ROW]
[ROW][C]4[/C][C]21.8[/C][C]21.5816666666667[/C][C]0.218333333333337[/C][/ROW]
[ROW][C]5[/C][C]20.8[/C][C]21.1216666666667[/C][C]-0.321666666666669[/C][/ROW]
[ROW][C]6[/C][C]19.7[/C][C]20.5416666666667[/C][C]-0.841666666666666[/C][/ROW]
[ROW][C]7[/C][C]18.3[/C][C]19.7616666666667[/C][C]-1.46166666666667[/C][/ROW]
[ROW][C]8[/C][C]17.4[/C][C]20.0016666666667[/C][C]-2.60166666666667[/C][/ROW]
[ROW][C]9[/C][C]17[/C][C]19.1216666666667[/C][C]-2.12166666666667[/C][/ROW]
[ROW][C]10[/C][C]18.1[/C][C]19.1816666666667[/C][C]-1.08166666666667[/C][/ROW]
[ROW][C]11[/C][C]23.9[/C][C]23.5291256830601[/C][C]0.370874316939885[/C][/ROW]
[ROW][C]12[/C][C]25.6[/C][C]24.2891256830601[/C][C]1.31087431693989[/C][/ROW]
[ROW][C]13[/C][C]25.3[/C][C]24.2064207650273[/C][C]1.09357923497268[/C][/ROW]
[ROW][C]14[/C][C]23.6[/C][C]22.8945628415301[/C][C]0.705437158469946[/C][/ROW]
[ROW][C]15[/C][C]21.9[/C][C]21.6945628415301[/C][C]0.205437158469943[/C][/ROW]
[ROW][C]16[/C][C]21.4[/C][C]21.1745628415301[/C][C]0.225437158469943[/C][/ROW]
[ROW][C]17[/C][C]20.6[/C][C]20.7145628415301[/C][C]-0.114562841530053[/C][/ROW]
[ROW][C]18[/C][C]20.5[/C][C]20.1345628415301[/C][C]0.365437158469945[/C][/ROW]
[ROW][C]19[/C][C]20.2[/C][C]19.3545628415301[/C][C]0.845437158469945[/C][/ROW]
[ROW][C]20[/C][C]20.6[/C][C]19.5945628415301[/C][C]1.00543715846995[/C][/ROW]
[ROW][C]21[/C][C]19.7[/C][C]18.7145628415301[/C][C]0.985437158469944[/C][/ROW]
[ROW][C]22[/C][C]19.3[/C][C]18.7745628415301[/C][C]0.525437158469944[/C][/ROW]
[ROW][C]23[/C][C]22.8[/C][C]23.1220218579235[/C][C]-0.322021857923495[/C][/ROW]
[ROW][C]24[/C][C]23.5[/C][C]23.8820218579235[/C][C]-0.382021857923497[/C][/ROW]
[ROW][C]25[/C][C]23.8[/C][C]23.7993169398907[/C][C]0.000683060109289271[/C][/ROW]
[ROW][C]26[/C][C]22.6[/C][C]22.4874590163934[/C][C]0.112540983606558[/C][/ROW]
[ROW][C]27[/C][C]22[/C][C]21.2874590163934[/C][C]0.712540983606557[/C][/ROW]
[ROW][C]28[/C][C]21.7[/C][C]20.7674590163934[/C][C]0.932540983606557[/C][/ROW]
[ROW][C]29[/C][C]20.7[/C][C]20.3074590163934[/C][C]0.392540983606557[/C][/ROW]
[ROW][C]30[/C][C]20.2[/C][C]19.7274590163934[/C][C]0.472540983606557[/C][/ROW]
[ROW][C]31[/C][C]19.1[/C][C]18.9474590163934[/C][C]0.152540983606559[/C][/ROW]
[ROW][C]32[/C][C]19.5[/C][C]19.1874590163934[/C][C]0.312540983606557[/C][/ROW]
[ROW][C]33[/C][C]18.7[/C][C]18.3074590163934[/C][C]0.392540983606557[/C][/ROW]
[ROW][C]34[/C][C]18.6[/C][C]18.3674590163934[/C][C]0.232540983606558[/C][/ROW]
[ROW][C]35[/C][C]22.2[/C][C]22.7149180327869[/C][C]-0.514918032786883[/C][/ROW]
[ROW][C]36[/C][C]23.2[/C][C]23.4749180327869[/C][C]-0.274918032786885[/C][/ROW]
[ROW][C]37[/C][C]23.5[/C][C]23.3922131147541[/C][C]0.107786885245901[/C][/ROW]
[ROW][C]38[/C][C]21.3[/C][C]22.0803551912568[/C][C]-0.78035519125683[/C][/ROW]
[ROW][C]39[/C][C]20[/C][C]20.8803551912568[/C][C]-0.88035519125683[/C][/ROW]
[ROW][C]40[/C][C]18.7[/C][C]20.3603551912568[/C][C]-1.66035519125683[/C][/ROW]
[ROW][C]41[/C][C]18.9[/C][C]19.9003551912568[/C][C]-1.00035519125683[/C][/ROW]
[ROW][C]42[/C][C]18.3[/C][C]19.3203551912568[/C][C]-1.02035519125683[/C][/ROW]
[ROW][C]43[/C][C]18.4[/C][C]18.5403551912568[/C][C]-0.140355191256831[/C][/ROW]
[ROW][C]44[/C][C]19.9[/C][C]18.7803551912568[/C][C]1.11964480874317[/C][/ROW]
[ROW][C]45[/C][C]19.2[/C][C]17.9003551912568[/C][C]1.29964480874317[/C][/ROW]
[ROW][C]46[/C][C]18.5[/C][C]17.9603551912568[/C][C]0.539644808743169[/C][/ROW]
[ROW][C]47[/C][C]20.9[/C][C]19.0705191256831[/C][C]1.82948087431694[/C][/ROW]
[ROW][C]48[/C][C]20.5[/C][C]19.8305191256831[/C][C]0.66948087431694[/C][/ROW]
[ROW][C]49[/C][C]19.4[/C][C]19.7478142076503[/C][C]-0.347814207650276[/C][/ROW]
[ROW][C]50[/C][C]18.1[/C][C]18.435956284153[/C][C]-0.335956284153005[/C][/ROW]
[ROW][C]51[/C][C]17[/C][C]17.235956284153[/C][C]-0.235956284153007[/C][/ROW]
[ROW][C]52[/C][C]17[/C][C]16.715956284153[/C][C]0.284043715846994[/C][/ROW]
[ROW][C]53[/C][C]17.3[/C][C]16.255956284153[/C][C]1.04404371584699[/C][/ROW]
[ROW][C]54[/C][C]16.7[/C][C]15.675956284153[/C][C]1.02404371584699[/C][/ROW]
[ROW][C]55[/C][C]15.5[/C][C]14.895956284153[/C][C]0.604043715846995[/C][/ROW]
[ROW][C]56[/C][C]15.3[/C][C]15.135956284153[/C][C]0.164043715846996[/C][/ROW]
[ROW][C]57[/C][C]13.7[/C][C]14.255956284153[/C][C]-0.555956284153005[/C][/ROW]
[ROW][C]58[/C][C]14.1[/C][C]14.315956284153[/C][C]-0.215956284153006[/C][/ROW]
[ROW][C]59[/C][C]17.3[/C][C]18.6634153005464[/C][C]-1.36341530054645[/C][/ROW]
[ROW][C]60[/C][C]18.1[/C][C]19.4234153005464[/C][C]-1.32341530054645[/C][/ROW]
[ROW][C]61[/C][C]18.1[/C][C]19.3407103825137[/C][C]-1.24071038251366[/C][/ROW]
[/TABLE]
Source: https://freestatistics.org/blog/index.php?pk=25405&T=4

Globally Unique Identifier (entire table): ba.freestatistics.org/blog/index.php?pk=25405&T=4

As an alternative you can also use a QR Code:  

The GUIDs for individual cells are displayed in the table below:

Multiple Linear Regression - Actuals, Interpolation, and Residuals
Time or IndexActualsInterpolationForecastResidualsPrediction Error
12524.61352459016390.38647540983607
223.623.30166666666670.298333333333331
322.322.10166666666670.198333333333337
421.821.58166666666670.218333333333337
520.821.1216666666667-0.321666666666669
619.720.5416666666667-0.841666666666666
718.319.7616666666667-1.46166666666667
817.420.0016666666667-2.60166666666667
91719.1216666666667-2.12166666666667
1018.119.1816666666667-1.08166666666667
1123.923.52912568306010.370874316939885
1225.624.28912568306011.31087431693989
1325.324.20642076502731.09357923497268
1423.622.89456284153010.705437158469946
1521.921.69456284153010.205437158469943
1621.421.17456284153010.225437158469943
1720.620.7145628415301-0.114562841530053
1820.520.13456284153010.365437158469945
1920.219.35456284153010.845437158469945
2020.619.59456284153011.00543715846995
2119.718.71456284153010.985437158469944
2219.318.77456284153010.525437158469944
2322.823.1220218579235-0.322021857923495
2423.523.8820218579235-0.382021857923497
2523.823.79931693989070.000683060109289271
2622.622.48745901639340.112540983606558
272221.28745901639340.712540983606557
2821.720.76745901639340.932540983606557
2920.720.30745901639340.392540983606557
3020.219.72745901639340.472540983606557
3119.118.94745901639340.152540983606559
3219.519.18745901639340.312540983606557
3318.718.30745901639340.392540983606557
3418.618.36745901639340.232540983606558
3522.222.7149180327869-0.514918032786883
3623.223.4749180327869-0.274918032786885
3723.523.39221311475410.107786885245901
3821.322.0803551912568-0.78035519125683
392020.8803551912568-0.88035519125683
4018.720.3603551912568-1.66035519125683
4118.919.9003551912568-1.00035519125683
4218.319.3203551912568-1.02035519125683
4318.418.5403551912568-0.140355191256831
4419.918.78035519125681.11964480874317
4519.217.90035519125681.29964480874317
4618.517.96035519125680.539644808743169
4720.919.07051912568311.82948087431694
4820.519.83051912568310.66948087431694
4919.419.7478142076503-0.347814207650276
5018.118.435956284153-0.335956284153005
511717.235956284153-0.235956284153007
521716.7159562841530.284043715846994
5317.316.2559562841531.04404371584699
5416.715.6759562841531.02404371584699
5515.514.8959562841530.604043715846995
5615.315.1359562841530.164043715846996
5713.714.255956284153-0.555956284153005
5814.114.315956284153-0.215956284153006
5917.318.6634153005464-1.36341530054645
6018.119.4234153005464-1.32341530054645
6118.119.3407103825137-1.24071038251366


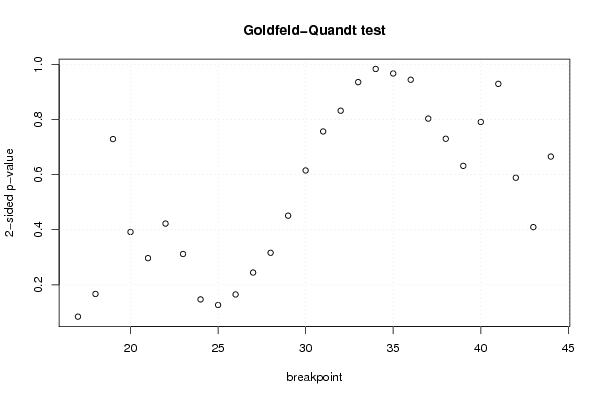
Goldfeld-Quandt test for Heteroskedasticity
p-valuesAlternative Hypothesis
breakpoint indexgreater2-sidedless
170.04235002147891810.08470004295783610.957649978521082
180.08352898118213180.1670579623642640.916471018817868
190.3644748480332660.7289496960665310.635525151966734
200.8040880907060640.3918238185878710.195911909293936
210.8515034374325110.2969931251349770.148496562567489
220.7888363531293120.4223272937413760.211163646870688
230.8440083005238280.3119833989523440.155991699476172
240.9263431768658810.1473136462682370.0736568231341187
250.936489765964310.1270204680713810.0635102340356905
260.9173828410953840.1652343178092330.0826171589046164
270.8776359353423180.2447281293153650.122364064657682
280.8418058891190050.316388221761990.158194110880995
290.7744752965691820.4510494068616360.225524703430818
300.692495515572910.6150089688541790.307504484427089
310.6217611823010060.7564776353979870.378238817698994
320.5841288992732870.8317422014534270.415871100726713
330.5322926168360260.9354147663279480.467707383163974
340.5083604282805920.9832791434388170.491639571719408
350.516575414360350.96684917127930.48342458563965
360.472066320041900.944132640083800.5279336799581
370.4015969372756740.8031938745513480.598403062724326
380.3650040980569530.7300081961139070.634995901943046
390.3158656239659130.6317312479318250.684134376034087
400.3954889820937760.7909779641875520.604511017906224
410.4645850791666680.9291701583333370.535414920833332
420.7056927040030090.5886145919939810.294307295996991
430.7952508184812660.4094983630374680.204749181518734
440.6672825369977150.6654349260045710.332717463002285

\begin{tabular}{lllllllll}
\hline
Goldfeld-Quandt test for Heteroskedasticity \tabularnewline
p-values & Alternative Hypothesis \tabularnewline
breakpoint index & greater & 2-sided & less \tabularnewline
17 & 0.0423500214789181 & 0.0847000429578361 & 0.957649978521082 \tabularnewline
18 & 0.0835289811821318 & 0.167057962364264 & 0.916471018817868 \tabularnewline
19 & 0.364474848033266 & 0.728949696066531 & 0.635525151966734 \tabularnewline
20 & 0.804088090706064 & 0.391823818587871 & 0.195911909293936 \tabularnewline
21 & 0.851503437432511 & 0.296993125134977 & 0.148496562567489 \tabularnewline
22 & 0.788836353129312 & 0.422327293741376 & 0.211163646870688 \tabularnewline
23 & 0.844008300523828 & 0.311983398952344 & 0.155991699476172 \tabularnewline
24 & 0.926343176865881 & 0.147313646268237 & 0.0736568231341187 \tabularnewline
25 & 0.93648976596431 & 0.127020468071381 & 0.0635102340356905 \tabularnewline
26 & 0.917382841095384 & 0.165234317809233 & 0.0826171589046164 \tabularnewline
27 & 0.877635935342318 & 0.244728129315365 & 0.122364064657682 \tabularnewline
28 & 0.841805889119005 & 0.31638822176199 & 0.158194110880995 \tabularnewline
29 & 0.774475296569182 & 0.451049406861636 & 0.225524703430818 \tabularnewline
30 & 0.69249551557291 & 0.615008968854179 & 0.307504484427089 \tabularnewline
31 & 0.621761182301006 & 0.756477635397987 & 0.378238817698994 \tabularnewline
32 & 0.584128899273287 & 0.831742201453427 & 0.415871100726713 \tabularnewline
33 & 0.532292616836026 & 0.935414766327948 & 0.467707383163974 \tabularnewline
34 & 0.508360428280592 & 0.983279143438817 & 0.491639571719408 \tabularnewline
35 & 0.51657541436035 & 0.9668491712793 & 0.48342458563965 \tabularnewline
36 & 0.47206632004190 & 0.94413264008380 & 0.5279336799581 \tabularnewline
37 & 0.401596937275674 & 0.803193874551348 & 0.598403062724326 \tabularnewline
38 & 0.365004098056953 & 0.730008196113907 & 0.634995901943046 \tabularnewline
39 & 0.315865623965913 & 0.631731247931825 & 0.684134376034087 \tabularnewline
40 & 0.395488982093776 & 0.790977964187552 & 0.604511017906224 \tabularnewline
41 & 0.464585079166668 & 0.929170158333337 & 0.535414920833332 \tabularnewline
42 & 0.705692704003009 & 0.588614591993981 & 0.294307295996991 \tabularnewline
43 & 0.795250818481266 & 0.409498363037468 & 0.204749181518734 \tabularnewline
44 & 0.667282536997715 & 0.665434926004571 & 0.332717463002285 \tabularnewline
\hline
\end{tabular}
%Source: https://freestatistics.org/blog/index.php?pk=25405&T=5

[TABLE]
[ROW][C]Goldfeld-Quandt test for Heteroskedasticity[/C][/ROW]
[ROW][C]p-values[/C][C]Alternative Hypothesis[/C][/ROW]
[ROW][C]breakpoint index[/C][C]greater[/C][C]2-sided[/C][C]less[/C][/ROW]
[ROW][C]17[/C][C]0.0423500214789181[/C][C]0.0847000429578361[/C][C]0.957649978521082[/C][/ROW]
[ROW][C]18[/C][C]0.0835289811821318[/C][C]0.167057962364264[/C][C]0.916471018817868[/C][/ROW]
[ROW][C]19[/C][C]0.364474848033266[/C][C]0.728949696066531[/C][C]0.635525151966734[/C][/ROW]
[ROW][C]20[/C][C]0.804088090706064[/C][C]0.391823818587871[/C][C]0.195911909293936[/C][/ROW]
[ROW][C]21[/C][C]0.851503437432511[/C][C]0.296993125134977[/C][C]0.148496562567489[/C][/ROW]
[ROW][C]22[/C][C]0.788836353129312[/C][C]0.422327293741376[/C][C]0.211163646870688[/C][/ROW]
[ROW][C]23[/C][C]0.844008300523828[/C][C]0.311983398952344[/C][C]0.155991699476172[/C][/ROW]
[ROW][C]24[/C][C]0.926343176865881[/C][C]0.147313646268237[/C][C]0.0736568231341187[/C][/ROW]
[ROW][C]25[/C][C]0.93648976596431[/C][C]0.127020468071381[/C][C]0.0635102340356905[/C][/ROW]
[ROW][C]26[/C][C]0.917382841095384[/C][C]0.165234317809233[/C][C]0.0826171589046164[/C][/ROW]
[ROW][C]27[/C][C]0.877635935342318[/C][C]0.244728129315365[/C][C]0.122364064657682[/C][/ROW]
[ROW][C]28[/C][C]0.841805889119005[/C][C]0.31638822176199[/C][C]0.158194110880995[/C][/ROW]
[ROW][C]29[/C][C]0.774475296569182[/C][C]0.451049406861636[/C][C]0.225524703430818[/C][/ROW]
[ROW][C]30[/C][C]0.69249551557291[/C][C]0.615008968854179[/C][C]0.307504484427089[/C][/ROW]
[ROW][C]31[/C][C]0.621761182301006[/C][C]0.756477635397987[/C][C]0.378238817698994[/C][/ROW]
[ROW][C]32[/C][C]0.584128899273287[/C][C]0.831742201453427[/C][C]0.415871100726713[/C][/ROW]
[ROW][C]33[/C][C]0.532292616836026[/C][C]0.935414766327948[/C][C]0.467707383163974[/C][/ROW]
[ROW][C]34[/C][C]0.508360428280592[/C][C]0.983279143438817[/C][C]0.491639571719408[/C][/ROW]
[ROW][C]35[/C][C]0.51657541436035[/C][C]0.9668491712793[/C][C]0.48342458563965[/C][/ROW]
[ROW][C]36[/C][C]0.47206632004190[/C][C]0.94413264008380[/C][C]0.5279336799581[/C][/ROW]
[ROW][C]37[/C][C]0.401596937275674[/C][C]0.803193874551348[/C][C]0.598403062724326[/C][/ROW]
[ROW][C]38[/C][C]0.365004098056953[/C][C]0.730008196113907[/C][C]0.634995901943046[/C][/ROW]
[ROW][C]39[/C][C]0.315865623965913[/C][C]0.631731247931825[/C][C]0.684134376034087[/C][/ROW]
[ROW][C]40[/C][C]0.395488982093776[/C][C]0.790977964187552[/C][C]0.604511017906224[/C][/ROW]
[ROW][C]41[/C][C]0.464585079166668[/C][C]0.929170158333337[/C][C]0.535414920833332[/C][/ROW]
[ROW][C]42[/C][C]0.705692704003009[/C][C]0.588614591993981[/C][C]0.294307295996991[/C][/ROW]
[ROW][C]43[/C][C]0.795250818481266[/C][C]0.409498363037468[/C][C]0.204749181518734[/C][/ROW]
[ROW][C]44[/C][C]0.667282536997715[/C][C]0.665434926004571[/C][C]0.332717463002285[/C][/ROW]
[/TABLE]
Source: https://freestatistics.org/blog/index.php?pk=25405&T=5

Globally Unique Identifier (entire table): ba.freestatistics.org/blog/index.php?pk=25405&T=5

As an alternative you can also use a QR Code:  

The GUIDs for individual cells are displayed in the table below:

Goldfeld-Quandt test for Heteroskedasticity
p-valuesAlternative Hypothesis
breakpoint indexgreater2-sidedless
170.04235002147891810.08470004295783610.957649978521082
180.08352898118213180.1670579623642640.916471018817868
190.3644748480332660.7289496960665310.635525151966734
200.8040880907060640.3918238185878710.195911909293936
210.8515034374325110.2969931251349770.148496562567489
220.7888363531293120.4223272937413760.211163646870688
230.8440083005238280.3119833989523440.155991699476172
240.9263431768658810.1473136462682370.0736568231341187
250.936489765964310.1270204680713810.0635102340356905
260.9173828410953840.1652343178092330.0826171589046164
270.8776359353423180.2447281293153650.122364064657682
280.8418058891190050.316388221761990.158194110880995
290.7744752965691820.4510494068616360.225524703430818
300.692495515572910.6150089688541790.307504484427089
310.6217611823010060.7564776353979870.378238817698994
320.5841288992732870.8317422014534270.415871100726713
330.5322926168360260.9354147663279480.467707383163974
340.5083604282805920.9832791434388170.491639571719408
350.516575414360350.96684917127930.48342458563965
360.472066320041900.944132640083800.5279336799581
370.4015969372756740.8031938745513480.598403062724326
380.3650040980569530.7300081961139070.634995901943046
390.3158656239659130.6317312479318250.684134376034087
400.3954889820937760.7909779641875520.604511017906224
410.4645850791666680.9291701583333370.535414920833332
420.7056927040030090.5886145919939810.294307295996991
430.7952508184812660.4094983630374680.204749181518734
440.6672825369977150.6654349260045710.332717463002285


Meta Analysis of Goldfeld-Quandt test for Heteroskedasticity
Description# significant tests% significant testsOK/NOK
1% type I error level00OK
5% type I error level00OK
10% type I error level10.0357142857142857OK

\begin{tabular}{lllllllll}
\hline
Meta Analysis of Goldfeld-Quandt test for Heteroskedasticity \tabularnewline
Description & # significant tests & % significant tests & OK/NOK \tabularnewline
1% type I error level & 0 & 0 & OK \tabularnewline
5% type I error level & 0 & 0 & OK \tabularnewline
10% type I error level & 1 & 0.0357142857142857 & OK \tabularnewline
\hline
\end{tabular}
%Source: https://freestatistics.org/blog/index.php?pk=25405&T=6

[TABLE]
[ROW][C]Meta Analysis of Goldfeld-Quandt test for Heteroskedasticity[/C][/ROW]
[ROW][C]Description[/C][C]# significant tests[/C][C]% significant tests[/C][C]OK/NOK[/C][/ROW]
[ROW][C]1% type I error level[/C][C]0[/C][C]0[/C][C]OK[/C][/ROW]
[ROW][C]5% type I error level[/C][C]0[/C][C]0[/C][C]OK[/C][/ROW]
[ROW][C]10% type I error level[/C][C]1[/C][C]0.0357142857142857[/C][C]OK[/C][/ROW]
[/TABLE]
Source: https://freestatistics.org/blog/index.php?pk=25405&T=6

Globally Unique Identifier (entire table): ba.freestatistics.org/blog/index.php?pk=25405&T=6

As an alternative you can also use a QR Code:  

The GUIDs for individual cells are displayed in the table below:

Meta Analysis of Goldfeld-Quandt test for Heteroskedasticity
Description# significant tests% significant testsOK/NOK
1% type I error level00OK
5% type I error level00OK
10% type I error level10.0357142857142857OK


Parameters (Session):
par1 = 1 ; par2 = Include Monthly Dummies ; par3 = Linear Trend ;
Parameters (R input):
par1 = 1 ; par2 = Include Monthly Dummies ; par3 = Linear Trend ;
R code (references can be found in the software module):
library(lattice)
library(lmtest)
n25 <- 25 #minimum number of obs. for Goldfeld-Quandt test
par1 <- as.numeric(par1)
x <- t(y)
k <- length(x[1,])
n <- length(x[,1])
x1 <- cbind(x[,par1], x[,1:k!=par1])
mycolnames <- c(colnames(x)[par1], colnames(x)[1:k!=par1])
colnames(x1) <- mycolnames #colnames(x)[par1]
x <- x1
if (par3 == 'First Differences'){
x2 <- array(0, dim=c(n-1,k), dimnames=list(1:(n-1), paste('(1-B)',colnames(x),sep='')))
for (i in 1:n-1) {
for (j in 1:k) {
x2[i,j] <- x[i+1,j] - x[i,j]
}
}
x <- x2
}
if (par2 == 'Include Monthly Dummies'){
x2 <- array(0, dim=c(n,11), dimnames=list(1:n, paste('M', seq(1:11), sep ='')))
for (i in 1:11){
x2[seq(i,n,12),i] <- 1
}
x <- cbind(x, x2)
}
if (par2 == 'Include Quarterly Dummies'){
x2 <- array(0, dim=c(n,3), dimnames=list(1:n, paste('Q', seq(1:3), sep ='')))
for (i in 1:3){
x2[seq(i,n,4),i] <- 1
}
x <- cbind(x, x2)
}
k <- length(x[1,])
if (par3 == 'Linear Trend'){
x <- cbind(x, c(1:n))
colnames(x)[k+1] <- 't'
}
x
k <- length(x[1,])
df <- as.data.frame(x)
(mylm <- lm(df))
(mysum <- summary(mylm))
if (n > n25) {
kp3 <- k + 3
nmkm3 <- n - k - 3
gqarr <- array(NA, dim=c(nmkm3-kp3+1,3))
numgqtests <- 0
numsignificant1 <- 0
numsignificant5 <- 0
numsignificant10 <- 0
for (mypoint in kp3:nmkm3) {
j <- 0
numgqtests <- numgqtests + 1
for (myalt in c('greater', 'two.sided', 'less')) {
j <- j + 1
gqarr[mypoint-kp3+1,j] <- gqtest(mylm, point=mypoint, alternative=myalt)$p.value
}
if (gqarr[mypoint-kp3+1,2] < 0.01) numsignificant1 <- numsignificant1 + 1
if (gqarr[mypoint-kp3+1,2] < 0.05) numsignificant5 <- numsignificant5 + 1
if (gqarr[mypoint-kp3+1,2] < 0.10) numsignificant10 <- numsignificant10 + 1
}
gqarr
}
bitmap(file='test0.png')
plot(x[,1], type='l', main='Actuals and Interpolation', ylab='value of Actuals and Interpolation (dots)', xlab='time or index')
points(x[,1]-mysum$resid)
grid()
dev.off()
bitmap(file='test1.png')
plot(mysum$resid, type='b', pch=19, main='Residuals', ylab='value of Residuals', xlab='time or index')
grid()
dev.off()
bitmap(file='test2.png')
hist(mysum$resid, main='Residual Histogram', xlab='values of Residuals')
grid()
dev.off()
bitmap(file='test3.png')
densityplot(~mysum$resid,col='black',main='Residual Density Plot', xlab='values of Residuals')
dev.off()
bitmap(file='test4.png')
qqnorm(mysum$resid, main='Residual Normal Q-Q Plot')
qqline(mysum$resid)
grid()
dev.off()
(myerror <- as.ts(mysum$resid))
bitmap(file='test5.png')
dum <- cbind(lag(myerror,k=1),myerror)
dum
dum1 <- dum[2:length(myerror),]
dum1
z <- as.data.frame(dum1)
z
plot(z,main=paste('Residual Lag plot, lowess, and regression line'), ylab='values of Residuals', xlab='lagged values of Residuals')
lines(lowess(z))
abline(lm(z))
grid()
dev.off()
bitmap(file='test6.png')
acf(mysum$resid, lag.max=length(mysum$resid)/2, main='Residual Autocorrelation Function')
grid()
dev.off()
bitmap(file='test7.png')
pacf(mysum$resid, lag.max=length(mysum$resid)/2, main='Residual Partial Autocorrelation Function')
grid()
dev.off()
bitmap(file='test8.png')
opar <- par(mfrow = c(2,2), oma = c(0, 0, 1.1, 0))
plot(mylm, las = 1, sub='Residual Diagnostics')
par(opar)
dev.off()
if (n > n25) {
bitmap(file='test9.png')
plot(kp3:nmkm3,gqarr[,2], main='Goldfeld-Quandt test',ylab='2-sided p-value',xlab='breakpoint')
grid()
dev.off()
}
load(file='createtable')
a<-table.start()
a<-table.row.start(a)
a<-table.element(a, 'Multiple Linear Regression - Estimated Regression Equation', 1, TRUE)
a<-table.row.end(a)
myeq <- colnames(x)[1]
myeq <- paste(myeq, '[t] = ', sep='')
for (i in 1:k){
if (mysum$coefficients[i,1] > 0) myeq <- paste(myeq, '+', '')
myeq <- paste(myeq, mysum$coefficients[i,1], sep=' ')
if (rownames(mysum$coefficients)[i] != '(Intercept)') {
myeq <- paste(myeq, rownames(mysum$coefficients)[i], sep='')
if (rownames(mysum$coefficients)[i] != 't') myeq <- paste(myeq, '[t]', sep='')
}
}
myeq <- paste(myeq, ' + e[t]')
a<-table.row.start(a)
a<-table.element(a, myeq)
a<-table.row.end(a)
a<-table.end(a)
table.save(a,file='mytable1.tab')
a<-table.start()
a<-table.row.start(a)
a<-table.element(a,hyperlink('ols1.htm','Multiple Linear Regression - Ordinary Least Squares',''), 6, TRUE)
a<-table.row.end(a)
a<-table.row.start(a)
a<-table.element(a,'Variable',header=TRUE)
a<-table.element(a,'Parameter',header=TRUE)
a<-table.element(a,'S.D.',header=TRUE)
a<-table.element(a,'T-STAT
H0: parameter = 0',header=TRUE)
a<-table.element(a,'2-tail p-value',header=TRUE)
a<-table.element(a,'1-tail p-value',header=TRUE)
a<-table.row.end(a)
for (i in 1:k){
a<-table.row.start(a)
a<-table.element(a,rownames(mysum$coefficients)[i],header=TRUE)
a<-table.element(a,mysum$coefficients[i,1])
a<-table.element(a, round(mysum$coefficients[i,2],6))
a<-table.element(a, round(mysum$coefficients[i,3],4))
a<-table.element(a, round(mysum$coefficients[i,4],6))
a<-table.element(a, round(mysum$coefficients[i,4]/2,6))
a<-table.row.end(a)
}
a<-table.end(a)
table.save(a,file='mytable2.tab')
a<-table.start()
a<-table.row.start(a)
a<-table.element(a, 'Multiple Linear Regression - Regression Statistics', 2, TRUE)
a<-table.row.end(a)
a<-table.row.start(a)
a<-table.element(a, 'Multiple R',1,TRUE)
a<-table.element(a, sqrt(mysum$r.squared))
a<-table.row.end(a)
a<-table.row.start(a)
a<-table.element(a, 'R-squared',1,TRUE)
a<-table.element(a, mysum$r.squared)
a<-table.row.end(a)
a<-table.row.start(a)
a<-table.element(a, 'Adjusted R-squared',1,TRUE)
a<-table.element(a, mysum$adj.r.squared)
a<-table.row.end(a)
a<-table.row.start(a)
a<-table.element(a, 'F-TEST (value)',1,TRUE)
a<-table.element(a, mysum$fstatistic[1])
a<-table.row.end(a)
a<-table.row.start(a)
a<-table.element(a, 'F-TEST (DF numerator)',1,TRUE)
a<-table.element(a, mysum$fstatistic[2])
a<-table.row.end(a)
a<-table.row.start(a)
a<-table.element(a, 'F-TEST (DF denominator)',1,TRUE)
a<-table.element(a, mysum$fstatistic[3])
a<-table.row.end(a)
a<-table.row.start(a)
a<-table.element(a, 'p-value',1,TRUE)
a<-table.element(a, 1-pf(mysum$fstatistic[1],mysum$fstatistic[2],mysum$fstatistic[3]))
a<-table.row.end(a)
a<-table.row.start(a)
a<-table.element(a, 'Multiple Linear Regression - Residual Statistics', 2, TRUE)
a<-table.row.end(a)
a<-table.row.start(a)
a<-table.element(a, 'Residual Standard Deviation',1,TRUE)
a<-table.element(a, mysum$sigma)
a<-table.row.end(a)
a<-table.row.start(a)
a<-table.element(a, 'Sum Squared Residuals',1,TRUE)
a<-table.element(a, sum(myerror*myerror))
a<-table.row.end(a)
a<-table.end(a)
table.save(a,file='mytable3.tab')
a<-table.start()
a<-table.row.start(a)
a<-table.element(a, 'Multiple Linear Regression - Actuals, Interpolation, and Residuals', 4, TRUE)
a<-table.row.end(a)
a<-table.row.start(a)
a<-table.element(a, 'Time or Index', 1, TRUE)
a<-table.element(a, 'Actuals', 1, TRUE)
a<-table.element(a, 'Interpolation
Forecast', 1, TRUE)
a<-table.element(a, 'Residuals
Prediction Error', 1, TRUE)
a<-table.row.end(a)
for (i in 1:n) {
a<-table.row.start(a)
a<-table.element(a,i, 1, TRUE)
a<-table.element(a,x[i])
a<-table.element(a,x[i]-mysum$resid[i])
a<-table.element(a,mysum$resid[i])
a<-table.row.end(a)
}
a<-table.end(a)
table.save(a,file='mytable4.tab')
if (n > n25) {
a<-table.start()
a<-table.row.start(a)
a<-table.element(a,'Goldfeld-Quandt test for Heteroskedasticity',4,TRUE)
a<-table.row.end(a)
a<-table.row.start(a)
a<-table.element(a,'p-values',header=TRUE)
a<-table.element(a,'Alternative Hypothesis',3,header=TRUE)
a<-table.row.end(a)
a<-table.row.start(a)
a<-table.element(a,'breakpoint index',header=TRUE)
a<-table.element(a,'greater',header=TRUE)
a<-table.element(a,'2-sided',header=TRUE)
a<-table.element(a,'less',header=TRUE)
a<-table.row.end(a)
for (mypoint in kp3:nmkm3) {
a<-table.row.start(a)
a<-table.element(a,mypoint,header=TRUE)
a<-table.element(a,gqarr[mypoint-kp3+1,1])
a<-table.element(a,gqarr[mypoint-kp3+1,2])
a<-table.element(a,gqarr[mypoint-kp3+1,3])
a<-table.row.end(a)
}
a<-table.end(a)
table.save(a,file='mytable5.tab')
a<-table.start()
a<-table.row.start(a)
a<-table.element(a,'Meta Analysis of Goldfeld-Quandt test for Heteroskedasticity',4,TRUE)
a<-table.row.end(a)
a<-table.row.start(a)
a<-table.element(a,'Description',header=TRUE)
a<-table.element(a,'# significant tests',header=TRUE)
a<-table.element(a,'% significant tests',header=TRUE)
a<-table.element(a,'OK/NOK',header=TRUE)
a<-table.row.end(a)
a<-table.row.start(a)
a<-table.element(a,'1% type I error level',header=TRUE)
a<-table.element(a,numsignificant1)
a<-table.element(a,numsignificant1/numgqtests)
if (numsignificant1/numgqtests < 0.01) dum <- 'OK' else dum <- 'NOK'
a<-table.element(a,dum)
a<-table.row.end(a)
a<-table.row.start(a)
a<-table.element(a,'5% type I error level',header=TRUE)
a<-table.element(a,numsignificant5)
a<-table.element(a,numsignificant5/numgqtests)
if (numsignificant5/numgqtests < 0.05) dum <- 'OK' else dum <- 'NOK'
a<-table.element(a,dum)
a<-table.row.end(a)
a<-table.row.start(a)
a<-table.element(a,'10% type I error level',header=TRUE)
a<-table.element(a,numsignificant10)
a<-table.element(a,numsignificant10/numgqtests)
if (numsignificant10/numgqtests < 0.1) dum <- 'OK' else dum <- 'NOK'
a<-table.element(a,dum)
a<-table.row.end(a)
a<-table.end(a)
table.save(a,file='mytable6.tab')
}