Free Statistics

of Irreproducible Research!

Author's title

Author*The author of this computation has been verified*
R Software Modulerwasp_multipleregression.wasp
Title produced by softwareMultiple Regression
Date of computationMon, 24 Nov 2008 04:08:30 -0700
Cite this page as followsStatistical Computations at FreeStatistics.org, Office for Research Development and Education, URL https://freestatistics.org/blog/index.php?v=date/2008/Nov/24/t12275249608lw2lsvzdrm1ir6.htm/, Retrieved Tue, 14 May 2024 21:33:30 +0000
Statistical Computations at FreeStatistics.org, Office for Research Development and Education, URL https://freestatistics.org/blog/index.php?pk=25398, Retrieved Tue, 14 May 2024 21:33:30 +0000
QR Codes:

Original text written by user:
IsPrivate?No (this computation is public)
User-defined keywords
Estimated Impact188
Family? (F = Feedback message, R = changed R code, M = changed R Module, P = changed Parameters, D = changed Data)
-     [Multiple Regression] [Q1 The Seatbeltlaw] [2007-11-14 19:27:43] [8cd6641b921d30ebe00b648d1481bba0]
F    D  [Multiple Regression] [Q1] [2008-11-24 10:40:07] [d134696a922d84037f02d49ded84b0bd]
F    D      [Multiple Regression] [Q3] [2008-11-24 11:08:30] [db9a5fd0f9c3e1245d8075d8bb09236d] [Current]
Feedback Forum
2008-11-30 17:32:49 [Ilknur Günes] [reply
Je hebt geen uitleg gegeven bij deze vraag. Je kon bijvoorbeeld zeker al vermelden waarom je vanaf 13714.7 als dummy variabele 1 hebt genomen. Speciale gebeurtenis?
Je kon ook nog je resultaten verklaren: je ziet bijvoorbeeld op de eerste grefiek een duidelijk stijgende trend.
2008-11-30 18:01:56 [Stijn Van de Velde] [reply
Hieruit kan je afleiden dat sinds de toedreding van Bulgarije en Roemenië in de EU in 2007 de uitvoer van belgie naar andere EU lidstaten maandelijks gemiddeld gedaald is met 137.

Dit lijkt me vreemd omdat je dan zou denken dat dit meer is.

Overigens kan je zien dat 83% van de schommelingen te verklaren zijn (zie Adjusted R-squared), wat op zich zeer goed is.
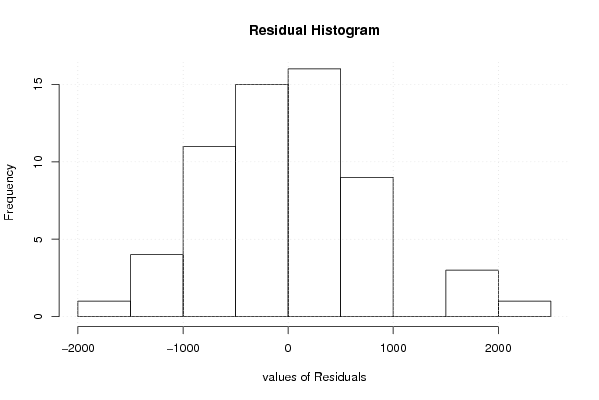
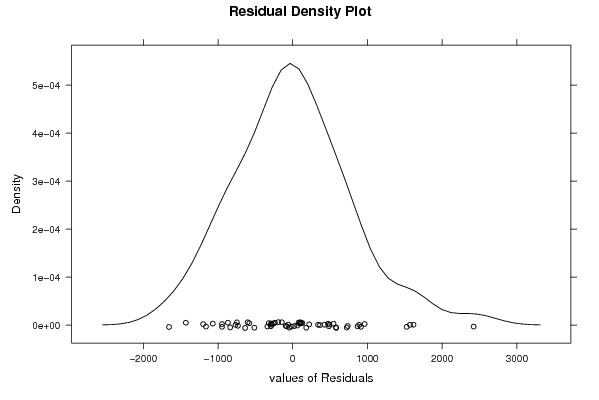
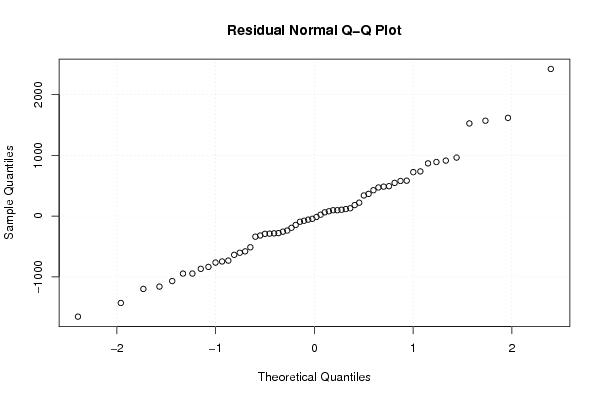
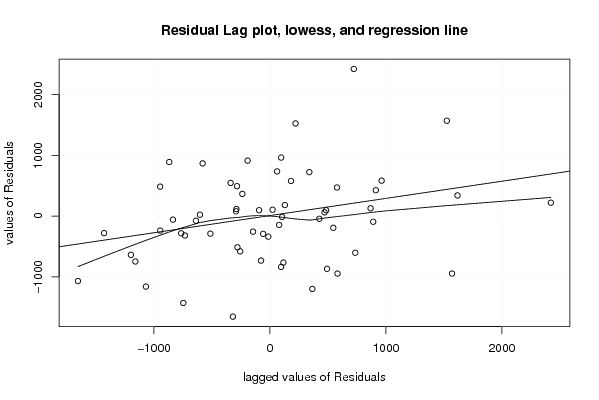
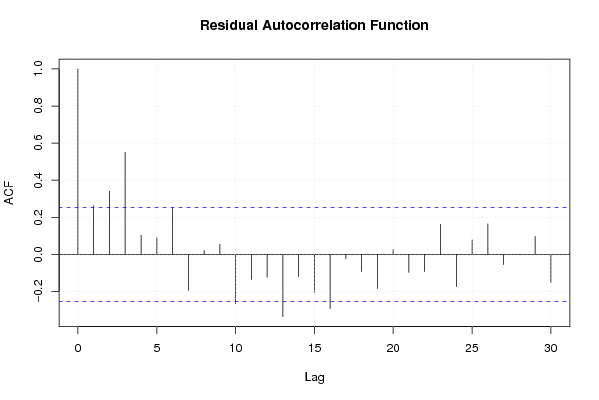
Jammer genoeg is ons toch niet goed genoeg, er is teveel autocorrelatie en geen volledige normaal verdeling (zie: de 4 assumpties.

Post a new message
Dataseries X:
8638,7	0
11063,7	0
11855,7	0
10684,5	0
11337,4	0
10478	0
11123,9	0
12909,3	0
11339,9	0
10462,2	0
12733,5	0
10519,2	0
10414,9	0
12476,8	0
12384,6	0
12266,7	0
12919,9	0
11497,3	0
12142	0
13919,4	0
12656,8	0
12034,1	0
13199,7	0
10881,3	0
11301,2	0
13643,9	0
12517	0
13981,1	0
14275,7	0
13435	0
13565,7	0
16216,3	0
12970	0
14079,9	0
14235	0
12213,4	0
12581	0
14130,4	0
14210,8	0
14378,5	0
13142,8	0
13714,7	1
13621,9	1
15379,8	1
13306,3	1
14391,2	1
14909,9	1
14025,4	1
12951,2	1
14344,3	1
16213,3	1
15544,5	1
14750,6	1
17292,7	1
17568,5	1
17930,8	1
18644,7	1
16694,8	1
17242,8	1
16979,9	1


Summary of computational transaction
Raw Inputview raw input (R code)
Raw Outputview raw output of R engine
Computing time5 seconds
R Server'Herman Ole Andreas Wold' @ 193.190.124.10:1001

\begin{tabular}{lllllllll}
\hline
Summary of computational transaction \tabularnewline
Raw Input & view raw input (R code)  \tabularnewline
Raw Output & view raw output of R engine  \tabularnewline
Computing time & 5 seconds \tabularnewline
R Server & 'Herman Ole Andreas Wold' @ 193.190.124.10:1001 \tabularnewline
\hline
\end{tabular}
%Source: https://freestatistics.org/blog/index.php?pk=25398&T=0

[TABLE]
[ROW][C]Summary of computational transaction[/C][/ROW]
[ROW][C]Raw Input[/C][C]view raw input (R code) [/C][/ROW]
[ROW][C]Raw Output[/C][C]view raw output of R engine [/C][/ROW]
[ROW][C]Computing time[/C][C]5 seconds[/C][/ROW]
[ROW][C]R Server[/C][C]'Herman Ole Andreas Wold' @ 193.190.124.10:1001[/C][/ROW]
[/TABLE]
Source: https://freestatistics.org/blog/index.php?pk=25398&T=0

Globally Unique Identifier (entire table): ba.freestatistics.org/blog/index.php?pk=25398&T=0

As an alternative you can also use a QR Code:  

The GUIDs for individual cells are displayed in the table below:

Summary of computational transaction
Raw Inputview raw input (R code)
Raw Outputview raw output of R engine
Computing time5 seconds
R Server'Herman Ole Andreas Wold' @ 193.190.124.10:1001


Multiple Linear Regression - Estimated Regression Equation
y[t] = + 9196.87601518027 -137.010626185959x[t] -618.301831119547M1[t] + 1231.06905123340M2[t] + 1430.47993358634M3[t] + 1260.21081593928M4[t] + 1069.38169829222M5[t] + 989.994705882353M6[t] + 1205.80558823529M7[t] + 2767.47647058823M8[t] + 1174.84735294118M9[t] + 818.698235294118M10[t] + 1645.38911764706M11[t] + 105.049117647059t + e[t]

\begin{tabular}{lllllllll}
\hline
Multiple Linear Regression - Estimated Regression Equation \tabularnewline
y[t] =  +  9196.87601518027 -137.010626185959x[t] -618.301831119547M1[t] +  1231.06905123340M2[t] +  1430.47993358634M3[t] +  1260.21081593928M4[t] +  1069.38169829222M5[t] +  989.994705882353M6[t] +  1205.80558823529M7[t] +  2767.47647058823M8[t] +  1174.84735294118M9[t] +  818.698235294118M10[t] +  1645.38911764706M11[t] +  105.049117647059t  + e[t] \tabularnewline
\hline
\end{tabular}
%Source: https://freestatistics.org/blog/index.php?pk=25398&T=1

[TABLE]
[ROW][C]Multiple Linear Regression - Estimated Regression Equation[/C][/ROW]
[ROW][C]y[t] =  +  9196.87601518027 -137.010626185959x[t] -618.301831119547M1[t] +  1231.06905123340M2[t] +  1430.47993358634M3[t] +  1260.21081593928M4[t] +  1069.38169829222M5[t] +  989.994705882353M6[t] +  1205.80558823529M7[t] +  2767.47647058823M8[t] +  1174.84735294118M9[t] +  818.698235294118M10[t] +  1645.38911764706M11[t] +  105.049117647059t  + e[t][/C][/ROW]
[/TABLE]
Source: https://freestatistics.org/blog/index.php?pk=25398&T=1

Globally Unique Identifier (entire table): ba.freestatistics.org/blog/index.php?pk=25398&T=1

As an alternative you can also use a QR Code:  

The GUIDs for individual cells are displayed in the table below:

Multiple Linear Regression - Estimated Regression Equation
y[t] = + 9196.87601518027 -137.010626185959x[t] -618.301831119547M1[t] + 1231.06905123340M2[t] + 1430.47993358634M3[t] + 1260.21081593928M4[t] + 1069.38169829222M5[t] + 989.994705882353M6[t] + 1205.80558823529M7[t] + 2767.47647058823M8[t] + 1174.84735294118M9[t] + 818.698235294118M10[t] + 1645.38911764706M11[t] + 105.049117647059t + e[t]


Multiple Linear Regression - Ordinary Least Squares
VariableParameterS.D.T-STATH0: parameter = 02-tail p-value1-tail p-value
(Intercept)9196.87601518027487.86574218.851200
x-137.010626185959420.147406-0.32610.7458270.372913
M1-618.301831119547561.92625-1.10030.2769150.138458
M21231.06905123340560.9109212.19480.0332660.016633
M31430.47993358634560.1199472.55390.0140310.007015
M41260.21081593928559.5542822.25220.0291280.014564
M51069.38169829222559.2146081.91230.0620780.031039
M6989.994705882353560.940061.76490.0842220.042111
M71205.80558823529559.6966642.15440.0364810.018241
M82767.47647058823558.6772834.95361e-055e-06
M91174.84735294118557.8831432.10590.04070.02035
M10818.698235294118557.3152071.4690.1486380.074319
M111645.38911764706556.9741682.95420.0049280.002464
t105.04911764705911.2548759.333700

\begin{tabular}{lllllllll}
\hline
Multiple Linear Regression - Ordinary Least Squares \tabularnewline
Variable & Parameter & S.D. & T-STATH0: parameter = 0 & 2-tail p-value & 1-tail p-value \tabularnewline
(Intercept) & 9196.87601518027 & 487.865742 & 18.8512 & 0 & 0 \tabularnewline
x & -137.010626185959 & 420.147406 & -0.3261 & 0.745827 & 0.372913 \tabularnewline
M1 & -618.301831119547 & 561.92625 & -1.1003 & 0.276915 & 0.138458 \tabularnewline
M2 & 1231.06905123340 & 560.910921 & 2.1948 & 0.033266 & 0.016633 \tabularnewline
M3 & 1430.47993358634 & 560.119947 & 2.5539 & 0.014031 & 0.007015 \tabularnewline
M4 & 1260.21081593928 & 559.554282 & 2.2522 & 0.029128 & 0.014564 \tabularnewline
M5 & 1069.38169829222 & 559.214608 & 1.9123 & 0.062078 & 0.031039 \tabularnewline
M6 & 989.994705882353 & 560.94006 & 1.7649 & 0.084222 & 0.042111 \tabularnewline
M7 & 1205.80558823529 & 559.696664 & 2.1544 & 0.036481 & 0.018241 \tabularnewline
M8 & 2767.47647058823 & 558.677283 & 4.9536 & 1e-05 & 5e-06 \tabularnewline
M9 & 1174.84735294118 & 557.883143 & 2.1059 & 0.0407 & 0.02035 \tabularnewline
M10 & 818.698235294118 & 557.315207 & 1.469 & 0.148638 & 0.074319 \tabularnewline
M11 & 1645.38911764706 & 556.974168 & 2.9542 & 0.004928 & 0.002464 \tabularnewline
t & 105.049117647059 & 11.254875 & 9.3337 & 0 & 0 \tabularnewline
\hline
\end{tabular}
%Source: https://freestatistics.org/blog/index.php?pk=25398&T=2

[TABLE]
[ROW][C]Multiple Linear Regression - Ordinary Least Squares[/C][/ROW]
[ROW][C]Variable[/C][C]Parameter[/C][C]S.D.[/C][C]T-STATH0: parameter = 0[/C][C]2-tail p-value[/C][C]1-tail p-value[/C][/ROW]
[ROW][C](Intercept)[/C][C]9196.87601518027[/C][C]487.865742[/C][C]18.8512[/C][C]0[/C][C]0[/C][/ROW]
[ROW][C]x[/C][C]-137.010626185959[/C][C]420.147406[/C][C]-0.3261[/C][C]0.745827[/C][C]0.372913[/C][/ROW]
[ROW][C]M1[/C][C]-618.301831119547[/C][C]561.92625[/C][C]-1.1003[/C][C]0.276915[/C][C]0.138458[/C][/ROW]
[ROW][C]M2[/C][C]1231.06905123340[/C][C]560.910921[/C][C]2.1948[/C][C]0.033266[/C][C]0.016633[/C][/ROW]
[ROW][C]M3[/C][C]1430.47993358634[/C][C]560.119947[/C][C]2.5539[/C][C]0.014031[/C][C]0.007015[/C][/ROW]
[ROW][C]M4[/C][C]1260.21081593928[/C][C]559.554282[/C][C]2.2522[/C][C]0.029128[/C][C]0.014564[/C][/ROW]
[ROW][C]M5[/C][C]1069.38169829222[/C][C]559.214608[/C][C]1.9123[/C][C]0.062078[/C][C]0.031039[/C][/ROW]
[ROW][C]M6[/C][C]989.994705882353[/C][C]560.94006[/C][C]1.7649[/C][C]0.084222[/C][C]0.042111[/C][/ROW]
[ROW][C]M7[/C][C]1205.80558823529[/C][C]559.696664[/C][C]2.1544[/C][C]0.036481[/C][C]0.018241[/C][/ROW]
[ROW][C]M8[/C][C]2767.47647058823[/C][C]558.677283[/C][C]4.9536[/C][C]1e-05[/C][C]5e-06[/C][/ROW]
[ROW][C]M9[/C][C]1174.84735294118[/C][C]557.883143[/C][C]2.1059[/C][C]0.0407[/C][C]0.02035[/C][/ROW]
[ROW][C]M10[/C][C]818.698235294118[/C][C]557.315207[/C][C]1.469[/C][C]0.148638[/C][C]0.074319[/C][/ROW]
[ROW][C]M11[/C][C]1645.38911764706[/C][C]556.974168[/C][C]2.9542[/C][C]0.004928[/C][C]0.002464[/C][/ROW]
[ROW][C]t[/C][C]105.049117647059[/C][C]11.254875[/C][C]9.3337[/C][C]0[/C][C]0[/C][/ROW]
[/TABLE]
Source: https://freestatistics.org/blog/index.php?pk=25398&T=2

Globally Unique Identifier (entire table): ba.freestatistics.org/blog/index.php?pk=25398&T=2

As an alternative you can also use a QR Code:  

The GUIDs for individual cells are displayed in the table below:

Multiple Linear Regression - Ordinary Least Squares
VariableParameterS.D.T-STATH0: parameter = 02-tail p-value1-tail p-value
(Intercept)9196.87601518027487.86574218.851200
x-137.010626185959420.147406-0.32610.7458270.372913
M1-618.301831119547561.92625-1.10030.2769150.138458
M21231.06905123340560.9109212.19480.0332660.016633
M31430.47993358634560.1199472.55390.0140310.007015
M41260.21081593928559.5542822.25220.0291280.014564
M51069.38169829222559.2146081.91230.0620780.031039
M6989.994705882353560.940061.76490.0842220.042111
M71205.80558823529559.6966642.15440.0364810.018241
M82767.47647058823558.6772834.95361e-055e-06
M91174.84735294118557.8831432.10590.04070.02035
M10818.698235294118557.3152071.4690.1486380.074319
M111645.38911764706556.9741682.95420.0049280.002464
t105.04911764705911.2548759.333700


Multiple Linear Regression - Regression Statistics
Multiple R0.930644670268518
R-squared0.866099502299199
Adjusted R-squared0.828258057296799
F-TEST (value)22.8875906362524
F-TEST (DF numerator)13
F-TEST (DF denominator)46
p-value8.88178419700125e-16
Multiple Linear Regression - Residual Statistics
Residual Standard Deviation880.47366671941
Sum Squared Residuals35660758.3781708

\begin{tabular}{lllllllll}
\hline
Multiple Linear Regression - Regression Statistics \tabularnewline
Multiple R & 0.930644670268518 \tabularnewline
R-squared & 0.866099502299199 \tabularnewline
Adjusted R-squared & 0.828258057296799 \tabularnewline
F-TEST (value) & 22.8875906362524 \tabularnewline
F-TEST (DF numerator) & 13 \tabularnewline
F-TEST (DF denominator) & 46 \tabularnewline
p-value & 8.88178419700125e-16 \tabularnewline
Multiple Linear Regression - Residual Statistics \tabularnewline
Residual Standard Deviation & 880.47366671941 \tabularnewline
Sum Squared Residuals & 35660758.3781708 \tabularnewline
\hline
\end{tabular}
%Source: https://freestatistics.org/blog/index.php?pk=25398&T=3

[TABLE]
[ROW][C]Multiple Linear Regression - Regression Statistics[/C][/ROW]
[ROW][C]Multiple R[/C][C]0.930644670268518[/C][/ROW]
[ROW][C]R-squared[/C][C]0.866099502299199[/C][/ROW]
[ROW][C]Adjusted R-squared[/C][C]0.828258057296799[/C][/ROW]
[ROW][C]F-TEST (value)[/C][C]22.8875906362524[/C][/ROW]
[ROW][C]F-TEST (DF numerator)[/C][C]13[/C][/ROW]
[ROW][C]F-TEST (DF denominator)[/C][C]46[/C][/ROW]
[ROW][C]p-value[/C][C]8.88178419700125e-16[/C][/ROW]
[ROW][C]Multiple Linear Regression - Residual Statistics[/C][/ROW]
[ROW][C]Residual Standard Deviation[/C][C]880.47366671941[/C][/ROW]
[ROW][C]Sum Squared Residuals[/C][C]35660758.3781708[/C][/ROW]
[/TABLE]
Source: https://freestatistics.org/blog/index.php?pk=25398&T=3

Globally Unique Identifier (entire table): ba.freestatistics.org/blog/index.php?pk=25398&T=3

As an alternative you can also use a QR Code:  

The GUIDs for individual cells are displayed in the table below:

Multiple Linear Regression - Regression Statistics
Multiple R0.930644670268518
R-squared0.866099502299199
Adjusted R-squared0.828258057296799
F-TEST (value)22.8875906362524
F-TEST (DF numerator)13
F-TEST (DF denominator)46
p-value8.88178419700125e-16
Multiple Linear Regression - Residual Statistics
Residual Standard Deviation880.47366671941
Sum Squared Residuals35660758.3781708


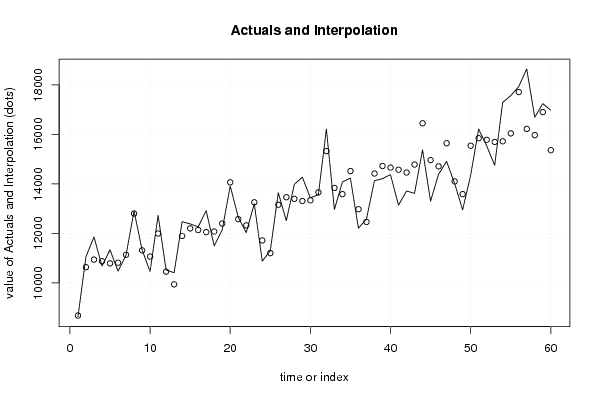
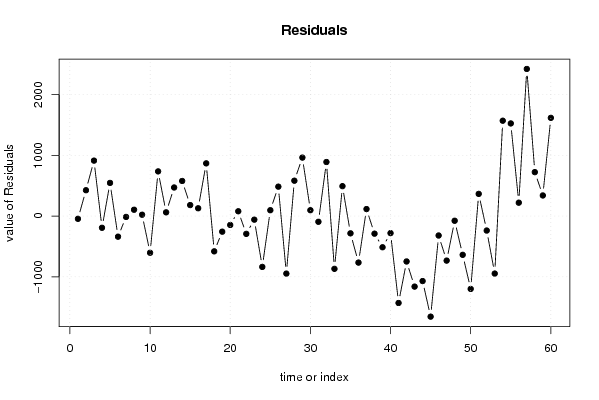
Multiple Linear Regression - Actuals, Interpolation, and Residuals
Time or IndexActualsInterpolationForecastResidualsPrediction Error
18638.78683.6233017078-44.9233017077905
211063.710638.0433017078425.656698292222
311855.710942.5033017078913.196698292222
410684.510877.2833017078-192.783301707781
511337.410791.5033017078545.896698292221
61047810817.1654269450-339.165426944971
711123.911138.0254269450-14.1254269449718
812909.312804.7454269450104.554573055028
911339.911317.165426945022.7345730550294
1010462.211066.0654269450-603.86542694497
1112733.511997.8054269450735.694573055029
1210519.210457.465426945061.7345730550297
1310414.99944.21271347248470.687286527517
1412476.811898.6327134725578.167286527514
1512384.612203.0927134725181.507286527515
1612266.712137.8727134725128.827286527515
1712919.912052.0927134725867.807286527514
1811497.312077.7548387097-580.454838709678
191214212398.6148387097-256.614838709677
2013919.414065.3348387097-145.934838709677
2112656.812577.754838709779.0451612903225
2212034.112326.6548387097-292.554838709677
2313199.713258.3948387097-58.6948387096761
2410881.311718.0548387097-836.754838709678
2511301.211204.802125237296.3978747628114
2613643.913159.2221252372484.677874762808
271251713463.6821252372-946.682125237192
2813981.113398.4621252372582.637874762808
2914275.713312.6821252372963.017874762809
301343513338.344250474496.6557495256166
3113565.713659.2042504744-93.5042504743822
3216216.315325.9242504744890.375749525617
331297013838.3442504744-868.344250474384
3414079.913587.2442504744492.655749525616
351423514518.9842504744-283.984250474384
3612213.412978.6442504744-765.244250474385
371258112465.3915370019115.608462998104
3814130.414419.8115370019-289.411537001898
3914210.814724.2715370019-513.471537001899
4014378.514659.0515370019-280.551537001897
4113142.814573.2715370019-1430.4715370019
4213714.714461.9230360531-747.22303605313
4313621.914782.7830360531-1160.88303605313
4415379.816449.5030360531-1069.70303605313
4513306.314961.9230360531-1655.62303605313
4614391.214710.8230360531-319.62303605313
4714909.915642.5630360531-732.663036053131
4814025.414102.2230360531-76.8230360531314
4912951.213588.9703225806-637.770322580642
5014344.315543.3903225806-1199.09032258065
5116213.315847.8503225806365.449677419354
5215544.515782.6303225806-238.130322580645
5314750.615696.8503225806-946.250322580644
5417292.715722.51244781781570.18755218216
5517568.516043.37244781781525.12755218216
5617930.817710.0924478178220.707552182163
5718644.716222.51244781782422.18755218216
5816694.815971.4124478178723.387552182162
5917242.816903.1524478178339.647552182162
6016979.915362.81244781781617.08755218216

\begin{tabular}{lllllllll}
\hline
Multiple Linear Regression - Actuals, Interpolation, and Residuals \tabularnewline
Time or Index & Actuals & InterpolationForecast & ResidualsPrediction Error \tabularnewline
1 & 8638.7 & 8683.6233017078 & -44.9233017077905 \tabularnewline
2 & 11063.7 & 10638.0433017078 & 425.656698292222 \tabularnewline
3 & 11855.7 & 10942.5033017078 & 913.196698292222 \tabularnewline
4 & 10684.5 & 10877.2833017078 & -192.783301707781 \tabularnewline
5 & 11337.4 & 10791.5033017078 & 545.896698292221 \tabularnewline
6 & 10478 & 10817.1654269450 & -339.165426944971 \tabularnewline
7 & 11123.9 & 11138.0254269450 & -14.1254269449718 \tabularnewline
8 & 12909.3 & 12804.7454269450 & 104.554573055028 \tabularnewline
9 & 11339.9 & 11317.1654269450 & 22.7345730550294 \tabularnewline
10 & 10462.2 & 11066.0654269450 & -603.86542694497 \tabularnewline
11 & 12733.5 & 11997.8054269450 & 735.694573055029 \tabularnewline
12 & 10519.2 & 10457.4654269450 & 61.7345730550297 \tabularnewline
13 & 10414.9 & 9944.21271347248 & 470.687286527517 \tabularnewline
14 & 12476.8 & 11898.6327134725 & 578.167286527514 \tabularnewline
15 & 12384.6 & 12203.0927134725 & 181.507286527515 \tabularnewline
16 & 12266.7 & 12137.8727134725 & 128.827286527515 \tabularnewline
17 & 12919.9 & 12052.0927134725 & 867.807286527514 \tabularnewline
18 & 11497.3 & 12077.7548387097 & -580.454838709678 \tabularnewline
19 & 12142 & 12398.6148387097 & -256.614838709677 \tabularnewline
20 & 13919.4 & 14065.3348387097 & -145.934838709677 \tabularnewline
21 & 12656.8 & 12577.7548387097 & 79.0451612903225 \tabularnewline
22 & 12034.1 & 12326.6548387097 & -292.554838709677 \tabularnewline
23 & 13199.7 & 13258.3948387097 & -58.6948387096761 \tabularnewline
24 & 10881.3 & 11718.0548387097 & -836.754838709678 \tabularnewline
25 & 11301.2 & 11204.8021252372 & 96.3978747628114 \tabularnewline
26 & 13643.9 & 13159.2221252372 & 484.677874762808 \tabularnewline
27 & 12517 & 13463.6821252372 & -946.682125237192 \tabularnewline
28 & 13981.1 & 13398.4621252372 & 582.637874762808 \tabularnewline
29 & 14275.7 & 13312.6821252372 & 963.017874762809 \tabularnewline
30 & 13435 & 13338.3442504744 & 96.6557495256166 \tabularnewline
31 & 13565.7 & 13659.2042504744 & -93.5042504743822 \tabularnewline
32 & 16216.3 & 15325.9242504744 & 890.375749525617 \tabularnewline
33 & 12970 & 13838.3442504744 & -868.344250474384 \tabularnewline
34 & 14079.9 & 13587.2442504744 & 492.655749525616 \tabularnewline
35 & 14235 & 14518.9842504744 & -283.984250474384 \tabularnewline
36 & 12213.4 & 12978.6442504744 & -765.244250474385 \tabularnewline
37 & 12581 & 12465.3915370019 & 115.608462998104 \tabularnewline
38 & 14130.4 & 14419.8115370019 & -289.411537001898 \tabularnewline
39 & 14210.8 & 14724.2715370019 & -513.471537001899 \tabularnewline
40 & 14378.5 & 14659.0515370019 & -280.551537001897 \tabularnewline
41 & 13142.8 & 14573.2715370019 & -1430.4715370019 \tabularnewline
42 & 13714.7 & 14461.9230360531 & -747.22303605313 \tabularnewline
43 & 13621.9 & 14782.7830360531 & -1160.88303605313 \tabularnewline
44 & 15379.8 & 16449.5030360531 & -1069.70303605313 \tabularnewline
45 & 13306.3 & 14961.9230360531 & -1655.62303605313 \tabularnewline
46 & 14391.2 & 14710.8230360531 & -319.62303605313 \tabularnewline
47 & 14909.9 & 15642.5630360531 & -732.663036053131 \tabularnewline
48 & 14025.4 & 14102.2230360531 & -76.8230360531314 \tabularnewline
49 & 12951.2 & 13588.9703225806 & -637.770322580642 \tabularnewline
50 & 14344.3 & 15543.3903225806 & -1199.09032258065 \tabularnewline
51 & 16213.3 & 15847.8503225806 & 365.449677419354 \tabularnewline
52 & 15544.5 & 15782.6303225806 & -238.130322580645 \tabularnewline
53 & 14750.6 & 15696.8503225806 & -946.250322580644 \tabularnewline
54 & 17292.7 & 15722.5124478178 & 1570.18755218216 \tabularnewline
55 & 17568.5 & 16043.3724478178 & 1525.12755218216 \tabularnewline
56 & 17930.8 & 17710.0924478178 & 220.707552182163 \tabularnewline
57 & 18644.7 & 16222.5124478178 & 2422.18755218216 \tabularnewline
58 & 16694.8 & 15971.4124478178 & 723.387552182162 \tabularnewline
59 & 17242.8 & 16903.1524478178 & 339.647552182162 \tabularnewline
60 & 16979.9 & 15362.8124478178 & 1617.08755218216 \tabularnewline
\hline
\end{tabular}
%Source: https://freestatistics.org/blog/index.php?pk=25398&T=4

[TABLE]
[ROW][C]Multiple Linear Regression - Actuals, Interpolation, and Residuals[/C][/ROW]
[ROW][C]Time or Index[/C][C]Actuals[/C][C]InterpolationForecast[/C][C]ResidualsPrediction Error[/C][/ROW]
[ROW][C]1[/C][C]8638.7[/C][C]8683.6233017078[/C][C]-44.9233017077905[/C][/ROW]
[ROW][C]2[/C][C]11063.7[/C][C]10638.0433017078[/C][C]425.656698292222[/C][/ROW]
[ROW][C]3[/C][C]11855.7[/C][C]10942.5033017078[/C][C]913.196698292222[/C][/ROW]
[ROW][C]4[/C][C]10684.5[/C][C]10877.2833017078[/C][C]-192.783301707781[/C][/ROW]
[ROW][C]5[/C][C]11337.4[/C][C]10791.5033017078[/C][C]545.896698292221[/C][/ROW]
[ROW][C]6[/C][C]10478[/C][C]10817.1654269450[/C][C]-339.165426944971[/C][/ROW]
[ROW][C]7[/C][C]11123.9[/C][C]11138.0254269450[/C][C]-14.1254269449718[/C][/ROW]
[ROW][C]8[/C][C]12909.3[/C][C]12804.7454269450[/C][C]104.554573055028[/C][/ROW]
[ROW][C]9[/C][C]11339.9[/C][C]11317.1654269450[/C][C]22.7345730550294[/C][/ROW]
[ROW][C]10[/C][C]10462.2[/C][C]11066.0654269450[/C][C]-603.86542694497[/C][/ROW]
[ROW][C]11[/C][C]12733.5[/C][C]11997.8054269450[/C][C]735.694573055029[/C][/ROW]
[ROW][C]12[/C][C]10519.2[/C][C]10457.4654269450[/C][C]61.7345730550297[/C][/ROW]
[ROW][C]13[/C][C]10414.9[/C][C]9944.21271347248[/C][C]470.687286527517[/C][/ROW]
[ROW][C]14[/C][C]12476.8[/C][C]11898.6327134725[/C][C]578.167286527514[/C][/ROW]
[ROW][C]15[/C][C]12384.6[/C][C]12203.0927134725[/C][C]181.507286527515[/C][/ROW]
[ROW][C]16[/C][C]12266.7[/C][C]12137.8727134725[/C][C]128.827286527515[/C][/ROW]
[ROW][C]17[/C][C]12919.9[/C][C]12052.0927134725[/C][C]867.807286527514[/C][/ROW]
[ROW][C]18[/C][C]11497.3[/C][C]12077.7548387097[/C][C]-580.454838709678[/C][/ROW]
[ROW][C]19[/C][C]12142[/C][C]12398.6148387097[/C][C]-256.614838709677[/C][/ROW]
[ROW][C]20[/C][C]13919.4[/C][C]14065.3348387097[/C][C]-145.934838709677[/C][/ROW]
[ROW][C]21[/C][C]12656.8[/C][C]12577.7548387097[/C][C]79.0451612903225[/C][/ROW]
[ROW][C]22[/C][C]12034.1[/C][C]12326.6548387097[/C][C]-292.554838709677[/C][/ROW]
[ROW][C]23[/C][C]13199.7[/C][C]13258.3948387097[/C][C]-58.6948387096761[/C][/ROW]
[ROW][C]24[/C][C]10881.3[/C][C]11718.0548387097[/C][C]-836.754838709678[/C][/ROW]
[ROW][C]25[/C][C]11301.2[/C][C]11204.8021252372[/C][C]96.3978747628114[/C][/ROW]
[ROW][C]26[/C][C]13643.9[/C][C]13159.2221252372[/C][C]484.677874762808[/C][/ROW]
[ROW][C]27[/C][C]12517[/C][C]13463.6821252372[/C][C]-946.682125237192[/C][/ROW]
[ROW][C]28[/C][C]13981.1[/C][C]13398.4621252372[/C][C]582.637874762808[/C][/ROW]
[ROW][C]29[/C][C]14275.7[/C][C]13312.6821252372[/C][C]963.017874762809[/C][/ROW]
[ROW][C]30[/C][C]13435[/C][C]13338.3442504744[/C][C]96.6557495256166[/C][/ROW]
[ROW][C]31[/C][C]13565.7[/C][C]13659.2042504744[/C][C]-93.5042504743822[/C][/ROW]
[ROW][C]32[/C][C]16216.3[/C][C]15325.9242504744[/C][C]890.375749525617[/C][/ROW]
[ROW][C]33[/C][C]12970[/C][C]13838.3442504744[/C][C]-868.344250474384[/C][/ROW]
[ROW][C]34[/C][C]14079.9[/C][C]13587.2442504744[/C][C]492.655749525616[/C][/ROW]
[ROW][C]35[/C][C]14235[/C][C]14518.9842504744[/C][C]-283.984250474384[/C][/ROW]
[ROW][C]36[/C][C]12213.4[/C][C]12978.6442504744[/C][C]-765.244250474385[/C][/ROW]
[ROW][C]37[/C][C]12581[/C][C]12465.3915370019[/C][C]115.608462998104[/C][/ROW]
[ROW][C]38[/C][C]14130.4[/C][C]14419.8115370019[/C][C]-289.411537001898[/C][/ROW]
[ROW][C]39[/C][C]14210.8[/C][C]14724.2715370019[/C][C]-513.471537001899[/C][/ROW]
[ROW][C]40[/C][C]14378.5[/C][C]14659.0515370019[/C][C]-280.551537001897[/C][/ROW]
[ROW][C]41[/C][C]13142.8[/C][C]14573.2715370019[/C][C]-1430.4715370019[/C][/ROW]
[ROW][C]42[/C][C]13714.7[/C][C]14461.9230360531[/C][C]-747.22303605313[/C][/ROW]
[ROW][C]43[/C][C]13621.9[/C][C]14782.7830360531[/C][C]-1160.88303605313[/C][/ROW]
[ROW][C]44[/C][C]15379.8[/C][C]16449.5030360531[/C][C]-1069.70303605313[/C][/ROW]
[ROW][C]45[/C][C]13306.3[/C][C]14961.9230360531[/C][C]-1655.62303605313[/C][/ROW]
[ROW][C]46[/C][C]14391.2[/C][C]14710.8230360531[/C][C]-319.62303605313[/C][/ROW]
[ROW][C]47[/C][C]14909.9[/C][C]15642.5630360531[/C][C]-732.663036053131[/C][/ROW]
[ROW][C]48[/C][C]14025.4[/C][C]14102.2230360531[/C][C]-76.8230360531314[/C][/ROW]
[ROW][C]49[/C][C]12951.2[/C][C]13588.9703225806[/C][C]-637.770322580642[/C][/ROW]
[ROW][C]50[/C][C]14344.3[/C][C]15543.3903225806[/C][C]-1199.09032258065[/C][/ROW]
[ROW][C]51[/C][C]16213.3[/C][C]15847.8503225806[/C][C]365.449677419354[/C][/ROW]
[ROW][C]52[/C][C]15544.5[/C][C]15782.6303225806[/C][C]-238.130322580645[/C][/ROW]
[ROW][C]53[/C][C]14750.6[/C][C]15696.8503225806[/C][C]-946.250322580644[/C][/ROW]
[ROW][C]54[/C][C]17292.7[/C][C]15722.5124478178[/C][C]1570.18755218216[/C][/ROW]
[ROW][C]55[/C][C]17568.5[/C][C]16043.3724478178[/C][C]1525.12755218216[/C][/ROW]
[ROW][C]56[/C][C]17930.8[/C][C]17710.0924478178[/C][C]220.707552182163[/C][/ROW]
[ROW][C]57[/C][C]18644.7[/C][C]16222.5124478178[/C][C]2422.18755218216[/C][/ROW]
[ROW][C]58[/C][C]16694.8[/C][C]15971.4124478178[/C][C]723.387552182162[/C][/ROW]
[ROW][C]59[/C][C]17242.8[/C][C]16903.1524478178[/C][C]339.647552182162[/C][/ROW]
[ROW][C]60[/C][C]16979.9[/C][C]15362.8124478178[/C][C]1617.08755218216[/C][/ROW]
[/TABLE]
Source: https://freestatistics.org/blog/index.php?pk=25398&T=4

Globally Unique Identifier (entire table): ba.freestatistics.org/blog/index.php?pk=25398&T=4

As an alternative you can also use a QR Code:  

The GUIDs for individual cells are displayed in the table below:

Multiple Linear Regression - Actuals, Interpolation, and Residuals
Time or IndexActualsInterpolationForecastResidualsPrediction Error
18638.78683.6233017078-44.9233017077905
211063.710638.0433017078425.656698292222
311855.710942.5033017078913.196698292222
410684.510877.2833017078-192.783301707781
511337.410791.5033017078545.896698292221
61047810817.1654269450-339.165426944971
711123.911138.0254269450-14.1254269449718
812909.312804.7454269450104.554573055028
911339.911317.165426945022.7345730550294
1010462.211066.0654269450-603.86542694497
1112733.511997.8054269450735.694573055029
1210519.210457.465426945061.7345730550297
1310414.99944.21271347248470.687286527517
1412476.811898.6327134725578.167286527514
1512384.612203.0927134725181.507286527515
1612266.712137.8727134725128.827286527515
1712919.912052.0927134725867.807286527514
1811497.312077.7548387097-580.454838709678
191214212398.6148387097-256.614838709677
2013919.414065.3348387097-145.934838709677
2112656.812577.754838709779.0451612903225
2212034.112326.6548387097-292.554838709677
2313199.713258.3948387097-58.6948387096761
2410881.311718.0548387097-836.754838709678
2511301.211204.802125237296.3978747628114
2613643.913159.2221252372484.677874762808
271251713463.6821252372-946.682125237192
2813981.113398.4621252372582.637874762808
2914275.713312.6821252372963.017874762809
301343513338.344250474496.6557495256166
3113565.713659.2042504744-93.5042504743822
3216216.315325.9242504744890.375749525617
331297013838.3442504744-868.344250474384
3414079.913587.2442504744492.655749525616
351423514518.9842504744-283.984250474384
3612213.412978.6442504744-765.244250474385
371258112465.3915370019115.608462998104
3814130.414419.8115370019-289.411537001898
3914210.814724.2715370019-513.471537001899
4014378.514659.0515370019-280.551537001897
4113142.814573.2715370019-1430.4715370019
4213714.714461.9230360531-747.22303605313
4313621.914782.7830360531-1160.88303605313
4415379.816449.5030360531-1069.70303605313
4513306.314961.9230360531-1655.62303605313
4614391.214710.8230360531-319.62303605313
4714909.915642.5630360531-732.663036053131
4814025.414102.2230360531-76.8230360531314
4912951.213588.9703225806-637.770322580642
5014344.315543.3903225806-1199.09032258065
5116213.315847.8503225806365.449677419354
5215544.515782.6303225806-238.130322580645
5314750.615696.8503225806-946.250322580644
5417292.715722.51244781781570.18755218216
5517568.516043.37244781781525.12755218216
5617930.817710.0924478178220.707552182163
5718644.716222.51244781782422.18755218216
5816694.815971.4124478178723.387552182162
5917242.816903.1524478178339.647552182162
6016979.915362.81244781781617.08755218216


Parameters (Session):
par1 = 1 ; par2 = Include Monthly Dummies ; par3 = Linear Trend ;
Parameters (R input):
par1 = 1 ; par2 = Include Monthly Dummies ; par3 = Linear Trend ;
R code (references can be found in the software module):
library(lattice)
par1 <- as.numeric(par1)
x <- t(y)
k <- length(x[1,])
n <- length(x[,1])
x1 <- cbind(x[,par1], x[,1:k!=par1])
mycolnames <- c(colnames(x)[par1], colnames(x)[1:k!=par1])
colnames(x1) <- mycolnames #colnames(x)[par1]
x <- x1
if (par3 == 'First Differences'){
x2 <- array(0, dim=c(n-1,k), dimnames=list(1:(n-1), paste('(1-B)',colnames(x),sep='')))
for (i in 1:n-1) {
for (j in 1:k) {
x2[i,j] <- x[i+1,j] - x[i,j]
}
}
x <- x2
}
if (par2 == 'Include Monthly Dummies'){
x2 <- array(0, dim=c(n,11), dimnames=list(1:n, paste('M', seq(1:11), sep ='')))
for (i in 1:11){
x2[seq(i,n,12),i] <- 1
}
x <- cbind(x, x2)
}
if (par2 == 'Include Quarterly Dummies'){
x2 <- array(0, dim=c(n,3), dimnames=list(1:n, paste('Q', seq(1:3), sep ='')))
for (i in 1:3){
x2[seq(i,n,4),i] <- 1
}
x <- cbind(x, x2)
}
k <- length(x[1,])
if (par3 == 'Linear Trend'){
x <- cbind(x, c(1:n))
colnames(x)[k+1] <- 't'
}
x
k <- length(x[1,])
df <- as.data.frame(x)
(mylm <- lm(df))
(mysum <- summary(mylm))
bitmap(file='test0.png')
plot(x[,1], type='l', main='Actuals and Interpolation', ylab='value of Actuals and Interpolation (dots)', xlab='time or index')
points(x[,1]-mysum$resid)
grid()
dev.off()
bitmap(file='test1.png')
plot(mysum$resid, type='b', pch=19, main='Residuals', ylab='value of Residuals', xlab='time or index')
grid()
dev.off()
bitmap(file='test2.png')
hist(mysum$resid, main='Residual Histogram', xlab='values of Residuals')
grid()
dev.off()
bitmap(file='test3.png')
densityplot(~mysum$resid,col='black',main='Residual Density Plot', xlab='values of Residuals')
dev.off()
bitmap(file='test4.png')
qqnorm(mysum$resid, main='Residual Normal Q-Q Plot')
grid()
dev.off()
(myerror <- as.ts(mysum$resid))
bitmap(file='test5.png')
dum <- cbind(lag(myerror,k=1),myerror)
dum
dum1 <- dum[2:length(myerror),]
dum1
z <- as.data.frame(dum1)
z
plot(z,main=paste('Residual Lag plot, lowess, and regression line'), ylab='values of Residuals', xlab='lagged values of Residuals')
lines(lowess(z))
abline(lm(z))
grid()
dev.off()
bitmap(file='test6.png')
acf(mysum$resid, lag.max=length(mysum$resid)/2, main='Residual Autocorrelation Function')
grid()
dev.off()
bitmap(file='test7.png')
pacf(mysum$resid, lag.max=length(mysum$resid)/2, main='Residual Partial Autocorrelation Function')
grid()
dev.off()
bitmap(file='test8.png')
opar <- par(mfrow = c(2,2), oma = c(0, 0, 1.1, 0))
plot(mylm, las = 1, sub='Residual Diagnostics')
par(opar)
dev.off()
load(file='createtable')
a<-table.start()
a<-table.row.start(a)
a<-table.element(a, 'Multiple Linear Regression - Estimated Regression Equation', 1, TRUE)
a<-table.row.end(a)
myeq <- colnames(x)[1]
myeq <- paste(myeq, '[t] = ', sep='')
for (i in 1:k){
if (mysum$coefficients[i,1] > 0) myeq <- paste(myeq, '+', '')
myeq <- paste(myeq, mysum$coefficients[i,1], sep=' ')
if (rownames(mysum$coefficients)[i] != '(Intercept)') {
myeq <- paste(myeq, rownames(mysum$coefficients)[i], sep='')
if (rownames(mysum$coefficients)[i] != 't') myeq <- paste(myeq, '[t]', sep='')
}
}
myeq <- paste(myeq, ' + e[t]')
a<-table.row.start(a)
a<-table.element(a, myeq)
a<-table.row.end(a)
a<-table.end(a)
table.save(a,file='mytable1.tab')
a<-table.start()
a<-table.row.start(a)
a<-table.element(a,hyperlink('ols1.htm','Multiple Linear Regression - Ordinary Least Squares',''), 6, TRUE)
a<-table.row.end(a)
a<-table.row.start(a)
a<-table.element(a,'Variable',header=TRUE)
a<-table.element(a,'Parameter',header=TRUE)
a<-table.element(a,'S.D.',header=TRUE)
a<-table.element(a,'T-STAT
H0: parameter = 0',header=TRUE)
a<-table.element(a,'2-tail p-value',header=TRUE)
a<-table.element(a,'1-tail p-value',header=TRUE)
a<-table.row.end(a)
for (i in 1:k){
a<-table.row.start(a)
a<-table.element(a,rownames(mysum$coefficients)[i],header=TRUE)
a<-table.element(a,mysum$coefficients[i,1])
a<-table.element(a, round(mysum$coefficients[i,2],6))
a<-table.element(a, round(mysum$coefficients[i,3],4))
a<-table.element(a, round(mysum$coefficients[i,4],6))
a<-table.element(a, round(mysum$coefficients[i,4]/2,6))
a<-table.row.end(a)
}
a<-table.end(a)
table.save(a,file='mytable2.tab')
a<-table.start()
a<-table.row.start(a)
a<-table.element(a, 'Multiple Linear Regression - Regression Statistics', 2, TRUE)
a<-table.row.end(a)
a<-table.row.start(a)
a<-table.element(a, 'Multiple R',1,TRUE)
a<-table.element(a, sqrt(mysum$r.squared))
a<-table.row.end(a)
a<-table.row.start(a)
a<-table.element(a, 'R-squared',1,TRUE)
a<-table.element(a, mysum$r.squared)
a<-table.row.end(a)
a<-table.row.start(a)
a<-table.element(a, 'Adjusted R-squared',1,TRUE)
a<-table.element(a, mysum$adj.r.squared)
a<-table.row.end(a)
a<-table.row.start(a)
a<-table.element(a, 'F-TEST (value)',1,TRUE)
a<-table.element(a, mysum$fstatistic[1])
a<-table.row.end(a)
a<-table.row.start(a)
a<-table.element(a, 'F-TEST (DF numerator)',1,TRUE)
a<-table.element(a, mysum$fstatistic[2])
a<-table.row.end(a)
a<-table.row.start(a)
a<-table.element(a, 'F-TEST (DF denominator)',1,TRUE)
a<-table.element(a, mysum$fstatistic[3])
a<-table.row.end(a)
a<-table.row.start(a)
a<-table.element(a, 'p-value',1,TRUE)
a<-table.element(a, 1-pf(mysum$fstatistic[1],mysum$fstatistic[2],mysum$fstatistic[3]))
a<-table.row.end(a)
a<-table.row.start(a)
a<-table.element(a, 'Multiple Linear Regression - Residual Statistics', 2, TRUE)
a<-table.row.end(a)
a<-table.row.start(a)
a<-table.element(a, 'Residual Standard Deviation',1,TRUE)
a<-table.element(a, mysum$sigma)
a<-table.row.end(a)
a<-table.row.start(a)
a<-table.element(a, 'Sum Squared Residuals',1,TRUE)
a<-table.element(a, sum(myerror*myerror))
a<-table.row.end(a)
a<-table.end(a)
table.save(a,file='mytable3.tab')
a<-table.start()
a<-table.row.start(a)
a<-table.element(a, 'Multiple Linear Regression - Actuals, Interpolation, and Residuals', 4, TRUE)
a<-table.row.end(a)
a<-table.row.start(a)
a<-table.element(a, 'Time or Index', 1, TRUE)
a<-table.element(a, 'Actuals', 1, TRUE)
a<-table.element(a, 'Interpolation
Forecast', 1, TRUE)
a<-table.element(a, 'Residuals
Prediction Error', 1, TRUE)
a<-table.row.end(a)
for (i in 1:n) {
a<-table.row.start(a)
a<-table.element(a,i, 1, TRUE)
a<-table.element(a,x[i])
a<-table.element(a,x[i]-mysum$resid[i])
a<-table.element(a,mysum$resid[i])
a<-table.row.end(a)
}
a<-table.end(a)
table.save(a,file='mytable4.tab')