Free Statistics

of Irreproducible Research!

Author's title

Author*The author of this computation has been verified*
R Software Modulerwasp_multipleregression.wasp
Title produced by softwareMultiple Regression
Date of computationSun, 23 Nov 2008 13:12:15 -0700
Cite this page as followsStatistical Computations at FreeStatistics.org, Office for Research Development and Education, URL https://freestatistics.org/blog/index.php?v=date/2008/Nov/23/t1227471228jx2php97kz8tifg.htm/, Retrieved Mon, 20 May 2024 07:31:11 +0000
Statistical Computations at FreeStatistics.org, Office for Research Development and Education, URL https://freestatistics.org/blog/index.php?pk=25336, Retrieved Mon, 20 May 2024 07:31:11 +0000
QR Codes:

Original text written by user:
IsPrivate?No (this computation is public)
User-defined keywordsSeatbelt Q3 2
Estimated Impact111
Family? (F = Feedback message, R = changed R code, M = changed R Module, P = changed Parameters, D = changed Data)
F       [Multiple Regression] [loiqueverhasselt] [2008-11-23 20:12:15] [6440ec5a21e5d35520cb2ae6b4b70e45] [Current]
Feedback Forum
2008-12-01 18:14:16 [Loïque Verhasselt] [reply
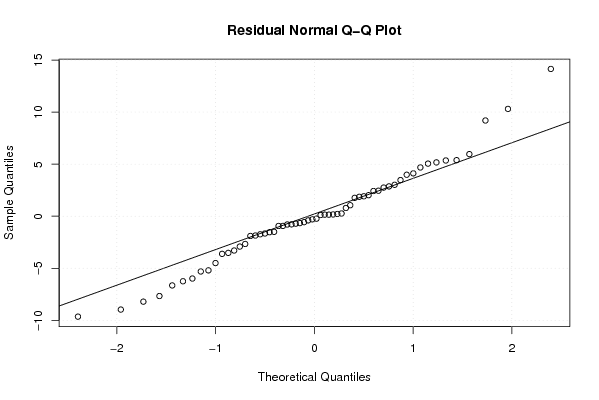
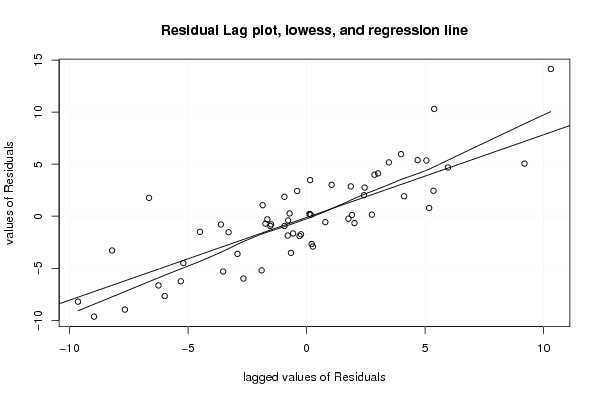
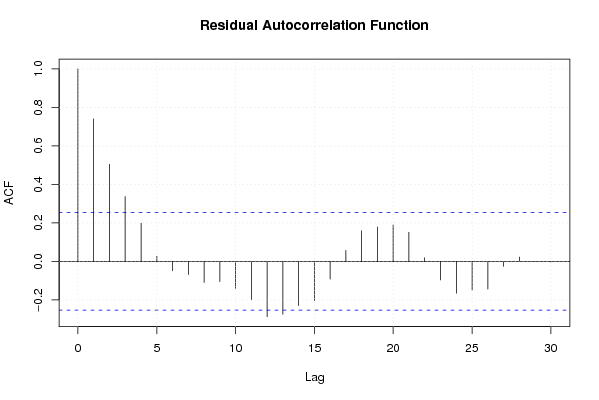
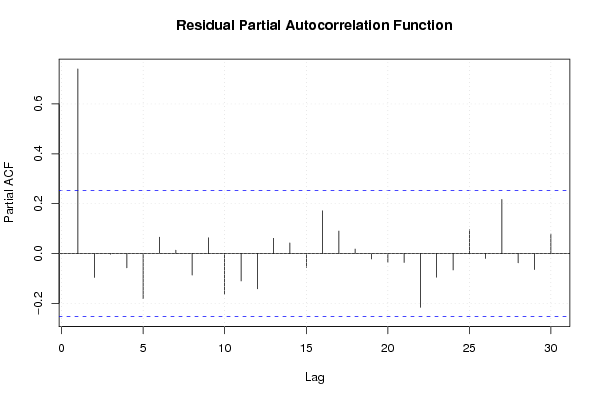
Q3: We krijgen hier ook een gelijkaardige behandeling zoals in Q1 en Q2 toegepast op de eigen tijdreeks. Het had handiger geweest om de nuttige grafieken van de output in het bestand bij te voegen zodat we alles direct kunnen vergelijken met de grafiek. We stellen dus vast dat we een tijdreeks hebben die nog aangepast moet worden door het aanwezig zijn van autocorrelatie.

Post a new message
Dataseries X:
99.4	0
97.5	0
94.6	0
92.6	0
92.5	0
89.8	0
88.8	0
87.4	0
85.2	0
83.1	0
84.7	0
84.8	0
85.8	0
86.3	0
89	0
89	0
89.3	0
91.9	0
94.9	0
94.4	0
96.8	0
96.9	0
98	0
97.9	0
100.9	0
103.9	0
103.1	0
102.5	0
104.3	0
102.6	0
101.7	0
102.8	0
105.4	0
110.9	1
113.5	1
116.3	1
124	1
128.8	1
133.5	1
132.6	1
128.4	1
127.3	1
126.7	1
123.3	1
123.2	1
124.4	1
128.2	1
128.7	1
135.7	1
139	1
145.4	1
142.4	1
137.7	1
137	1
137.1	1
139.3	1
139.6	1
140.4	1
142.3	1
148.3	1


Summary of computational transaction
Raw Inputview raw input (R code)
Raw Outputview raw output of R engine
Computing time3 seconds
R Server'Gwilym Jenkins' @ 72.249.127.135

\begin{tabular}{lllllllll}
\hline
Summary of computational transaction \tabularnewline
Raw Input & view raw input (R code)  \tabularnewline
Raw Output & view raw output of R engine  \tabularnewline
Computing time & 3 seconds \tabularnewline
R Server & 'Gwilym Jenkins' @ 72.249.127.135 \tabularnewline
\hline
\end{tabular}
%Source: https://freestatistics.org/blog/index.php?pk=25336&T=0

[TABLE]
[ROW][C]Summary of computational transaction[/C][/ROW]
[ROW][C]Raw Input[/C][C]view raw input (R code) [/C][/ROW]
[ROW][C]Raw Output[/C][C]view raw output of R engine [/C][/ROW]
[ROW][C]Computing time[/C][C]3 seconds[/C][/ROW]
[ROW][C]R Server[/C][C]'Gwilym Jenkins' @ 72.249.127.135[/C][/ROW]
[/TABLE]
Source: https://freestatistics.org/blog/index.php?pk=25336&T=0

Globally Unique Identifier (entire table): ba.freestatistics.org/blog/index.php?pk=25336&T=0

As an alternative you can also use a QR Code:  

The GUIDs for individual cells are displayed in the table below:

Summary of computational transaction
Raw Inputview raw input (R code)
Raw Outputview raw output of R engine
Computing time3 seconds
R Server'Gwilym Jenkins' @ 72.249.127.135


Multiple Linear Regression - Estimated Regression Equation
Grondstofprijzen[t] = + 79.3416666666667 + 16.0138888888889Wet[t] + 5.18361111111106M1[t] + 6.39444444444447M2[t] + 7.68527777777776M3[t] + 5.6561111111111M4[t] + 3.54694444444444M5[t] + 2.09777777777777M6[t] + 1.48861111111111M7[t] + 0.359444444444446M8[t] + 0.230277777777773M9[t] -2.60166666666667M10[t] -1.13083333333334M11[t] + 0.729166666666667t + e[t]

\begin{tabular}{lllllllll}
\hline
Multiple Linear Regression - Estimated Regression Equation \tabularnewline
Grondstofprijzen[t] =  +  79.3416666666667 +  16.0138888888889Wet[t] +  5.18361111111106M1[t] +  6.39444444444447M2[t] +  7.68527777777776M3[t] +  5.6561111111111M4[t] +  3.54694444444444M5[t] +  2.09777777777777M6[t] +  1.48861111111111M7[t] +  0.359444444444446M8[t] +  0.230277777777773M9[t] -2.60166666666667M10[t] -1.13083333333334M11[t] +  0.729166666666667t  + e[t] \tabularnewline
\hline
\end{tabular}
%Source: https://freestatistics.org/blog/index.php?pk=25336&T=1

[TABLE]
[ROW][C]Multiple Linear Regression - Estimated Regression Equation[/C][/ROW]
[ROW][C]Grondstofprijzen[t] =  +  79.3416666666667 +  16.0138888888889Wet[t] +  5.18361111111106M1[t] +  6.39444444444447M2[t] +  7.68527777777776M3[t] +  5.6561111111111M4[t] +  3.54694444444444M5[t] +  2.09777777777777M6[t] +  1.48861111111111M7[t] +  0.359444444444446M8[t] +  0.230277777777773M9[t] -2.60166666666667M10[t] -1.13083333333334M11[t] +  0.729166666666667t  + e[t][/C][/ROW]
[/TABLE]
Source: https://freestatistics.org/blog/index.php?pk=25336&T=1

Globally Unique Identifier (entire table): ba.freestatistics.org/blog/index.php?pk=25336&T=1

As an alternative you can also use a QR Code:  

The GUIDs for individual cells are displayed in the table below:

Multiple Linear Regression - Estimated Regression Equation
Grondstofprijzen[t] = + 79.3416666666667 + 16.0138888888889Wet[t] + 5.18361111111106M1[t] + 6.39444444444447M2[t] + 7.68527777777776M3[t] + 5.6561111111111M4[t] + 3.54694444444444M5[t] + 2.09777777777777M6[t] + 1.48861111111111M7[t] + 0.359444444444446M8[t] + 0.230277777777773M9[t] -2.60166666666667M10[t] -1.13083333333334M11[t] + 0.729166666666667t + e[t]


Multiple Linear Regression - Ordinary Least Squares
VariableParameterS.D.T-STATH0: parameter = 02-tail p-value1-tail p-value
(Intercept)79.34166666666672.82527628.082800
Wet16.01388888888892.7186235.890400
M15.183611111111063.297091.57220.1227630.061382
M26.394444444444473.2886731.94440.0579790.028989
M37.685277777777763.2821122.34160.023590.011795
M45.65611111111113.2774171.72580.0910990.045549
M53.546944444444443.2745971.08320.2843780.142189
M62.097777777777773.2736560.64080.5248290.262414
M71.488611111111113.2745970.45460.651540.32577
M80.3594444444444463.2774170.10970.9131460.456573
M90.2302777777777733.2821120.07020.9443690.472185
M10-2.601666666666673.266122-0.79660.4297980.214899
M11-1.130833333333343.263292-0.34650.7305240.365262
t0.7291666666666670.078489.291100

\begin{tabular}{lllllllll}
\hline
Multiple Linear Regression - Ordinary Least Squares \tabularnewline
Variable & Parameter & S.D. & T-STATH0: parameter = 0 & 2-tail p-value & 1-tail p-value \tabularnewline
(Intercept) & 79.3416666666667 & 2.825276 & 28.0828 & 0 & 0 \tabularnewline
Wet & 16.0138888888889 & 2.718623 & 5.8904 & 0 & 0 \tabularnewline
M1 & 5.18361111111106 & 3.29709 & 1.5722 & 0.122763 & 0.061382 \tabularnewline
M2 & 6.39444444444447 & 3.288673 & 1.9444 & 0.057979 & 0.028989 \tabularnewline
M3 & 7.68527777777776 & 3.282112 & 2.3416 & 0.02359 & 0.011795 \tabularnewline
M4 & 5.6561111111111 & 3.277417 & 1.7258 & 0.091099 & 0.045549 \tabularnewline
M5 & 3.54694444444444 & 3.274597 & 1.0832 & 0.284378 & 0.142189 \tabularnewline
M6 & 2.09777777777777 & 3.273656 & 0.6408 & 0.524829 & 0.262414 \tabularnewline
M7 & 1.48861111111111 & 3.274597 & 0.4546 & 0.65154 & 0.32577 \tabularnewline
M8 & 0.359444444444446 & 3.277417 & 0.1097 & 0.913146 & 0.456573 \tabularnewline
M9 & 0.230277777777773 & 3.282112 & 0.0702 & 0.944369 & 0.472185 \tabularnewline
M10 & -2.60166666666667 & 3.266122 & -0.7966 & 0.429798 & 0.214899 \tabularnewline
M11 & -1.13083333333334 & 3.263292 & -0.3465 & 0.730524 & 0.365262 \tabularnewline
t & 0.729166666666667 & 0.07848 & 9.2911 & 0 & 0 \tabularnewline
\hline
\end{tabular}
%Source: https://freestatistics.org/blog/index.php?pk=25336&T=2

[TABLE]
[ROW][C]Multiple Linear Regression - Ordinary Least Squares[/C][/ROW]
[ROW][C]Variable[/C][C]Parameter[/C][C]S.D.[/C][C]T-STATH0: parameter = 0[/C][C]2-tail p-value[/C][C]1-tail p-value[/C][/ROW]
[ROW][C](Intercept)[/C][C]79.3416666666667[/C][C]2.825276[/C][C]28.0828[/C][C]0[/C][C]0[/C][/ROW]
[ROW][C]Wet[/C][C]16.0138888888889[/C][C]2.718623[/C][C]5.8904[/C][C]0[/C][C]0[/C][/ROW]
[ROW][C]M1[/C][C]5.18361111111106[/C][C]3.29709[/C][C]1.5722[/C][C]0.122763[/C][C]0.061382[/C][/ROW]
[ROW][C]M2[/C][C]6.39444444444447[/C][C]3.288673[/C][C]1.9444[/C][C]0.057979[/C][C]0.028989[/C][/ROW]
[ROW][C]M3[/C][C]7.68527777777776[/C][C]3.282112[/C][C]2.3416[/C][C]0.02359[/C][C]0.011795[/C][/ROW]
[ROW][C]M4[/C][C]5.6561111111111[/C][C]3.277417[/C][C]1.7258[/C][C]0.091099[/C][C]0.045549[/C][/ROW]
[ROW][C]M5[/C][C]3.54694444444444[/C][C]3.274597[/C][C]1.0832[/C][C]0.284378[/C][C]0.142189[/C][/ROW]
[ROW][C]M6[/C][C]2.09777777777777[/C][C]3.273656[/C][C]0.6408[/C][C]0.524829[/C][C]0.262414[/C][/ROW]
[ROW][C]M7[/C][C]1.48861111111111[/C][C]3.274597[/C][C]0.4546[/C][C]0.65154[/C][C]0.32577[/C][/ROW]
[ROW][C]M8[/C][C]0.359444444444446[/C][C]3.277417[/C][C]0.1097[/C][C]0.913146[/C][C]0.456573[/C][/ROW]
[ROW][C]M9[/C][C]0.230277777777773[/C][C]3.282112[/C][C]0.0702[/C][C]0.944369[/C][C]0.472185[/C][/ROW]
[ROW][C]M10[/C][C]-2.60166666666667[/C][C]3.266122[/C][C]-0.7966[/C][C]0.429798[/C][C]0.214899[/C][/ROW]
[ROW][C]M11[/C][C]-1.13083333333334[/C][C]3.263292[/C][C]-0.3465[/C][C]0.730524[/C][C]0.365262[/C][/ROW]
[ROW][C]t[/C][C]0.729166666666667[/C][C]0.07848[/C][C]9.2911[/C][C]0[/C][C]0[/C][/ROW]
[/TABLE]
Source: https://freestatistics.org/blog/index.php?pk=25336&T=2

Globally Unique Identifier (entire table): ba.freestatistics.org/blog/index.php?pk=25336&T=2

As an alternative you can also use a QR Code:  

The GUIDs for individual cells are displayed in the table below:

Multiple Linear Regression - Ordinary Least Squares
VariableParameterS.D.T-STATH0: parameter = 02-tail p-value1-tail p-value
(Intercept)79.34166666666672.82527628.082800
Wet16.01388888888892.7186235.890400
M15.183611111111063.297091.57220.1227630.061382
M26.394444444444473.2886731.94440.0579790.028989
M37.685277777777763.2821122.34160.023590.011795
M45.65611111111113.2774171.72580.0910990.045549
M53.546944444444443.2745971.08320.2843780.142189
M62.097777777777773.2736560.64080.5248290.262414
M71.488611111111113.2745970.45460.651540.32577
M80.3594444444444463.2774170.10970.9131460.456573
M90.2302777777777733.2821120.07020.9443690.472185
M10-2.601666666666673.266122-0.79660.4297980.214899
M11-1.130833333333343.263292-0.34650.7305240.365262
t0.7291666666666670.078489.291100


Multiple Linear Regression - Regression Statistics
Multiple R0.974578140622656
R-squared0.949802552179514
Adjusted R-squared0.935616316925898
F-TEST (value)66.9524038759638
F-TEST (DF numerator)13
F-TEST (DF denominator)46
p-value0
Multiple Linear Regression - Residual Statistics
Residual Standard Deviation5.15822522187752
Sum Squared Residuals1223.93522222222

\begin{tabular}{lllllllll}
\hline
Multiple Linear Regression - Regression Statistics \tabularnewline
Multiple R & 0.974578140622656 \tabularnewline
R-squared & 0.949802552179514 \tabularnewline
Adjusted R-squared & 0.935616316925898 \tabularnewline
F-TEST (value) & 66.9524038759638 \tabularnewline
F-TEST (DF numerator) & 13 \tabularnewline
F-TEST (DF denominator) & 46 \tabularnewline
p-value & 0 \tabularnewline
Multiple Linear Regression - Residual Statistics \tabularnewline
Residual Standard Deviation & 5.15822522187752 \tabularnewline
Sum Squared Residuals & 1223.93522222222 \tabularnewline
\hline
\end{tabular}
%Source: https://freestatistics.org/blog/index.php?pk=25336&T=3

[TABLE]
[ROW][C]Multiple Linear Regression - Regression Statistics[/C][/ROW]
[ROW][C]Multiple R[/C][C]0.974578140622656[/C][/ROW]
[ROW][C]R-squared[/C][C]0.949802552179514[/C][/ROW]
[ROW][C]Adjusted R-squared[/C][C]0.935616316925898[/C][/ROW]
[ROW][C]F-TEST (value)[/C][C]66.9524038759638[/C][/ROW]
[ROW][C]F-TEST (DF numerator)[/C][C]13[/C][/ROW]
[ROW][C]F-TEST (DF denominator)[/C][C]46[/C][/ROW]
[ROW][C]p-value[/C][C]0[/C][/ROW]
[ROW][C]Multiple Linear Regression - Residual Statistics[/C][/ROW]
[ROW][C]Residual Standard Deviation[/C][C]5.15822522187752[/C][/ROW]
[ROW][C]Sum Squared Residuals[/C][C]1223.93522222222[/C][/ROW]
[/TABLE]
Source: https://freestatistics.org/blog/index.php?pk=25336&T=3

Globally Unique Identifier (entire table): ba.freestatistics.org/blog/index.php?pk=25336&T=3

As an alternative you can also use a QR Code:  

The GUIDs for individual cells are displayed in the table below:

Multiple Linear Regression - Regression Statistics
Multiple R0.974578140622656
R-squared0.949802552179514
Adjusted R-squared0.935616316925898
F-TEST (value)66.9524038759638
F-TEST (DF numerator)13
F-TEST (DF denominator)46
p-value0
Multiple Linear Regression - Residual Statistics
Residual Standard Deviation5.15822522187752
Sum Squared Residuals1223.93522222222


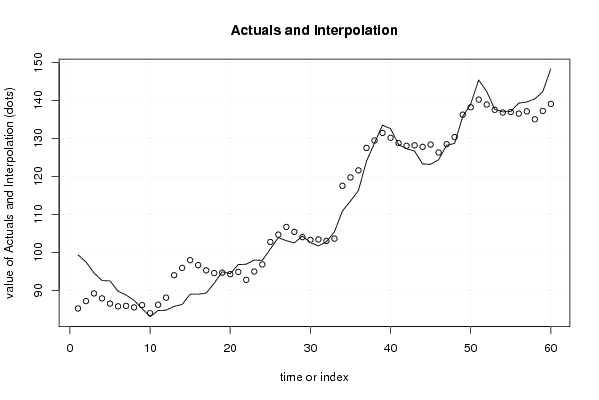
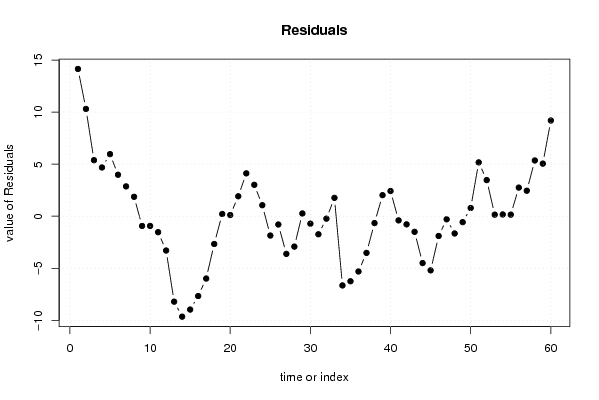
Multiple Linear Regression - Actuals, Interpolation, and Residuals
Time or IndexActualsInterpolationForecastResidualsPrediction Error
199.485.254444444444614.1455555555554
297.587.194444444444410.3055555555556
394.689.21444444444445.38555555555555
492.687.91444444444444.68555555555555
592.586.53444444444445.96555555555558
689.885.81444444444443.98555555555556
788.885.93444444444442.86555555555556
887.485.53444444444441.86555555555557
985.286.1344444444444-0.934444444444437
1083.184.0316666666667-0.931666666666675
1184.786.2316666666667-1.53166666666666
1284.888.0916666666667-3.29166666666667
1385.894.0044444444444-8.20444444444439
1486.395.9444444444445-9.64444444444446
158997.9644444444444-8.96444444444444
168996.6644444444444-7.66444444444444
1789.395.2844444444444-5.98444444444445
1891.994.5644444444444-2.66444444444444
1994.994.68444444444450.215555555555560
2094.494.28444444444440.115555555555559
2196.894.88444444444441.91555555555555
2296.992.78166666666674.11833333333334
239894.98166666666673.01833333333333
2497.996.84166666666671.05833333333333
25100.9102.754444444444-1.85444444444439
26103.9104.694444444444-0.794444444444466
27103.1106.714444444444-3.61444444444445
28102.5105.414444444444-2.91444444444444
29104.3104.0344444444440.265555555555549
30102.6103.314444444444-0.714444444444446
31101.7103.434444444444-1.73444444444444
32102.8103.034444444444-0.234444444444451
33105.4103.6344444444441.76555555555556
34110.9117.545555555556-6.64555555555555
35113.5119.745555555556-6.24555555555555
36116.3121.605555555556-5.30555555555556
37124127.518333333333-3.51833333333328
38128.8129.458333333333-0.658333333333343
39133.5131.4783333333332.02166666666667
40132.6130.1783333333332.42166666666667
41128.4128.798333333333-0.398333333333326
42127.3128.078333333333-0.778333333333338
43126.7128.198333333333-1.49833333333333
44123.3127.798333333333-4.49833333333334
45123.2128.398333333333-5.19833333333333
46124.4126.295555555556-1.89555555555555
47128.2128.495555555556-0.295555555555568
48128.7130.355555555556-1.65555555555558
49135.7136.268333333333-0.568333333333296
50139138.2083333333330.79166666666664
51145.4140.2283333333335.17166666666667
52142.4138.9283333333333.47166666666667
53137.7137.5483333333330.151666666666652
54137136.8283333333330.171666666666659
55137.1136.9483333333330.151666666666655
56139.3136.5483333333332.75166666666667
57139.6137.1483333333332.45166666666666
58140.4135.0455555555565.35444444444444
59142.3137.2455555555565.05444444444445
60148.3139.1055555555569.19444444444444

\begin{tabular}{lllllllll}
\hline
Multiple Linear Regression - Actuals, Interpolation, and Residuals \tabularnewline
Time or Index & Actuals & InterpolationForecast & ResidualsPrediction Error \tabularnewline
1 & 99.4 & 85.2544444444446 & 14.1455555555554 \tabularnewline
2 & 97.5 & 87.1944444444444 & 10.3055555555556 \tabularnewline
3 & 94.6 & 89.2144444444444 & 5.38555555555555 \tabularnewline
4 & 92.6 & 87.9144444444444 & 4.68555555555555 \tabularnewline
5 & 92.5 & 86.5344444444444 & 5.96555555555558 \tabularnewline
6 & 89.8 & 85.8144444444444 & 3.98555555555556 \tabularnewline
7 & 88.8 & 85.9344444444444 & 2.86555555555556 \tabularnewline
8 & 87.4 & 85.5344444444444 & 1.86555555555557 \tabularnewline
9 & 85.2 & 86.1344444444444 & -0.934444444444437 \tabularnewline
10 & 83.1 & 84.0316666666667 & -0.931666666666675 \tabularnewline
11 & 84.7 & 86.2316666666667 & -1.53166666666666 \tabularnewline
12 & 84.8 & 88.0916666666667 & -3.29166666666667 \tabularnewline
13 & 85.8 & 94.0044444444444 & -8.20444444444439 \tabularnewline
14 & 86.3 & 95.9444444444445 & -9.64444444444446 \tabularnewline
15 & 89 & 97.9644444444444 & -8.96444444444444 \tabularnewline
16 & 89 & 96.6644444444444 & -7.66444444444444 \tabularnewline
17 & 89.3 & 95.2844444444444 & -5.98444444444445 \tabularnewline
18 & 91.9 & 94.5644444444444 & -2.66444444444444 \tabularnewline
19 & 94.9 & 94.6844444444445 & 0.215555555555560 \tabularnewline
20 & 94.4 & 94.2844444444444 & 0.115555555555559 \tabularnewline
21 & 96.8 & 94.8844444444444 & 1.91555555555555 \tabularnewline
22 & 96.9 & 92.7816666666667 & 4.11833333333334 \tabularnewline
23 & 98 & 94.9816666666667 & 3.01833333333333 \tabularnewline
24 & 97.9 & 96.8416666666667 & 1.05833333333333 \tabularnewline
25 & 100.9 & 102.754444444444 & -1.85444444444439 \tabularnewline
26 & 103.9 & 104.694444444444 & -0.794444444444466 \tabularnewline
27 & 103.1 & 106.714444444444 & -3.61444444444445 \tabularnewline
28 & 102.5 & 105.414444444444 & -2.91444444444444 \tabularnewline
29 & 104.3 & 104.034444444444 & 0.265555555555549 \tabularnewline
30 & 102.6 & 103.314444444444 & -0.714444444444446 \tabularnewline
31 & 101.7 & 103.434444444444 & -1.73444444444444 \tabularnewline
32 & 102.8 & 103.034444444444 & -0.234444444444451 \tabularnewline
33 & 105.4 & 103.634444444444 & 1.76555555555556 \tabularnewline
34 & 110.9 & 117.545555555556 & -6.64555555555555 \tabularnewline
35 & 113.5 & 119.745555555556 & -6.24555555555555 \tabularnewline
36 & 116.3 & 121.605555555556 & -5.30555555555556 \tabularnewline
37 & 124 & 127.518333333333 & -3.51833333333328 \tabularnewline
38 & 128.8 & 129.458333333333 & -0.658333333333343 \tabularnewline
39 & 133.5 & 131.478333333333 & 2.02166666666667 \tabularnewline
40 & 132.6 & 130.178333333333 & 2.42166666666667 \tabularnewline
41 & 128.4 & 128.798333333333 & -0.398333333333326 \tabularnewline
42 & 127.3 & 128.078333333333 & -0.778333333333338 \tabularnewline
43 & 126.7 & 128.198333333333 & -1.49833333333333 \tabularnewline
44 & 123.3 & 127.798333333333 & -4.49833333333334 \tabularnewline
45 & 123.2 & 128.398333333333 & -5.19833333333333 \tabularnewline
46 & 124.4 & 126.295555555556 & -1.89555555555555 \tabularnewline
47 & 128.2 & 128.495555555556 & -0.295555555555568 \tabularnewline
48 & 128.7 & 130.355555555556 & -1.65555555555558 \tabularnewline
49 & 135.7 & 136.268333333333 & -0.568333333333296 \tabularnewline
50 & 139 & 138.208333333333 & 0.79166666666664 \tabularnewline
51 & 145.4 & 140.228333333333 & 5.17166666666667 \tabularnewline
52 & 142.4 & 138.928333333333 & 3.47166666666667 \tabularnewline
53 & 137.7 & 137.548333333333 & 0.151666666666652 \tabularnewline
54 & 137 & 136.828333333333 & 0.171666666666659 \tabularnewline
55 & 137.1 & 136.948333333333 & 0.151666666666655 \tabularnewline
56 & 139.3 & 136.548333333333 & 2.75166666666667 \tabularnewline
57 & 139.6 & 137.148333333333 & 2.45166666666666 \tabularnewline
58 & 140.4 & 135.045555555556 & 5.35444444444444 \tabularnewline
59 & 142.3 & 137.245555555556 & 5.05444444444445 \tabularnewline
60 & 148.3 & 139.105555555556 & 9.19444444444444 \tabularnewline
\hline
\end{tabular}
%Source: https://freestatistics.org/blog/index.php?pk=25336&T=4

[TABLE]
[ROW][C]Multiple Linear Regression - Actuals, Interpolation, and Residuals[/C][/ROW]
[ROW][C]Time or Index[/C][C]Actuals[/C][C]InterpolationForecast[/C][C]ResidualsPrediction Error[/C][/ROW]
[ROW][C]1[/C][C]99.4[/C][C]85.2544444444446[/C][C]14.1455555555554[/C][/ROW]
[ROW][C]2[/C][C]97.5[/C][C]87.1944444444444[/C][C]10.3055555555556[/C][/ROW]
[ROW][C]3[/C][C]94.6[/C][C]89.2144444444444[/C][C]5.38555555555555[/C][/ROW]
[ROW][C]4[/C][C]92.6[/C][C]87.9144444444444[/C][C]4.68555555555555[/C][/ROW]
[ROW][C]5[/C][C]92.5[/C][C]86.5344444444444[/C][C]5.96555555555558[/C][/ROW]
[ROW][C]6[/C][C]89.8[/C][C]85.8144444444444[/C][C]3.98555555555556[/C][/ROW]
[ROW][C]7[/C][C]88.8[/C][C]85.9344444444444[/C][C]2.86555555555556[/C][/ROW]
[ROW][C]8[/C][C]87.4[/C][C]85.5344444444444[/C][C]1.86555555555557[/C][/ROW]
[ROW][C]9[/C][C]85.2[/C][C]86.1344444444444[/C][C]-0.934444444444437[/C][/ROW]
[ROW][C]10[/C][C]83.1[/C][C]84.0316666666667[/C][C]-0.931666666666675[/C][/ROW]
[ROW][C]11[/C][C]84.7[/C][C]86.2316666666667[/C][C]-1.53166666666666[/C][/ROW]
[ROW][C]12[/C][C]84.8[/C][C]88.0916666666667[/C][C]-3.29166666666667[/C][/ROW]
[ROW][C]13[/C][C]85.8[/C][C]94.0044444444444[/C][C]-8.20444444444439[/C][/ROW]
[ROW][C]14[/C][C]86.3[/C][C]95.9444444444445[/C][C]-9.64444444444446[/C][/ROW]
[ROW][C]15[/C][C]89[/C][C]97.9644444444444[/C][C]-8.96444444444444[/C][/ROW]
[ROW][C]16[/C][C]89[/C][C]96.6644444444444[/C][C]-7.66444444444444[/C][/ROW]
[ROW][C]17[/C][C]89.3[/C][C]95.2844444444444[/C][C]-5.98444444444445[/C][/ROW]
[ROW][C]18[/C][C]91.9[/C][C]94.5644444444444[/C][C]-2.66444444444444[/C][/ROW]
[ROW][C]19[/C][C]94.9[/C][C]94.6844444444445[/C][C]0.215555555555560[/C][/ROW]
[ROW][C]20[/C][C]94.4[/C][C]94.2844444444444[/C][C]0.115555555555559[/C][/ROW]
[ROW][C]21[/C][C]96.8[/C][C]94.8844444444444[/C][C]1.91555555555555[/C][/ROW]
[ROW][C]22[/C][C]96.9[/C][C]92.7816666666667[/C][C]4.11833333333334[/C][/ROW]
[ROW][C]23[/C][C]98[/C][C]94.9816666666667[/C][C]3.01833333333333[/C][/ROW]
[ROW][C]24[/C][C]97.9[/C][C]96.8416666666667[/C][C]1.05833333333333[/C][/ROW]
[ROW][C]25[/C][C]100.9[/C][C]102.754444444444[/C][C]-1.85444444444439[/C][/ROW]
[ROW][C]26[/C][C]103.9[/C][C]104.694444444444[/C][C]-0.794444444444466[/C][/ROW]
[ROW][C]27[/C][C]103.1[/C][C]106.714444444444[/C][C]-3.61444444444445[/C][/ROW]
[ROW][C]28[/C][C]102.5[/C][C]105.414444444444[/C][C]-2.91444444444444[/C][/ROW]
[ROW][C]29[/C][C]104.3[/C][C]104.034444444444[/C][C]0.265555555555549[/C][/ROW]
[ROW][C]30[/C][C]102.6[/C][C]103.314444444444[/C][C]-0.714444444444446[/C][/ROW]
[ROW][C]31[/C][C]101.7[/C][C]103.434444444444[/C][C]-1.73444444444444[/C][/ROW]
[ROW][C]32[/C][C]102.8[/C][C]103.034444444444[/C][C]-0.234444444444451[/C][/ROW]
[ROW][C]33[/C][C]105.4[/C][C]103.634444444444[/C][C]1.76555555555556[/C][/ROW]
[ROW][C]34[/C][C]110.9[/C][C]117.545555555556[/C][C]-6.64555555555555[/C][/ROW]
[ROW][C]35[/C][C]113.5[/C][C]119.745555555556[/C][C]-6.24555555555555[/C][/ROW]
[ROW][C]36[/C][C]116.3[/C][C]121.605555555556[/C][C]-5.30555555555556[/C][/ROW]
[ROW][C]37[/C][C]124[/C][C]127.518333333333[/C][C]-3.51833333333328[/C][/ROW]
[ROW][C]38[/C][C]128.8[/C][C]129.458333333333[/C][C]-0.658333333333343[/C][/ROW]
[ROW][C]39[/C][C]133.5[/C][C]131.478333333333[/C][C]2.02166666666667[/C][/ROW]
[ROW][C]40[/C][C]132.6[/C][C]130.178333333333[/C][C]2.42166666666667[/C][/ROW]
[ROW][C]41[/C][C]128.4[/C][C]128.798333333333[/C][C]-0.398333333333326[/C][/ROW]
[ROW][C]42[/C][C]127.3[/C][C]128.078333333333[/C][C]-0.778333333333338[/C][/ROW]
[ROW][C]43[/C][C]126.7[/C][C]128.198333333333[/C][C]-1.49833333333333[/C][/ROW]
[ROW][C]44[/C][C]123.3[/C][C]127.798333333333[/C][C]-4.49833333333334[/C][/ROW]
[ROW][C]45[/C][C]123.2[/C][C]128.398333333333[/C][C]-5.19833333333333[/C][/ROW]
[ROW][C]46[/C][C]124.4[/C][C]126.295555555556[/C][C]-1.89555555555555[/C][/ROW]
[ROW][C]47[/C][C]128.2[/C][C]128.495555555556[/C][C]-0.295555555555568[/C][/ROW]
[ROW][C]48[/C][C]128.7[/C][C]130.355555555556[/C][C]-1.65555555555558[/C][/ROW]
[ROW][C]49[/C][C]135.7[/C][C]136.268333333333[/C][C]-0.568333333333296[/C][/ROW]
[ROW][C]50[/C][C]139[/C][C]138.208333333333[/C][C]0.79166666666664[/C][/ROW]
[ROW][C]51[/C][C]145.4[/C][C]140.228333333333[/C][C]5.17166666666667[/C][/ROW]
[ROW][C]52[/C][C]142.4[/C][C]138.928333333333[/C][C]3.47166666666667[/C][/ROW]
[ROW][C]53[/C][C]137.7[/C][C]137.548333333333[/C][C]0.151666666666652[/C][/ROW]
[ROW][C]54[/C][C]137[/C][C]136.828333333333[/C][C]0.171666666666659[/C][/ROW]
[ROW][C]55[/C][C]137.1[/C][C]136.948333333333[/C][C]0.151666666666655[/C][/ROW]
[ROW][C]56[/C][C]139.3[/C][C]136.548333333333[/C][C]2.75166666666667[/C][/ROW]
[ROW][C]57[/C][C]139.6[/C][C]137.148333333333[/C][C]2.45166666666666[/C][/ROW]
[ROW][C]58[/C][C]140.4[/C][C]135.045555555556[/C][C]5.35444444444444[/C][/ROW]
[ROW][C]59[/C][C]142.3[/C][C]137.245555555556[/C][C]5.05444444444445[/C][/ROW]
[ROW][C]60[/C][C]148.3[/C][C]139.105555555556[/C][C]9.19444444444444[/C][/ROW]
[/TABLE]
Source: https://freestatistics.org/blog/index.php?pk=25336&T=4

Globally Unique Identifier (entire table): ba.freestatistics.org/blog/index.php?pk=25336&T=4

As an alternative you can also use a QR Code:  

The GUIDs for individual cells are displayed in the table below:

Multiple Linear Regression - Actuals, Interpolation, and Residuals
Time or IndexActualsInterpolationForecastResidualsPrediction Error
199.485.254444444444614.1455555555554
297.587.194444444444410.3055555555556
394.689.21444444444445.38555555555555
492.687.91444444444444.68555555555555
592.586.53444444444445.96555555555558
689.885.81444444444443.98555555555556
788.885.93444444444442.86555555555556
887.485.53444444444441.86555555555557
985.286.1344444444444-0.934444444444437
1083.184.0316666666667-0.931666666666675
1184.786.2316666666667-1.53166666666666
1284.888.0916666666667-3.29166666666667
1385.894.0044444444444-8.20444444444439
1486.395.9444444444445-9.64444444444446
158997.9644444444444-8.96444444444444
168996.6644444444444-7.66444444444444
1789.395.2844444444444-5.98444444444445
1891.994.5644444444444-2.66444444444444
1994.994.68444444444450.215555555555560
2094.494.28444444444440.115555555555559
2196.894.88444444444441.91555555555555
2296.992.78166666666674.11833333333334
239894.98166666666673.01833333333333
2497.996.84166666666671.05833333333333
25100.9102.754444444444-1.85444444444439
26103.9104.694444444444-0.794444444444466
27103.1106.714444444444-3.61444444444445
28102.5105.414444444444-2.91444444444444
29104.3104.0344444444440.265555555555549
30102.6103.314444444444-0.714444444444446
31101.7103.434444444444-1.73444444444444
32102.8103.034444444444-0.234444444444451
33105.4103.6344444444441.76555555555556
34110.9117.545555555556-6.64555555555555
35113.5119.745555555556-6.24555555555555
36116.3121.605555555556-5.30555555555556
37124127.518333333333-3.51833333333328
38128.8129.458333333333-0.658333333333343
39133.5131.4783333333332.02166666666667
40132.6130.1783333333332.42166666666667
41128.4128.798333333333-0.398333333333326
42127.3128.078333333333-0.778333333333338
43126.7128.198333333333-1.49833333333333
44123.3127.798333333333-4.49833333333334
45123.2128.398333333333-5.19833333333333
46124.4126.295555555556-1.89555555555555
47128.2128.495555555556-0.295555555555568
48128.7130.355555555556-1.65555555555558
49135.7136.268333333333-0.568333333333296
50139138.2083333333330.79166666666664
51145.4140.2283333333335.17166666666667
52142.4138.9283333333333.47166666666667
53137.7137.5483333333330.151666666666652
54137136.8283333333330.171666666666659
55137.1136.9483333333330.151666666666655
56139.3136.5483333333332.75166666666667
57139.6137.1483333333332.45166666666666
58140.4135.0455555555565.35444444444444
59142.3137.2455555555565.05444444444445
60148.3139.1055555555569.19444444444444


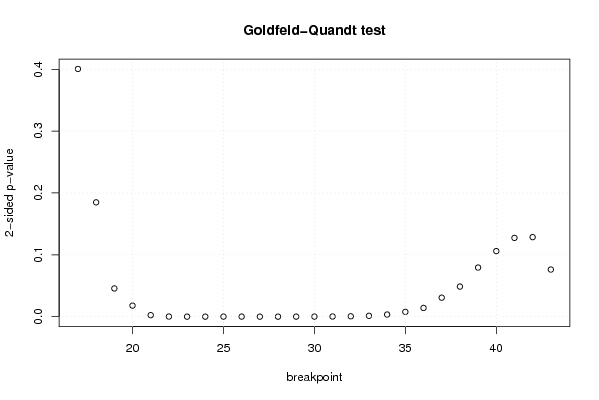
Goldfeld-Quandt test for Heteroskedasticity
p-valuesAlternative Hypothesis
breakpoint indexgreater2-sidedless
170.799738296184940.400523407630120.20026170381506
180.9075891440386420.1848217119227160.092410855961358
190.9771845546342480.04563089073150330.0228154453657516
200.9910760327336630.01784793453267430.00892396726633714
210.9988034250630.002393149874001050.00119657493700053
220.9999077293342120.0001845413315764589.22706657882291e-05
230.9999852680152362.9463969527138e-051.4731984763569e-05
240.9999908014140261.8397171948115e-059.1985859740575e-06
250.9999773019120734.53961758535532e-052.26980879267766e-05
260.9999547586819739.04826360539981e-054.52413180269990e-05
270.9999792779737714.14440524574243e-052.07220262287121e-05
280.9999916721659941.66556680118763e-058.32783400593815e-06
290.9999786259435944.27481128123038e-052.13740564061519e-05
300.9999425394032920.0001149211934153415.74605967076705e-05
310.9998753471487160.000249305702567450.000124652851283725
320.9997110986676730.0005778026646543450.000288901332327173
330.9993097726596890.001380454680622910.000690227340311456
340.9982683229592550.003463354081489930.00173167704074496
350.9961111910670470.007777617865906660.00388880893295333
360.9929378481841240.01412430363175190.00706215181587595
370.9846591298341890.03068174033162200.0153408701658110
380.9756823800318810.04863523993623820.0243176199681191
390.960288067418310.07942386516338070.0397119325816903
400.947005655390250.1059886892195000.0529943446097501
410.9363246502215570.1273506995568860.0636753497784432
420.9357257078870540.1285485842258930.0642742921129464
430.9619134086600550.07617318267988970.0380865913399448

\begin{tabular}{lllllllll}
\hline
Goldfeld-Quandt test for Heteroskedasticity \tabularnewline
p-values & Alternative Hypothesis \tabularnewline
breakpoint index & greater & 2-sided & less \tabularnewline
17 & 0.79973829618494 & 0.40052340763012 & 0.20026170381506 \tabularnewline
18 & 0.907589144038642 & 0.184821711922716 & 0.092410855961358 \tabularnewline
19 & 0.977184554634248 & 0.0456308907315033 & 0.0228154453657516 \tabularnewline
20 & 0.991076032733663 & 0.0178479345326743 & 0.00892396726633714 \tabularnewline
21 & 0.998803425063 & 0.00239314987400105 & 0.00119657493700053 \tabularnewline
22 & 0.999907729334212 & 0.000184541331576458 & 9.22706657882291e-05 \tabularnewline
23 & 0.999985268015236 & 2.9463969527138e-05 & 1.4731984763569e-05 \tabularnewline
24 & 0.999990801414026 & 1.8397171948115e-05 & 9.1985859740575e-06 \tabularnewline
25 & 0.999977301912073 & 4.53961758535532e-05 & 2.26980879267766e-05 \tabularnewline
26 & 0.999954758681973 & 9.04826360539981e-05 & 4.52413180269990e-05 \tabularnewline
27 & 0.999979277973771 & 4.14440524574243e-05 & 2.07220262287121e-05 \tabularnewline
28 & 0.999991672165994 & 1.66556680118763e-05 & 8.32783400593815e-06 \tabularnewline
29 & 0.999978625943594 & 4.27481128123038e-05 & 2.13740564061519e-05 \tabularnewline
30 & 0.999942539403292 & 0.000114921193415341 & 5.74605967076705e-05 \tabularnewline
31 & 0.999875347148716 & 0.00024930570256745 & 0.000124652851283725 \tabularnewline
32 & 0.999711098667673 & 0.000577802664654345 & 0.000288901332327173 \tabularnewline
33 & 0.999309772659689 & 0.00138045468062291 & 0.000690227340311456 \tabularnewline
34 & 0.998268322959255 & 0.00346335408148993 & 0.00173167704074496 \tabularnewline
35 & 0.996111191067047 & 0.00777761786590666 & 0.00388880893295333 \tabularnewline
36 & 0.992937848184124 & 0.0141243036317519 & 0.00706215181587595 \tabularnewline
37 & 0.984659129834189 & 0.0306817403316220 & 0.0153408701658110 \tabularnewline
38 & 0.975682380031881 & 0.0486352399362382 & 0.0243176199681191 \tabularnewline
39 & 0.96028806741831 & 0.0794238651633807 & 0.0397119325816903 \tabularnewline
40 & 0.94700565539025 & 0.105988689219500 & 0.0529943446097501 \tabularnewline
41 & 0.936324650221557 & 0.127350699556886 & 0.0636753497784432 \tabularnewline
42 & 0.935725707887054 & 0.128548584225893 & 0.0642742921129464 \tabularnewline
43 & 0.961913408660055 & 0.0761731826798897 & 0.0380865913399448 \tabularnewline
\hline
\end{tabular}
%Source: https://freestatistics.org/blog/index.php?pk=25336&T=5

[TABLE]
[ROW][C]Goldfeld-Quandt test for Heteroskedasticity[/C][/ROW]
[ROW][C]p-values[/C][C]Alternative Hypothesis[/C][/ROW]
[ROW][C]breakpoint index[/C][C]greater[/C][C]2-sided[/C][C]less[/C][/ROW]
[ROW][C]17[/C][C]0.79973829618494[/C][C]0.40052340763012[/C][C]0.20026170381506[/C][/ROW]
[ROW][C]18[/C][C]0.907589144038642[/C][C]0.184821711922716[/C][C]0.092410855961358[/C][/ROW]
[ROW][C]19[/C][C]0.977184554634248[/C][C]0.0456308907315033[/C][C]0.0228154453657516[/C][/ROW]
[ROW][C]20[/C][C]0.991076032733663[/C][C]0.0178479345326743[/C][C]0.00892396726633714[/C][/ROW]
[ROW][C]21[/C][C]0.998803425063[/C][C]0.00239314987400105[/C][C]0.00119657493700053[/C][/ROW]
[ROW][C]22[/C][C]0.999907729334212[/C][C]0.000184541331576458[/C][C]9.22706657882291e-05[/C][/ROW]
[ROW][C]23[/C][C]0.999985268015236[/C][C]2.9463969527138e-05[/C][C]1.4731984763569e-05[/C][/ROW]
[ROW][C]24[/C][C]0.999990801414026[/C][C]1.8397171948115e-05[/C][C]9.1985859740575e-06[/C][/ROW]
[ROW][C]25[/C][C]0.999977301912073[/C][C]4.53961758535532e-05[/C][C]2.26980879267766e-05[/C][/ROW]
[ROW][C]26[/C][C]0.999954758681973[/C][C]9.04826360539981e-05[/C][C]4.52413180269990e-05[/C][/ROW]
[ROW][C]27[/C][C]0.999979277973771[/C][C]4.14440524574243e-05[/C][C]2.07220262287121e-05[/C][/ROW]
[ROW][C]28[/C][C]0.999991672165994[/C][C]1.66556680118763e-05[/C][C]8.32783400593815e-06[/C][/ROW]
[ROW][C]29[/C][C]0.999978625943594[/C][C]4.27481128123038e-05[/C][C]2.13740564061519e-05[/C][/ROW]
[ROW][C]30[/C][C]0.999942539403292[/C][C]0.000114921193415341[/C][C]5.74605967076705e-05[/C][/ROW]
[ROW][C]31[/C][C]0.999875347148716[/C][C]0.00024930570256745[/C][C]0.000124652851283725[/C][/ROW]
[ROW][C]32[/C][C]0.999711098667673[/C][C]0.000577802664654345[/C][C]0.000288901332327173[/C][/ROW]
[ROW][C]33[/C][C]0.999309772659689[/C][C]0.00138045468062291[/C][C]0.000690227340311456[/C][/ROW]
[ROW][C]34[/C][C]0.998268322959255[/C][C]0.00346335408148993[/C][C]0.00173167704074496[/C][/ROW]
[ROW][C]35[/C][C]0.996111191067047[/C][C]0.00777761786590666[/C][C]0.00388880893295333[/C][/ROW]
[ROW][C]36[/C][C]0.992937848184124[/C][C]0.0141243036317519[/C][C]0.00706215181587595[/C][/ROW]
[ROW][C]37[/C][C]0.984659129834189[/C][C]0.0306817403316220[/C][C]0.0153408701658110[/C][/ROW]
[ROW][C]38[/C][C]0.975682380031881[/C][C]0.0486352399362382[/C][C]0.0243176199681191[/C][/ROW]
[ROW][C]39[/C][C]0.96028806741831[/C][C]0.0794238651633807[/C][C]0.0397119325816903[/C][/ROW]
[ROW][C]40[/C][C]0.94700565539025[/C][C]0.105988689219500[/C][C]0.0529943446097501[/C][/ROW]
[ROW][C]41[/C][C]0.936324650221557[/C][C]0.127350699556886[/C][C]0.0636753497784432[/C][/ROW]
[ROW][C]42[/C][C]0.935725707887054[/C][C]0.128548584225893[/C][C]0.0642742921129464[/C][/ROW]
[ROW][C]43[/C][C]0.961913408660055[/C][C]0.0761731826798897[/C][C]0.0380865913399448[/C][/ROW]
[/TABLE]
Source: https://freestatistics.org/blog/index.php?pk=25336&T=5

Globally Unique Identifier (entire table): ba.freestatistics.org/blog/index.php?pk=25336&T=5

As an alternative you can also use a QR Code:  

The GUIDs for individual cells are displayed in the table below:

Goldfeld-Quandt test for Heteroskedasticity
p-valuesAlternative Hypothesis
breakpoint indexgreater2-sidedless
170.799738296184940.400523407630120.20026170381506
180.9075891440386420.1848217119227160.092410855961358
190.9771845546342480.04563089073150330.0228154453657516
200.9910760327336630.01784793453267430.00892396726633714
210.9988034250630.002393149874001050.00119657493700053
220.9999077293342120.0001845413315764589.22706657882291e-05
230.9999852680152362.9463969527138e-051.4731984763569e-05
240.9999908014140261.8397171948115e-059.1985859740575e-06
250.9999773019120734.53961758535532e-052.26980879267766e-05
260.9999547586819739.04826360539981e-054.52413180269990e-05
270.9999792779737714.14440524574243e-052.07220262287121e-05
280.9999916721659941.66556680118763e-058.32783400593815e-06
290.9999786259435944.27481128123038e-052.13740564061519e-05
300.9999425394032920.0001149211934153415.74605967076705e-05
310.9998753471487160.000249305702567450.000124652851283725
320.9997110986676730.0005778026646543450.000288901332327173
330.9993097726596890.001380454680622910.000690227340311456
340.9982683229592550.003463354081489930.00173167704074496
350.9961111910670470.007777617865906660.00388880893295333
360.9929378481841240.01412430363175190.00706215181587595
370.9846591298341890.03068174033162200.0153408701658110
380.9756823800318810.04863523993623820.0243176199681191
390.960288067418310.07942386516338070.0397119325816903
400.947005655390250.1059886892195000.0529943446097501
410.9363246502215570.1273506995568860.0636753497784432
420.9357257078870540.1285485842258930.0642742921129464
430.9619134086600550.07617318267988970.0380865913399448


Meta Analysis of Goldfeld-Quandt test for Heteroskedasticity
Description# significant tests% significant testsOK/NOK
1% type I error level150.555555555555556NOK
5% type I error level200.740740740740741NOK
10% type I error level220.814814814814815NOK

\begin{tabular}{lllllllll}
\hline
Meta Analysis of Goldfeld-Quandt test for Heteroskedasticity \tabularnewline
Description & # significant tests & % significant tests & OK/NOK \tabularnewline
1% type I error level & 15 & 0.555555555555556 & NOK \tabularnewline
5% type I error level & 20 & 0.740740740740741 & NOK \tabularnewline
10% type I error level & 22 & 0.814814814814815 & NOK \tabularnewline
\hline
\end{tabular}
%Source: https://freestatistics.org/blog/index.php?pk=25336&T=6

[TABLE]
[ROW][C]Meta Analysis of Goldfeld-Quandt test for Heteroskedasticity[/C][/ROW]
[ROW][C]Description[/C][C]# significant tests[/C][C]% significant tests[/C][C]OK/NOK[/C][/ROW]
[ROW][C]1% type I error level[/C][C]15[/C][C]0.555555555555556[/C][C]NOK[/C][/ROW]
[ROW][C]5% type I error level[/C][C]20[/C][C]0.740740740740741[/C][C]NOK[/C][/ROW]
[ROW][C]10% type I error level[/C][C]22[/C][C]0.814814814814815[/C][C]NOK[/C][/ROW]
[/TABLE]
Source: https://freestatistics.org/blog/index.php?pk=25336&T=6

Globally Unique Identifier (entire table): ba.freestatistics.org/blog/index.php?pk=25336&T=6

As an alternative you can also use a QR Code:  

The GUIDs for individual cells are displayed in the table below:

Meta Analysis of Goldfeld-Quandt test for Heteroskedasticity
Description# significant tests% significant testsOK/NOK
1% type I error level150.555555555555556NOK
5% type I error level200.740740740740741NOK
10% type I error level220.814814814814815NOK


Parameters (Session):
par1 = 1 ; par2 = Include Monthly Dummies ; par3 = Linear Trend ;
Parameters (R input):
par1 = 1 ; par2 = Include Monthly Dummies ; par3 = Linear Trend ;
R code (references can be found in the software module):
library(lattice)
library(lmtest)
n25 <- 25 #minimum number of obs. for Goldfeld-Quandt test
par1 <- as.numeric(par1)
x <- t(y)
k <- length(x[1,])
n <- length(x[,1])
x1 <- cbind(x[,par1], x[,1:k!=par1])
mycolnames <- c(colnames(x)[par1], colnames(x)[1:k!=par1])
colnames(x1) <- mycolnames #colnames(x)[par1]
x <- x1
if (par3 == 'First Differences'){
x2 <- array(0, dim=c(n-1,k), dimnames=list(1:(n-1), paste('(1-B)',colnames(x),sep='')))
for (i in 1:n-1) {
for (j in 1:k) {
x2[i,j] <- x[i+1,j] - x[i,j]
}
}
x <- x2
}
if (par2 == 'Include Monthly Dummies'){
x2 <- array(0, dim=c(n,11), dimnames=list(1:n, paste('M', seq(1:11), sep ='')))
for (i in 1:11){
x2[seq(i,n,12),i] <- 1
}
x <- cbind(x, x2)
}
if (par2 == 'Include Quarterly Dummies'){
x2 <- array(0, dim=c(n,3), dimnames=list(1:n, paste('Q', seq(1:3), sep ='')))
for (i in 1:3){
x2[seq(i,n,4),i] <- 1
}
x <- cbind(x, x2)
}
k <- length(x[1,])
if (par3 == 'Linear Trend'){
x <- cbind(x, c(1:n))
colnames(x)[k+1] <- 't'
}
x
k <- length(x[1,])
df <- as.data.frame(x)
(mylm <- lm(df))
(mysum <- summary(mylm))
if (n > n25) {
kp3 <- k + 3
nmkm3 <- n - k - 3
gqarr <- array(NA, dim=c(nmkm3-kp3+1,3))
numgqtests <- 0
numsignificant1 <- 0
numsignificant5 <- 0
numsignificant10 <- 0
for (mypoint in kp3:nmkm3) {
j <- 0
numgqtests <- numgqtests + 1
for (myalt in c('greater', 'two.sided', 'less')) {
j <- j + 1
gqarr[mypoint-kp3+1,j] <- gqtest(mylm, point=mypoint, alternative=myalt)$p.value
}
if (gqarr[mypoint-kp3+1,2] < 0.01) numsignificant1 <- numsignificant1 + 1
if (gqarr[mypoint-kp3+1,2] < 0.05) numsignificant5 <- numsignificant5 + 1
if (gqarr[mypoint-kp3+1,2] < 0.10) numsignificant10 <- numsignificant10 + 1
}
gqarr
}
bitmap(file='test0.png')
plot(x[,1], type='l', main='Actuals and Interpolation', ylab='value of Actuals and Interpolation (dots)', xlab='time or index')
points(x[,1]-mysum$resid)
grid()
dev.off()
bitmap(file='test1.png')
plot(mysum$resid, type='b', pch=19, main='Residuals', ylab='value of Residuals', xlab='time or index')
grid()
dev.off()
bitmap(file='test2.png')
hist(mysum$resid, main='Residual Histogram', xlab='values of Residuals')
grid()
dev.off()
bitmap(file='test3.png')
densityplot(~mysum$resid,col='black',main='Residual Density Plot', xlab='values of Residuals')
dev.off()
bitmap(file='test4.png')
qqnorm(mysum$resid, main='Residual Normal Q-Q Plot')
qqline(mysum$resid)
grid()
dev.off()
(myerror <- as.ts(mysum$resid))
bitmap(file='test5.png')
dum <- cbind(lag(myerror,k=1),myerror)
dum
dum1 <- dum[2:length(myerror),]
dum1
z <- as.data.frame(dum1)
z
plot(z,main=paste('Residual Lag plot, lowess, and regression line'), ylab='values of Residuals', xlab='lagged values of Residuals')
lines(lowess(z))
abline(lm(z))
grid()
dev.off()
bitmap(file='test6.png')
acf(mysum$resid, lag.max=length(mysum$resid)/2, main='Residual Autocorrelation Function')
grid()
dev.off()
bitmap(file='test7.png')
pacf(mysum$resid, lag.max=length(mysum$resid)/2, main='Residual Partial Autocorrelation Function')
grid()
dev.off()
bitmap(file='test8.png')
opar <- par(mfrow = c(2,2), oma = c(0, 0, 1.1, 0))
plot(mylm, las = 1, sub='Residual Diagnostics')
par(opar)
dev.off()
if (n > n25) {
bitmap(file='test9.png')
plot(kp3:nmkm3,gqarr[,2], main='Goldfeld-Quandt test',ylab='2-sided p-value',xlab='breakpoint')
grid()
dev.off()
}
load(file='createtable')
a<-table.start()
a<-table.row.start(a)
a<-table.element(a, 'Multiple Linear Regression - Estimated Regression Equation', 1, TRUE)
a<-table.row.end(a)
myeq <- colnames(x)[1]
myeq <- paste(myeq, '[t] = ', sep='')
for (i in 1:k){
if (mysum$coefficients[i,1] > 0) myeq <- paste(myeq, '+', '')
myeq <- paste(myeq, mysum$coefficients[i,1], sep=' ')
if (rownames(mysum$coefficients)[i] != '(Intercept)') {
myeq <- paste(myeq, rownames(mysum$coefficients)[i], sep='')
if (rownames(mysum$coefficients)[i] != 't') myeq <- paste(myeq, '[t]', sep='')
}
}
myeq <- paste(myeq, ' + e[t]')
a<-table.row.start(a)
a<-table.element(a, myeq)
a<-table.row.end(a)
a<-table.end(a)
table.save(a,file='mytable1.tab')
a<-table.start()
a<-table.row.start(a)
a<-table.element(a,hyperlink('ols1.htm','Multiple Linear Regression - Ordinary Least Squares',''), 6, TRUE)
a<-table.row.end(a)
a<-table.row.start(a)
a<-table.element(a,'Variable',header=TRUE)
a<-table.element(a,'Parameter',header=TRUE)
a<-table.element(a,'S.D.',header=TRUE)
a<-table.element(a,'T-STAT
H0: parameter = 0',header=TRUE)
a<-table.element(a,'2-tail p-value',header=TRUE)
a<-table.element(a,'1-tail p-value',header=TRUE)
a<-table.row.end(a)
for (i in 1:k){
a<-table.row.start(a)
a<-table.element(a,rownames(mysum$coefficients)[i],header=TRUE)
a<-table.element(a,mysum$coefficients[i,1])
a<-table.element(a, round(mysum$coefficients[i,2],6))
a<-table.element(a, round(mysum$coefficients[i,3],4))
a<-table.element(a, round(mysum$coefficients[i,4],6))
a<-table.element(a, round(mysum$coefficients[i,4]/2,6))
a<-table.row.end(a)
}
a<-table.end(a)
table.save(a,file='mytable2.tab')
a<-table.start()
a<-table.row.start(a)
a<-table.element(a, 'Multiple Linear Regression - Regression Statistics', 2, TRUE)
a<-table.row.end(a)
a<-table.row.start(a)
a<-table.element(a, 'Multiple R',1,TRUE)
a<-table.element(a, sqrt(mysum$r.squared))
a<-table.row.end(a)
a<-table.row.start(a)
a<-table.element(a, 'R-squared',1,TRUE)
a<-table.element(a, mysum$r.squared)
a<-table.row.end(a)
a<-table.row.start(a)
a<-table.element(a, 'Adjusted R-squared',1,TRUE)
a<-table.element(a, mysum$adj.r.squared)
a<-table.row.end(a)
a<-table.row.start(a)
a<-table.element(a, 'F-TEST (value)',1,TRUE)
a<-table.element(a, mysum$fstatistic[1])
a<-table.row.end(a)
a<-table.row.start(a)
a<-table.element(a, 'F-TEST (DF numerator)',1,TRUE)
a<-table.element(a, mysum$fstatistic[2])
a<-table.row.end(a)
a<-table.row.start(a)
a<-table.element(a, 'F-TEST (DF denominator)',1,TRUE)
a<-table.element(a, mysum$fstatistic[3])
a<-table.row.end(a)
a<-table.row.start(a)
a<-table.element(a, 'p-value',1,TRUE)
a<-table.element(a, 1-pf(mysum$fstatistic[1],mysum$fstatistic[2],mysum$fstatistic[3]))
a<-table.row.end(a)
a<-table.row.start(a)
a<-table.element(a, 'Multiple Linear Regression - Residual Statistics', 2, TRUE)
a<-table.row.end(a)
a<-table.row.start(a)
a<-table.element(a, 'Residual Standard Deviation',1,TRUE)
a<-table.element(a, mysum$sigma)
a<-table.row.end(a)
a<-table.row.start(a)
a<-table.element(a, 'Sum Squared Residuals',1,TRUE)
a<-table.element(a, sum(myerror*myerror))
a<-table.row.end(a)
a<-table.end(a)
table.save(a,file='mytable3.tab')
a<-table.start()
a<-table.row.start(a)
a<-table.element(a, 'Multiple Linear Regression - Actuals, Interpolation, and Residuals', 4, TRUE)
a<-table.row.end(a)
a<-table.row.start(a)
a<-table.element(a, 'Time or Index', 1, TRUE)
a<-table.element(a, 'Actuals', 1, TRUE)
a<-table.element(a, 'Interpolation
Forecast', 1, TRUE)
a<-table.element(a, 'Residuals
Prediction Error', 1, TRUE)
a<-table.row.end(a)
for (i in 1:n) {
a<-table.row.start(a)
a<-table.element(a,i, 1, TRUE)
a<-table.element(a,x[i])
a<-table.element(a,x[i]-mysum$resid[i])
a<-table.element(a,mysum$resid[i])
a<-table.row.end(a)
}
a<-table.end(a)
table.save(a,file='mytable4.tab')
if (n > n25) {
a<-table.start()
a<-table.row.start(a)
a<-table.element(a,'Goldfeld-Quandt test for Heteroskedasticity',4,TRUE)
a<-table.row.end(a)
a<-table.row.start(a)
a<-table.element(a,'p-values',header=TRUE)
a<-table.element(a,'Alternative Hypothesis',3,header=TRUE)
a<-table.row.end(a)
a<-table.row.start(a)
a<-table.element(a,'breakpoint index',header=TRUE)
a<-table.element(a,'greater',header=TRUE)
a<-table.element(a,'2-sided',header=TRUE)
a<-table.element(a,'less',header=TRUE)
a<-table.row.end(a)
for (mypoint in kp3:nmkm3) {
a<-table.row.start(a)
a<-table.element(a,mypoint,header=TRUE)
a<-table.element(a,gqarr[mypoint-kp3+1,1])
a<-table.element(a,gqarr[mypoint-kp3+1,2])
a<-table.element(a,gqarr[mypoint-kp3+1,3])
a<-table.row.end(a)
}
a<-table.end(a)
table.save(a,file='mytable5.tab')
a<-table.start()
a<-table.row.start(a)
a<-table.element(a,'Meta Analysis of Goldfeld-Quandt test for Heteroskedasticity',4,TRUE)
a<-table.row.end(a)
a<-table.row.start(a)
a<-table.element(a,'Description',header=TRUE)
a<-table.element(a,'# significant tests',header=TRUE)
a<-table.element(a,'% significant tests',header=TRUE)
a<-table.element(a,'OK/NOK',header=TRUE)
a<-table.row.end(a)
a<-table.row.start(a)
a<-table.element(a,'1% type I error level',header=TRUE)
a<-table.element(a,numsignificant1)
a<-table.element(a,numsignificant1/numgqtests)
if (numsignificant1/numgqtests < 0.01) dum <- 'OK' else dum <- 'NOK'
a<-table.element(a,dum)
a<-table.row.end(a)
a<-table.row.start(a)
a<-table.element(a,'5% type I error level',header=TRUE)
a<-table.element(a,numsignificant5)
a<-table.element(a,numsignificant5/numgqtests)
if (numsignificant5/numgqtests < 0.05) dum <- 'OK' else dum <- 'NOK'
a<-table.element(a,dum)
a<-table.row.end(a)
a<-table.row.start(a)
a<-table.element(a,'10% type I error level',header=TRUE)
a<-table.element(a,numsignificant10)
a<-table.element(a,numsignificant10/numgqtests)
if (numsignificant10/numgqtests < 0.1) dum <- 'OK' else dum <- 'NOK'
a<-table.element(a,dum)
a<-table.row.end(a)
a<-table.end(a)
table.save(a,file='mytable6.tab')
}